Market Overview
| Study Period | 2020 - 2031 |
|---|---|
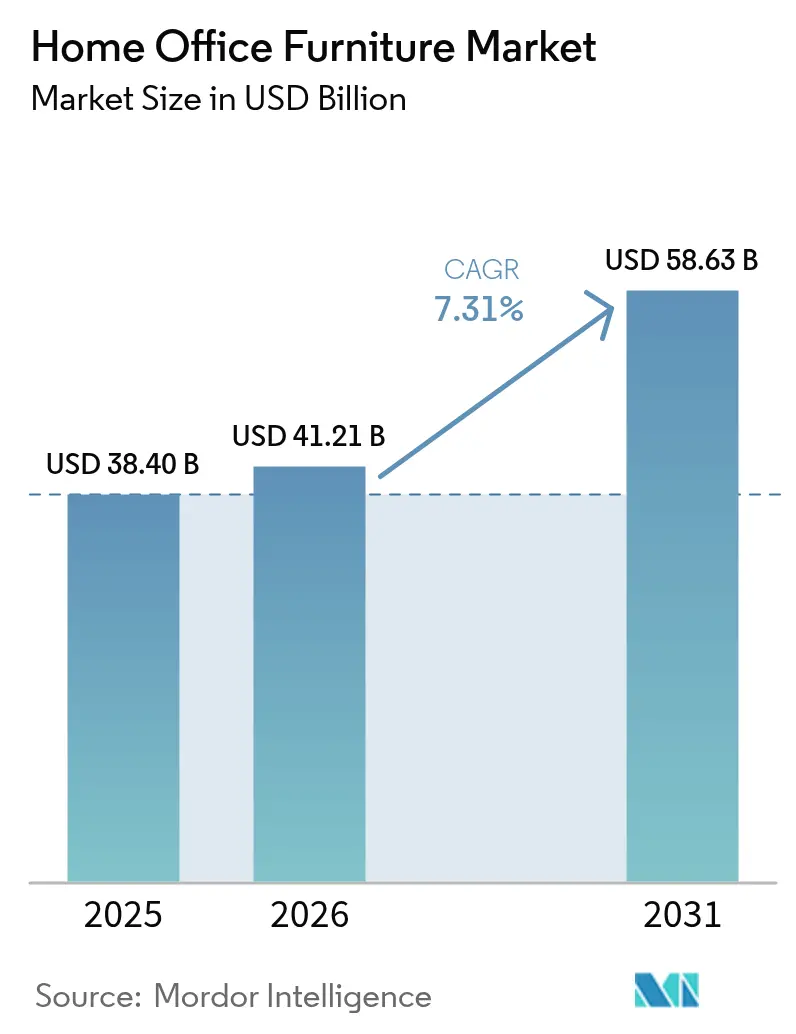
| Market Size (2026) | USD 41.21 Billion |
| Market Size (2031) | USD 58.63 Billion |
| Growth Rate (2026 - 2031) | 7.31% CAGR |
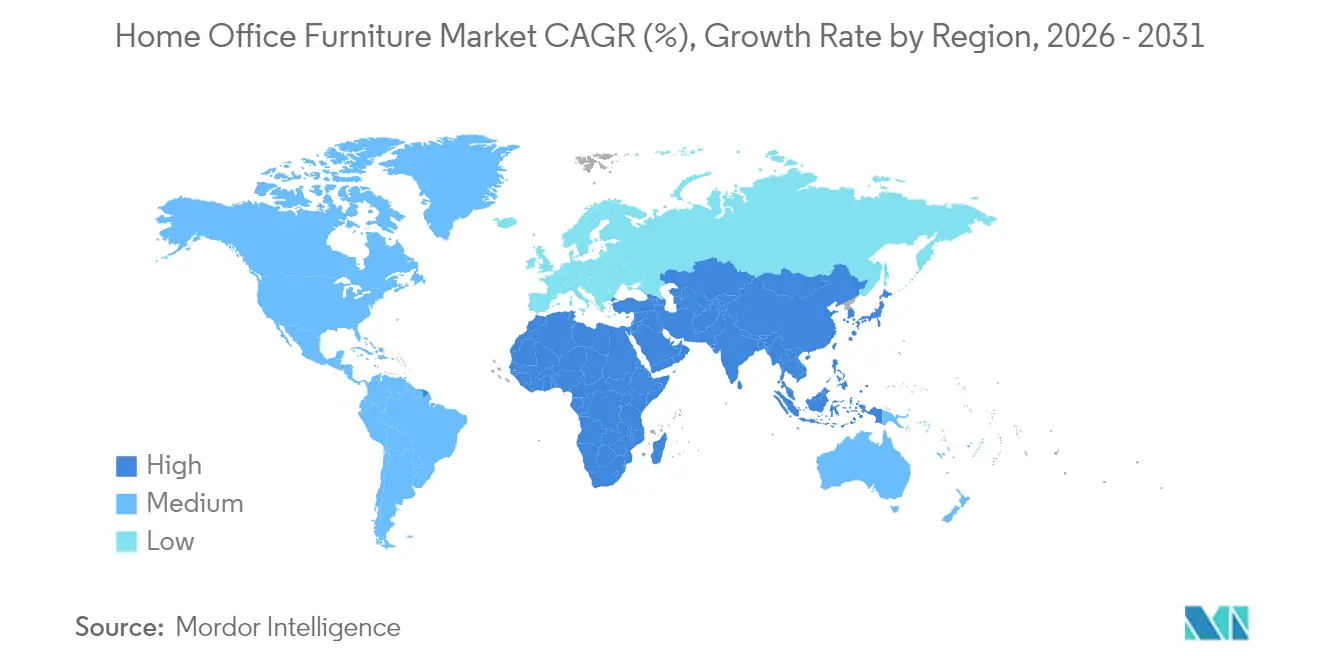
| Fastest Growing Market | Asia Pacific |
| Largest Market | North America |
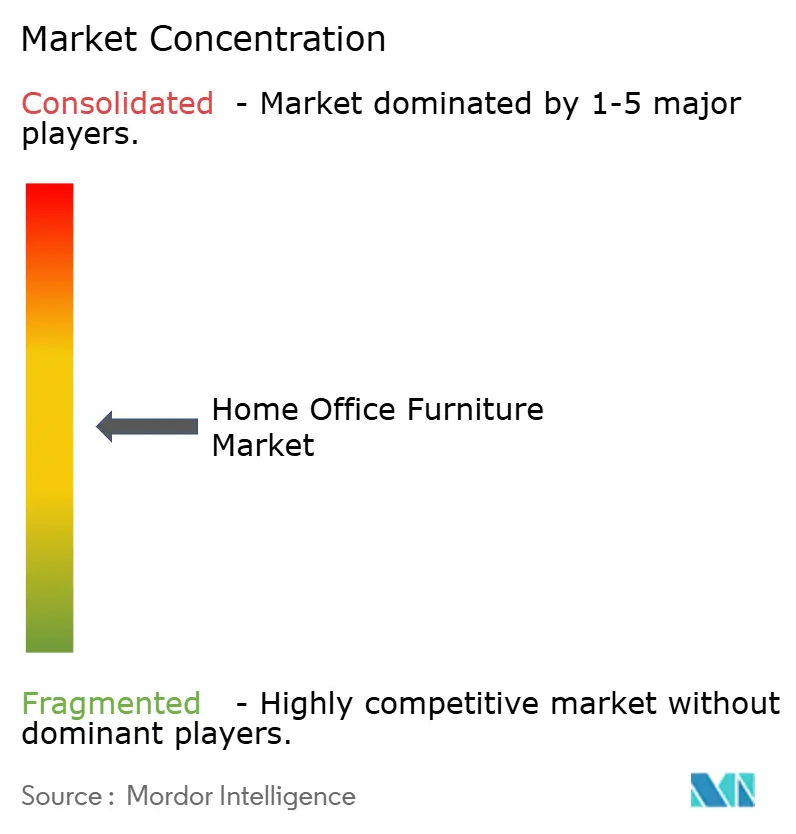
| Market Concentration | Medium |
Major Players *Disclaimer: Major Players sorted in no particular order Image © Mordor Intelligence. Reuse requires attribution under CC BY 4.0. | |
Home Office Furniture Market Analysis by Mordor Intelligence
The Home Office Furniture market size is expected to grow from USD 38.40 billion in 2025 to USD 41.21 billion in 2026 and is forecast to reach USD 58.63 billion by 2031 at 7.31% CAGR over 2026-2031.
Sustained hybrid-work policies have moved home workspace spending from discretionary to structural, ensuring a steady demand baseline even as corporate real-estate footprints contract. Asia-Pacific’s manufacturing depth and rising household incomes amplify this momentum, while North America and Europe remain anchored by strict ergonomic guidelines that turn compliance spending into recurring revenue. Online platforms, bolstered by social-commerce tools and quick-ship networks, compress purchase cycles and help mid-tier brands achieve national reach without store build-outs. Material substitution, especially recycled plastics, mitigates input-price shocks and enhances environmental credentials that now influence more than one-third of purchase decisions across developed markets. Competitive intensity stays moderate with the top five suppliers controlling a good chunk of the global revenues, leaving space for design-focused challengers to scale rapidly through direct-to-consumer models.
Key Report Takeaways
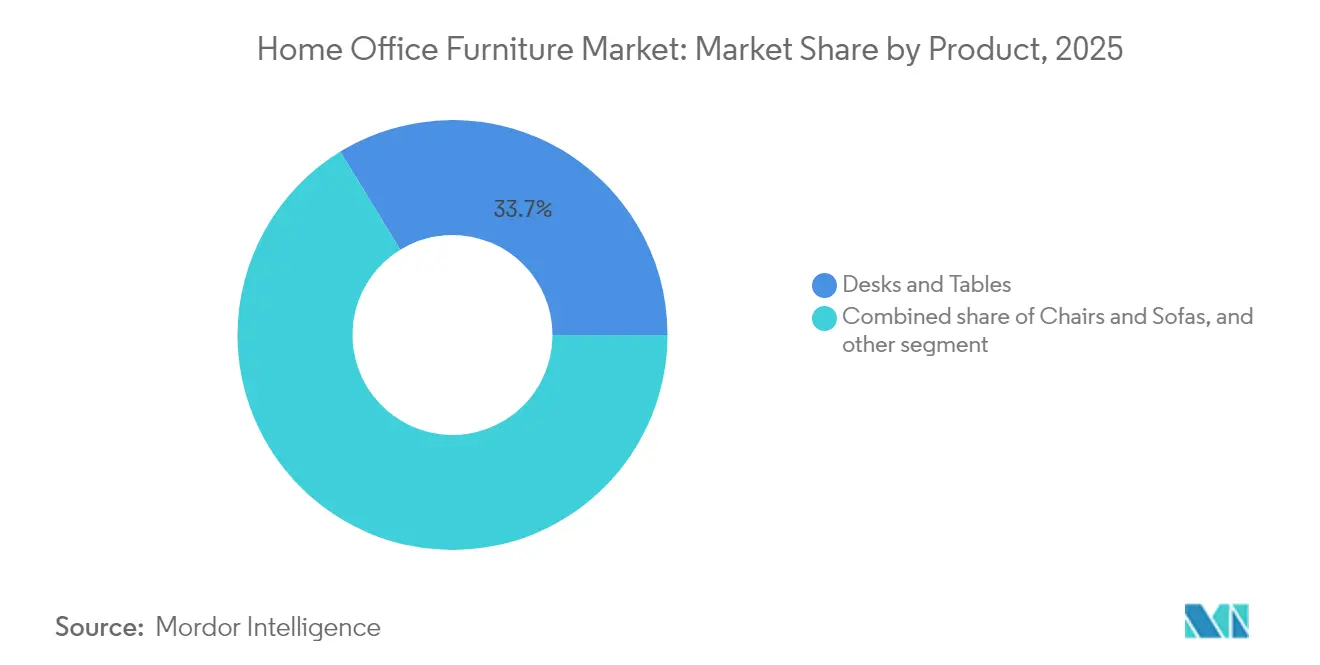
- By product, desks & tables held 33.74% of the home office furniture market share in 2025, while Smart Desks with IoT sensors are forecast to grow at a 10.23% CAGR to 2031.
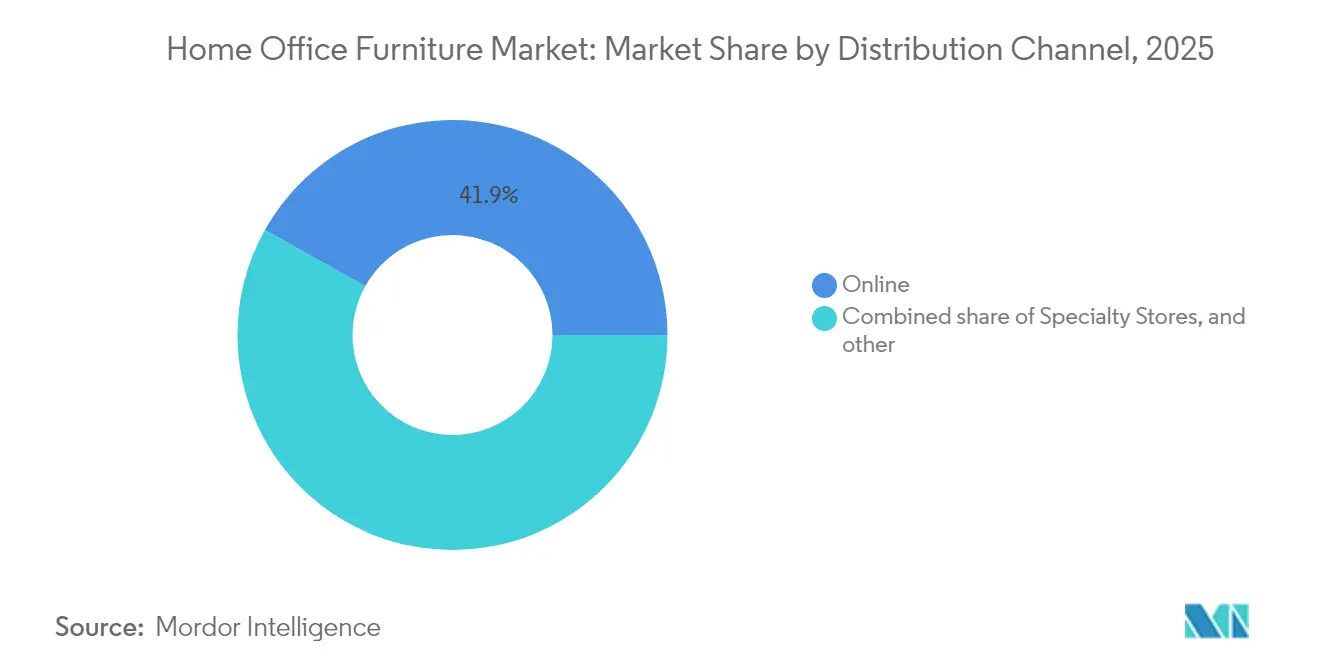
- By distribution channel, the online segment captured 41.88% of the home office furniture market share in 2025; Direct-to-Consumer sales are set to expand at a 14.10% CAGR through 2031.
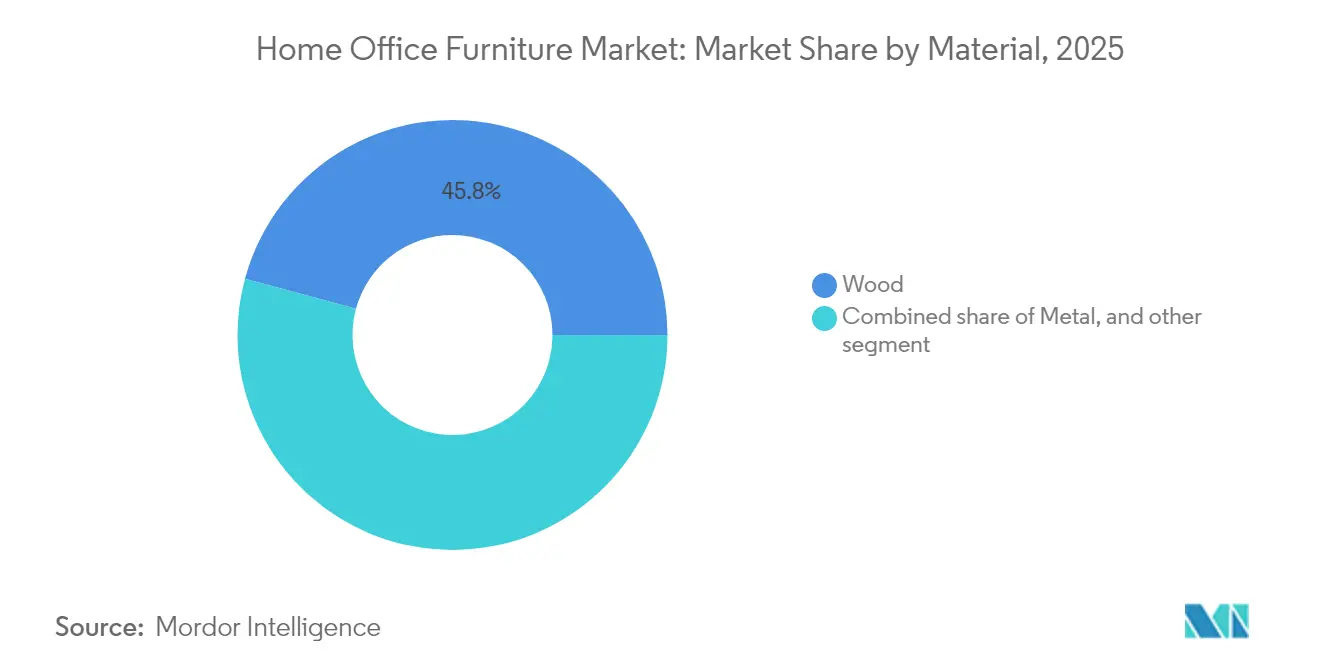
- By material, wood accounted for 45.78% of the home office furniture market size in 2025, whereas Recycled Plastics are advancing at an 8.05% CAGR during the outlook period.
- By geography, Asia-Pacific contributed 38.05% of the home office furniture market share in 2025 and is projected to register a 9.78% CAGR up to 2031.
Note: Market size and forecast figures in this report are generated using Mordor Intelligence’s proprietary estimation framework, updated with the latest available data and insights as of 2026.
Global Home Office Furniture Market Trends and Insights
Drivers Impact Analysis*
| Driver | (~) % Impact on CAGR Forecast | Geographic Relevance | Impact Timeline |
|---|---|---|---|
| Hybrid & remote-work permanence | +2.1% | Global, with highest impact in North America & Europe | Long term (≥ 4 years) |
| Surge in ergonomic-wellness regulations | +1.8% | North America & EU primary, APAC emerging | Medium term (2-4 years) |
| Digitally native furniture brands' scale-up | +1.4% | Global, led by APAC and North America | Medium term (2-4 years) |
| Consumer shift to premium multifunctional designs | +1.2% | APAC core, spill-over to North America & EU | Long term (≥ 4 years) |
| Circular-economy resale platforms' growth | +0.7% | North America & EU, expanding to APAC | Short term (≤ 2 years) |
| AI-enabled mass-custom manufacturing | +0.6% | APAC manufacturing hubs, global distribution | Long term (≥ 4 years) |
| Source: Mordor Intelligence | |||
Hybrid & Remote-Work Permanence
Corporate policies now encode two to three remote days weekly, transforming one-time lockdown purchases into predictable replacement cycles that stabilize the home office furniture market[1]Nicholas Bloom et al., “Survey: Remote Work Isn't Going Away — and Executives Know It,” Harvard Business Review, hbr.org. . Demand extends beyond knowledge workers as sectors such as financial services and healthcare adopt flexible scheduling to widen talent pools. Employers subsidize desk-chair bundles to cut workers’ compensation risk, while insurers increasingly require proof of ergonomic provisioning. Height-adjustable desks, monitor arms, and anti-fatigue mats, therefore, become standard procurement line items rather than elective perks. Sales spikes coincide with corporate hardware refreshes, locking furniture into the same three-to-five-year capex rhythm as laptops. The resulting revenue predictability supports longer production runs that lower unit costs and expand mid-price offerings. Asia-Pacific gains an export advantage because regional factories can switch swiftly between contract and consumer SKUs without violating global quality norms.
Surge in Ergonomic-Wellness Regulations
United States OSHA advisories and EU directives now cover remote settings, mandating adjustable seating, keyboard-tray ergonomics, and minimum lighting levels [2]Heather Ritz, “Top 5 Ergonomic Trends to Watch in 2025,” Briotix Health, briotix.com. . Employers that fail to comply face fines and higher health-insurance premiums, prompting bulk-purchase agreements with certified suppliers. Product certification labels—GREENGUARD, BIFMA LEVEL, and GS—act as tender pre-requisites for enterprise buyers. Manufacturers respond by integrating sensors that measure seat occupancy and posture, generating compliance reports that satisfy auditors. Insurance carriers bundle premium discounts with verified ergonomic deployments, reinforcing hardware upgrades every four years. North American demand spikes first, but similar rules appear in Japan and Australia, suggesting global standardization by 2028. The regulatory floor thus underpins a durable premium segment within the home office furniture market.
Digitally Native Furniture Brands’ Scale-Up
Pure-play e-commerce brands move from niche to mainstream, capturing over one-quarter of incremental category growth between 2022 and 2024, according to trade association shipment data[3]BIFMA, “North American Furniture Trade Under Pressure as Tariff Concerns Grow,” globalwood.org. . Their data-rich direct-to-consumer channels halve design-to-launch cycles by crowdsourcing feature feedback, letting them update SKUs at twice the speed of legacy rivals. Social-media product drops create demand spikes that logistics partners fulfill through micro-fulfillment hubs. Subscription models for desks and chairs emerge, bundling maintenance and upgrade options that flatten revenue seasonality. Traditional retailers counter with online configurators and same-day click-and-collect programs, narrowing experiential gaps. As last-mile costs fall through route-optimization software, online price premiums compress, further shifting volume away from physical stores. The home office furniture market thus pivots to an omnichannel equilibrium in which digital discovery precedes almost every store visit.
Consumer Shift to Premium Multifunctional Designs
Urban households in Tokyo, Mumbai, and São Paulo allocate under 180 square feet for combined living and working needs, spurring demand for desks that convert into dining tables and wall-mounted storage that doubles as video-conference backdrops. Buyers accept 20–35% price premiums when furniture saves space and preserves interior aesthetics. Manufacturers deploy lightweight composites and hidden casters so users can reconfigure rooms daily without specialized tools. Integrated cable-management systems keep work areas uncluttered, a feature consumers rank among their top three purchase criteria in recent user surveys published by component suppliers. Smart-lighting add-ons synchronize with desk height and ambient conditions, further elevating perceived value. As patents in convertible mechanisms rise, entry barriers harden, rewarding early innovators with licensing income. Multifunctional design, therefore, propels average selling prices faster than raw-material inflation, protecting margins across the home office furniture market.
Restraints Impact Analysis*
| Restraint | (~) % Impact on CAGR Forecast | Geographic Relevance | Impact Timeline |
|---|---|---|---|
| Volatile raw-material (wood & metal) prices | -1.9% | Global, with highest impact in North America & Europe | Short term (≤ 2 years) |
| Rising freight & logistics costs | -1.3% | Global, particularly affecting import-dependent regions | Medium term (2-4 years) |
| Work-from-home tax incentive roll-backs | -0.8% | North America primary, selective EU markets | Short term (≤ 2 years) |
| Home-space constraints in megacities | -0.6% | APAC megacities, expanding to global urban centers | Long term (≥ 4 years) |
| Source: Mordor Intelligence | |||
Volatile Raw-Material Prices
Lumber futures swung 38% between January and July 2025 as wildfire disruptions coincided with tariff uncertainty, eroding gross margins for wood-heavy SKUs. Steel and aluminum spot prices followed energy-cost gyrations, pushing metal-frame chair prices up 6% in North America during Q2. Manufacturers lock in supply through forward contracts, yet smaller vendors lack hedge access and pass costs downstream, dampening demand in price-sensitive segments. Recycled plastic adoption eases some pressures but faces feedstock shortages when consumer-recycling rates dip. Inventory buffers mitigate shocks yet tie up working capital, raising financing costs amid rising interest rates. Price volatility also complicates catalog updates, forcing retailers to issue frequent price-adjustment notices that curb promotional traction. These factors jointly shave nearly two percentage points off the home office furniture market CAGR forecast.
Rising Freight & Logistics Costs
Container spot rates on the Shanghai–Los Angeles route hit USD 4,200 in May 2025—up 75% year-over-year—due to equipment shortages and fuel surcharges. Furniture’s bulky dimensions attract dimension-weight penalties that add 10–12% to landed costs, especially for assembled desks. Retailers shift to flat-pack designs that fit more units per container, but last-mile assembly needs inflate service fees. Manufacturers explore regional production hubs in Mexico and Eastern Europe to shorten transit times, yet navigating multiple regulatory regimes raises compliance complexity. Ocean-freight volatility also triggers inventory-planning errors, resulting in stockouts that prompt consumers to switch brands. While multi-port routing and warehouse automation trim lead times, sustained logistics inflation still subtracts over one point from the category’s long-term growth pace.
*Our forecasts treat driver/restraint impacts as directional, not additive. The impact forecasts reflect baseline growth, mix effects, and variable interactions.
Segment Analysis
By Product: Smart Integration Outpaces Core Lines
Desks & Tables accounted for 33.74% of 2025 revenue and remain the anchor of the home office furniture market; the segment’s stability stems from universal workstation needs and rising ergonomic-height adoption rates. Within this cohort, Smart Desks—a sub-segment equipped with IoT sensors that log posture and usage metrics—are projected to expand at a 10.23% CAGR, far outrunning legacy models. This momentum benefits from enterprise wellness programs that subsidize connected hardware, making real-time analytics a procurement criterion. Chairs & Sofas follow at 29.72% share, lifted by headrest and lumbar innovations that meet updated ISO ergonomics norms. Storage Units, while holding 18.15% share, align closely with hybrid-work patterns as households seek lockable compartments to separate professional files from personal items. The remaining 18.39% share splits across lighting, acoustic panels, and accessories that round out complete workstation environments. Supplier R&D increasingly targets integrated USB-C charging, wireless-power modules, and voice-activated height presets that raise switching costs and deepen replacement cycles.
Manufacturers now market product bundles rather than single SKUs, intensifying cross-selling rates and elevating average order values by 22% according to order-management platform tallies published by leading logistics integrators. Retail analytics show that households purchasing a smart desk have a 42% probability of adding a premium task chair within six months, validating lifecycle-based marketing tactics. Intellectual-property filings for cable-management grommets, sensor arrays, and AI-adjustable actuators jumped 17% year-on-year in 2024, indicating sustained innovation depth. As tech ecosystems mature, interoperability standards emerge that mirror smart-home protocols, enabling third-party accessories to tap into desk-resident data streams. The product hierarchy therefore shifts toward platform-oriented models where desks operate as hubs for peripherals, reinforcing the home office furniture market’s premiumization trajectory.


By Distribution Channel: E-Commerce Widens Lead
Online platforms captured 41.88% of category revenue in 2025, buoyed by augmented-reality visualization tools that cut cart-abandonment rates below 4%, compared with 11% for sites lacking 3D previews. Within digital channels, Direct-to-Consumer storefronts are forecast to grow at 14.10% CAGR as vertically integrated brands exploit data analytics to optimize inventory and pricing. Specialty Stores maintain a resilient 33.94% share because professional fitting services add tangible value for high-end ergonomic chairs that require precise adjustments. Home Centers and DIY outlets hold 24.18% share, favored by cost-conscious buyers undertaking self-assembly projects. The Online segment’s ascendance forces brick-and-mortar chains to reconfigure floor space for click-and-collect lockers and in-store video-consultation booths that replicate digital research journeys. Partnership models evolve as logistics firms offer white-label same-day delivery, enabling mid-size retailers to promise Amazon-comparable lead times without building proprietary fleets.
Digital payment adoption accelerates furniture checkout conversions, with buy-now-pay-later plans accounting for 18% of online ticket volumes in North America during 2024. Enhanced product-return algorithms pre-approve size-risk orders only if margin buffers cover potential reverse-logistics costs, shielding profitability. Artificial-intelligence chatbots resolve 82% of pre-purchase queries in under three minutes, further lifting customer-satisfaction scores. Cyber-fraud remains an operational drag, however, prompting multi-factor authentication rollouts that momentarily lengthen checkout flows. The overall channel shift cements e-commerce as the primary discovery medium, even when final transactions occur in physical stores, ensuring digital touchpoints influence virtually every dollar circulating through the home office furniture market.
By Material: Circularity Gains Share
Wood remains the backbone with a 45.78% revenue share, yet life-cycle analyses reveal a 23% carbon-footprint gap between certified and non-certified lumber, driving procurement policies toward FSC-labeled sources. Recycled Plastics, growing at an 8.05% CAGR, benefit from closed-loop supply agreements where post-consumer waste is converted into polypropylene chair shells with 30-year durability warranties. Engineered Wood holds 28.34% share, offering dimensional stability that pure hardwood lacks in fluctuating humidity conditions. Metal frames account for 21.12% of sales and dominate weights-and-measures critical applications such as sit-stand bases requiring torsional rigidity. Hybrid composites—hemp fiber-reinforced polymers, mycelium foams—constitute the balance, and while currently niche, they command media attention that garners early-adopter premiums.
Material innovation aligns tightly with corporate ESG scorecards, prompting tier-one suppliers to publish environmental product declarations that quantify emissions savings. Governments in Germany, Canada, and South Korea now provide tax credits worth up to 12% of invoice values for furniture made with at least 30% recycled content, generating measurable demand spikes. Modular construction and single-fastener design philosophies ease disassembly, letting end-of-life panels re-enter supply chains more economically. Consequently, recyclability shifts from differentiator to baseline expectation, reshaping sourcing, pricing, and brand narratives across the home office furniture market size calculations.
Geography Analysis
Asia-Pacific generated 38.05% of global revenue in 2025 and is projected to expand at 9.78% CAGR through 2031 the rare case where the largest market is also the fastest growing. China alone delivers over one-third of worldwide furniture output, leveraging integrated supplier clusters that compress lead times and permit custom finishes without excess inventory . India and Vietnam increasingly absorb overflow orders as wage differentials narrow, diversifying regional capacity and cushioning tariff risks. North America follows with a 32.11% share; robust corporate subsidy programs for remote-work setups offset soft residential remodeling volumes. Europe, at 29.84%, pivots toward eco-design mandates that stimulate demand for certified timber and recyclable polymers, albeit at a more measured 4.86% CAGR.
Middle East & Africa emerges as the second-fastest expanding bloc at 7.32% CAGR, catalyzed by Gulf megaprojects that incorporate smart-city work-live units demanding compact, IoT-ready furnishings. South America advances 6.54%, aided by rising white-collar employment and regional free-trade pacts that lower cross-border duties on flat-pack kits. Regional purchasing preferences differ, yet a convergent trend toward space-efficient, technology-enabled solutions underpins universal growth, making geography a function of adoption speed rather than directional divergence.

Competitive Landscape
The industry shows a moderate level of concentration, with the top five players, HNI Corporation, Steelcase, MillerKnoll, IKEA, and Herman Miller, together accounting for a significant share of global sales. HNI’s acquisition of Steelcase, valued at USD 2.2 billion and expected to close by late 2025, is set to substantially increase its market presence and reshape the competitive landscape of the home office furniture market. Mergers target scale synergies in procurement and freight, as resin and steel volumes drive multi-million-dollar rebate thresholds.
Technological differentiation intensified with MillerKnoll piloting cloud-linked seating that logs posture data and feeds AI wellness dashboards, while IKEA tests circular-economy buy-back kiosks at metro-area stores. Patent race momentum shows 9% year-over-year growth in filings related to motor-noise reduction and sensor calibration. Sustainability remains a pivotal theme, with Herman Miller’s carbon-negative composites garnering enterprise RFP preference scores.
Regional specialists thrive on speed; Vietnamese contract manufacturers promise 45-day concept-to-container cycles for private-label clients, undercutting large incumbents on niche SKUs. Digital disruptors invest venture capital in last-mile assembly fleets, turning formerly profit-sapping service calls into branded customer-experience touchpoints. Altogether, rivalry centers on who best marries design, sustainability, and digital enablement rather than price alone, sustaining dynamic churn within the Home Office Furniture market.
Home Office Furniture Industry Leaders
IKEA
Steelcase Inc.
Ashley Furniture Industries
MillerKnoll (Herman Miller + Knoll)
HNI Corporation
- *Disclaimer: Major Players sorted in no particular order

Recent Industry Developments
- August 2025: HNI Corporation agreed to acquire Steelcase for USD 2.2 billion in cash and stock, aiming for closure by year-end.
- August 2025: IKEA launched IKEA Preowned, a peer-to-peer marketplace for second-hand furniture currently being tested in Madrid and Oslo, targeting the growing second-hand market where IKEA products represent 10% of global resale volume.
- August 2024: Herman Miller introduced the Eames Turned Stool in white oak finish, expanding the iconic collection originally designed by Charles and Ray Eames with new material options while maintaining original dimensions and craftsmanship standards.
- June 2024: PARIC Holdings completed acquisition of Corporate Concepts, a major contract furniture dealer in the Midwest, expanding service capabilities for modern office solutions as companies adapt to evolving workplace requirements.


Global Home Office Furniture Market Report Scope
The report on home office furniture provides a comprehensive evaluation of the market, with an analysis of the segments in the market. The report also focuses on the exhaustive trends in import/export, production and consumption data of the product, policies and plans, cost structures, and manufacturing processes. Moreover, the report also provides competitive profile of the key manufacturers, along with regional analysis.
By Product
| Chairs & Sofas |
| Storage Units |
| Desks & Tables |
| Other Home Office Furniture |
By Distribution Channel
| Home Centers / DIY Stores |
| Specialty Stores |
| Online |
| Other Distribution Channels |
By Material
| Wood |
| Metal |
| Plastic & Acrylic |
| Engineered Wood (MDF, Particleboard) |
| Other Materials |
By Geography
| North America | Canada |
| United States | |
| Mexico | |
| South America | Brazil |
| Peru | |
| Chile | |
| Argentina | |
| Rest of South America | |
| Europe | United Kingdom |
| Germany | |
| France | |
| Spain | |
| Italy | |
| BENELUX (Belgium, Netherlands, Luxembourg) | |
| NORDICS (Denmark, Finland, Iceland, Norway, Sweden) | |
| Rest of Europe | |
| Asia-Pacific | India |
| China | |
| Japan | |
| Australia | |
| South Korea | |
| South-East Asia (Singapore, Malaysia, Thailand, Indonesia, Vietnam, Philippines) | |
| Rest of Asia-Pacific | |
| Middle East and Africa | United Arab Emirates |
| Saudi Arabia | |
| South Africa | |
| Nigeria | |
| Rest of Middle East and Africa |
| By Product | Chairs & Sofas | |
| Storage Units | ||
| Desks & Tables | ||
| Other Home Office Furniture | ||
| By Distribution Channel | Home Centers / DIY Stores | |
| Specialty Stores | ||
| Online | ||
| Other Distribution Channels | ||
| By Material | Wood | |
| Metal | ||
| Plastic & Acrylic | ||
| Engineered Wood (MDF, Particleboard) | ||
| Other Materials | ||
| By Geography | North America | Canada |
| United States | ||
| Mexico | ||
| South America | Brazil | |
| Peru | ||
| Chile | ||
| Argentina | ||
| Rest of South America | ||
| Europe | United Kingdom | |
| Germany | ||
| France | ||
| Spain | ||
| Italy | ||
| BENELUX (Belgium, Netherlands, Luxembourg) | ||
| NORDICS (Denmark, Finland, Iceland, Norway, Sweden) | ||
| Rest of Europe | ||
| Asia-Pacific | India | |
| China | ||
| Japan | ||
| Australia | ||
| South Korea | ||
| South-East Asia (Singapore, Malaysia, Thailand, Indonesia, Vietnam, Philippines) | ||
| Rest of Asia-Pacific | ||
| Middle East and Africa | United Arab Emirates | |
| Saudi Arabia | ||
| South Africa | ||
| Nigeria | ||
| Rest of Middle East and Africa | ||


Key Questions Answered in the Report
How large is the Home Office Furniture market in 2026?
The Home Office Furniture market size is valued at USD 41.21 billion in 2026.
What is the current Home Office Furniture Market size?
In 2026, the Home Office Furniture Market size is expected to reach USD 41.21 billion.
What is the expected growth rate for Home Office Furniture through 2031?
The market is projected to expand at a 7.31% CAGR, reaching USD 58.63 billion by 2031.
Which product category leads sales today?
Desks & Tables hold the largest revenue share at 33.74% as of 2025.
Which distribution channel is growing fastest?
Direct-to-Consumer sales are forecast to grow at 14.10% CAGR through 2031.
Why is Asia-Pacific critical to future expansion?
Asia-Pacific commands 38.05% of current revenue and is set to grow at 9.78% CAGR, driven by manufacturing depth and rising consumer incomes.
What impact do raw-material costs have on the sector?
Volatile lumber and steel prices reduce the forecast CAGR by roughly 1.9%, pressuring margins and pricing strategies.
Page last updated on:


