Home and Property Improvement
9th JuneA Leading Sanitaryware Company’s Journey in Saudi Arabia
4 Min Read
The United States Furniture Market Report is Segmented by Application (Home Furniture, Office Furniture, Hospitality Furniture, and More), Material (Wood, Metal, Plastic and Polymer, Other Materials), Price Range (Economy, Mid-Range, Premium), Distribution Channel (B2C/Retail, B2B/Project), and Geography (Northeast, Midwest, Southeast, Southwest, West). The Market Forecasts are Provided in Terms of Value (USD).
Market Overview
| Study Period | 2019 - 2030 |
|---|---|
| Base Year For Estimation | 2024 |
| Forecast Data Period | 2025 - 2030 |
| Market Size (2025) | USD 193.60 Billion |
| Market Size (2030) | USD 232.61 Billion |
| Growth Rate (2025 - 2030) | 3.74 % CAGR |
| Market Concentration | Medium |
Major Players *Disclaimer: Major Players sorted in no particular order. Image © Mordor Intelligence. Reuse requires attribution under CC BY 4.0. |
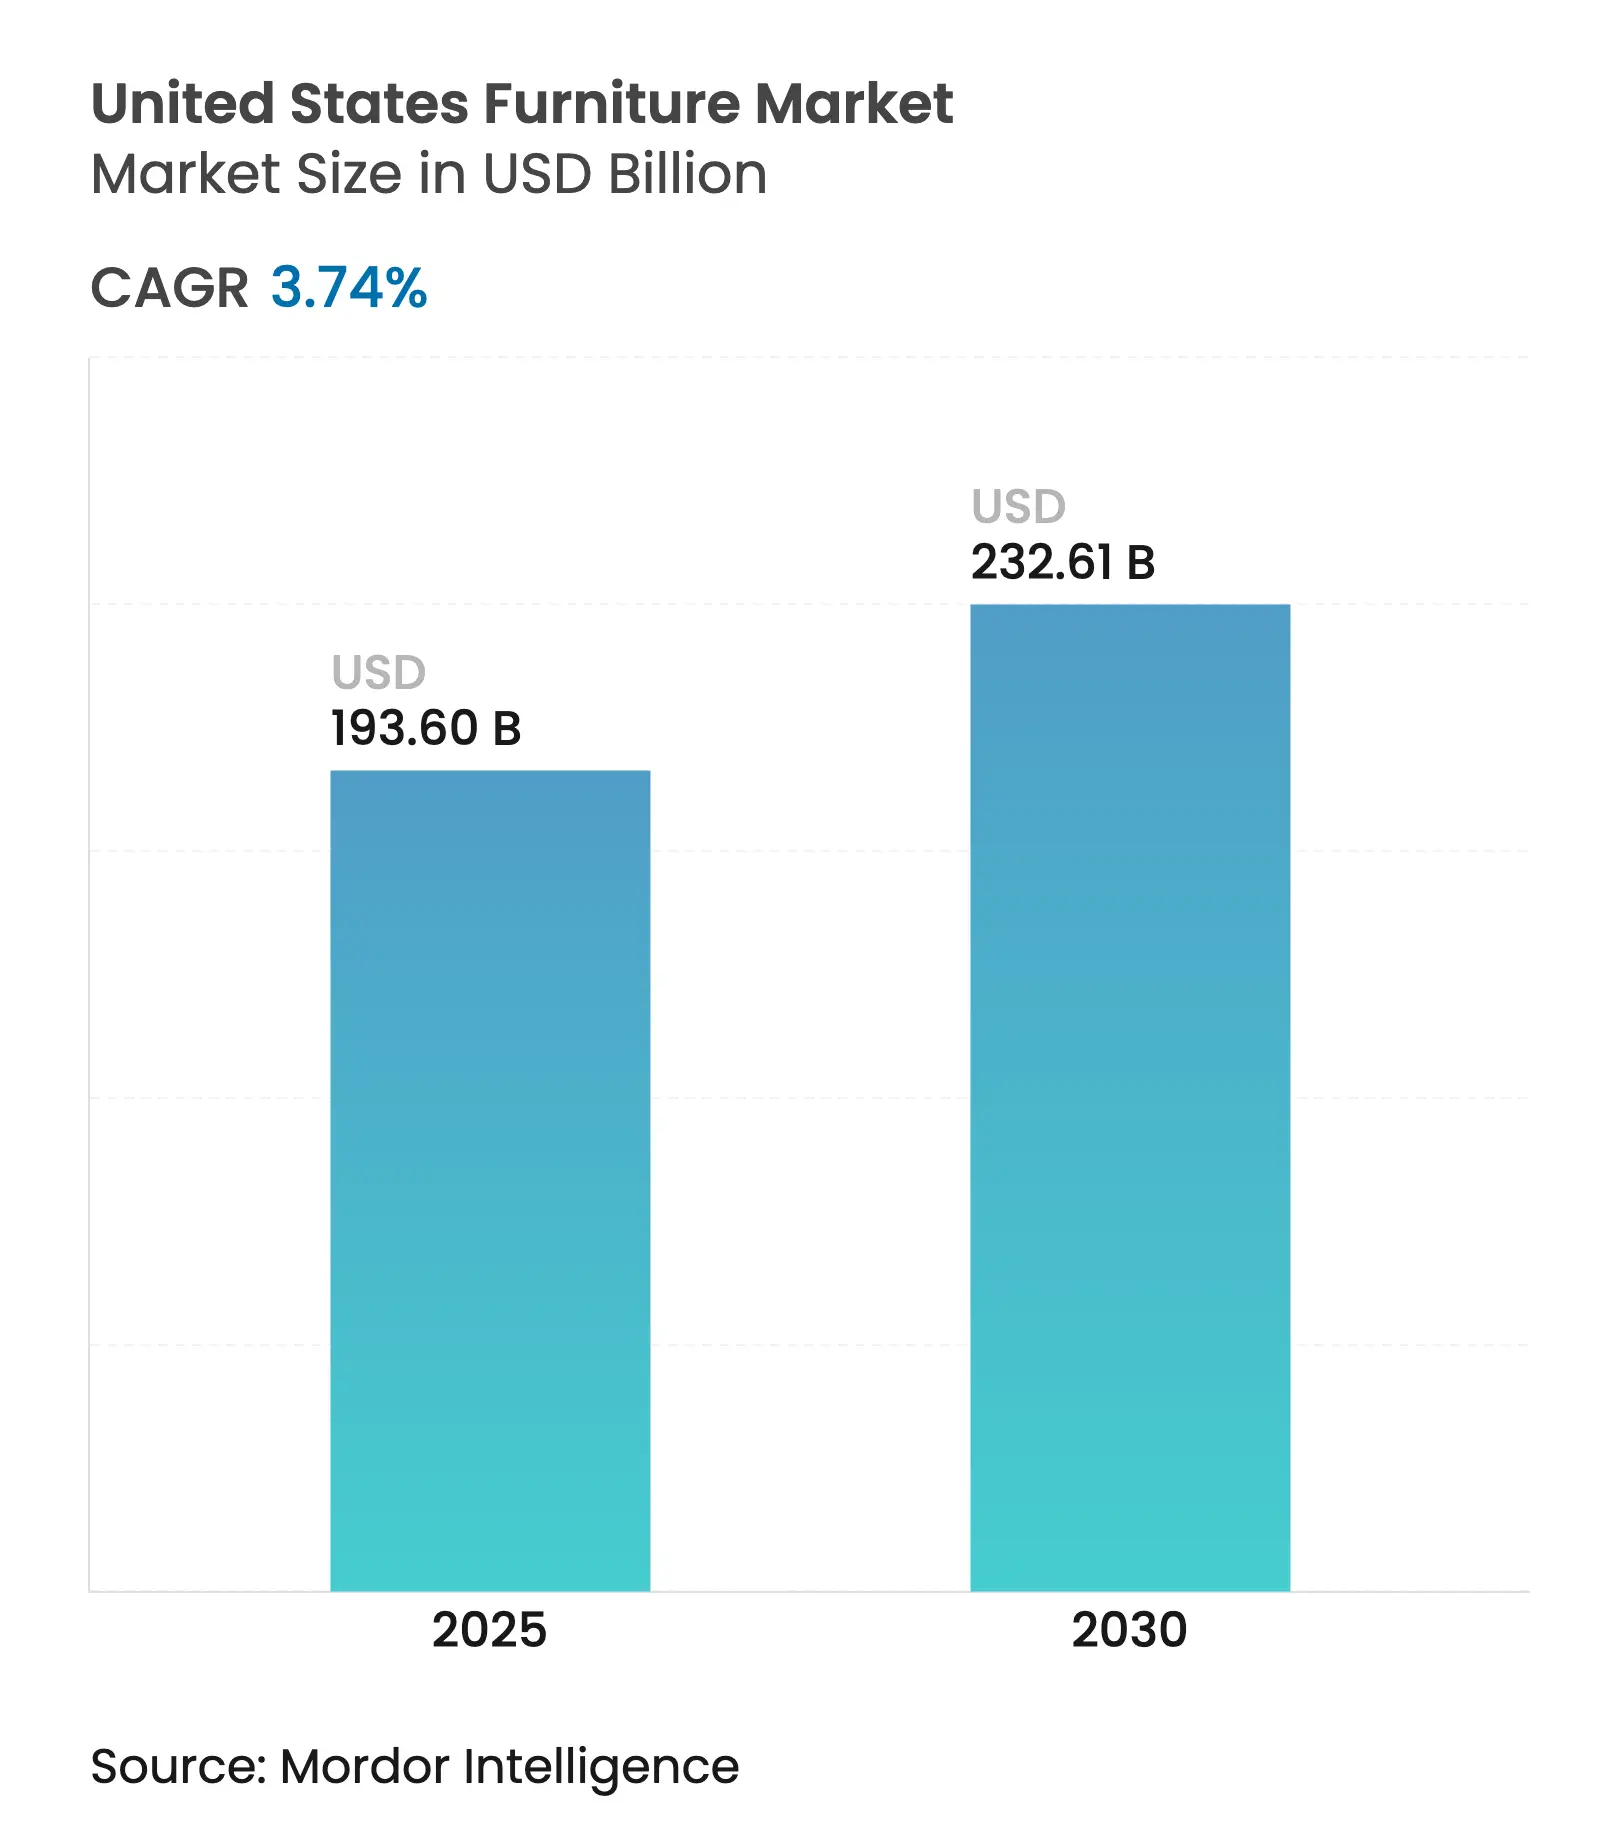
The United States furniture market size is valued at USD 193.60 billion in 2025 and is forecast to reach USD 232.61 billion by 2030 at a 3.74% CAGR. Muted post-pandemic growth reflects a return to demand patterns tied to housing turnover rather than emergency home-office purchases. Disposable-income pressure keeps volume steady but redirects spending toward durable pieces that justify higher ticket prices. Persistent container-rate volatility trims margins, prompting brands to build inventory closer to consumption hubs. Integrated omnichannel models gain ground as consumers toggle between store showrooms and digital configurators, while automated production offsets domestic labor gaps. Altogether, the United States furniture market continues to expand, albeit at a deliberate pace defined by supply-chain agility and value-driven buying behavior.
Key Report Takeaways
Drivers Impact Analysis
| Driver | (~) % Impact on CAGR Forecast | Geographic Relevance | Impact Timeline | |||
|---|---|---|---|---|---|---|
Post-pandemic home-upgrading boom
Post-pandemic home-upgrading boom
| +0.8% | National, suburban focus | Medium term (2-4 years) |
(~) % Impact on CAGR Forecast
:
+0.8%
|
Geographic Relevance
:
National, suburban focus
|
Impact Timeline
:
Medium term (2-4 years)
|
Surge in housing starts and remodeling
permits
Surge in housing starts and remodeling
permits
| +0.9% | Southeast & West | Long term (≥ 4 years) | |||
E-commerce-enabled bulky-goods logistics
E-commerce-enabled bulky-goods logistics
| +0.6% | National, urban nodes | Short term (≤ 2 years) | |||
Contract furniture demand from hybrid
workspaces
Contract furniture demand from hybrid
workspaces
| +0.5% | Metro commercial cores | Medium term (2-4 years) | |||
ESG-driven material substitution
ESG-driven material substitution
| +0.4% | National, premium buyers | Long term (≥ 4 years) | |||
AI-assisted mass-customization platforms
AI-assisted mass-customization platforms
| +0.3% | Tech-forward states | Long term (≥ 4 years) | |||
| Source: Mordor Intelligence | ||||||
Post-pandemic home-upgrading boom
Remote-work legacies continue to nudge replacement cycles upward even after 2021’s spending spike[1]William Blair, “Furniture and Home Renovations Post Pandemic Normalization,” williamblair.com. Mortgage rates easing toward the mid-5% range could unlock a fresh wave of mobility-driven furniture purchases tied to existing home sales. Younger households channel budgets toward sectional sofas and modular storage that optimize smaller footprints. Premium lines gain from consumers framing furniture as a long-term investment, which underpins the 4.31% CAGR in the upper tier. Domestic manufacturers benefit because shoppers equate U.S. production with quality and faster lead times. Consequently, the United States furniture market captures incremental value rather than pure volume growth.
Surge in housing starts and remodeling permits
December 2024 housing starts climbed 15.8% year-on-year to 1.50 million units, extending momentum into 2025 completions[2]National Association of Home Builders, “Housing Starts End 2024 on an Up Note,” nahb.org. Single-family homes, which generate higher per-unit furniture outlays, improved 6.5% during the year and reinforce Home Furniture’s 63.1% share. Build-to-rent projects now specify standardized furniture kits, adding predictable contract volumes. Regional permits diverge, with Northeast and Midwest edging up while Western markets taper, creating inventory allocation challenges. Remodeling activity steers dollars to kitchen cabinets and dining sets, where replacement frequency is shorter, amplifying mid-cycle spending within the United States furniture market.
E-commerce-enabled bulky-goods logistics
Automated flat-pack picking systems, capable of performing 290 picks per hour, enable online retailers to meet two-day delivery commitments while controlling labor costs. Parcel-carrier surcharges on oversized shipments are driving demand toward specialized "big and bulky" networks that optimize delivery through consolidated milk-run routes. Augmented-reality applications are mitigating return rates by allowing customers to visualize product scales and finishes within their homes, thereby safeguarding the narrow profit margins of e-commerce. The integration of showroom visits with digital configuration tools is enhancing the omnichannel experience, enabling brands to expand their customer base. This shift is propelling the U.S. furniture market toward 24/7 service expectations, aligning with evolving consumer demands. Together, these advancements are reshaping operational efficiencies and customer engagement strategies within the market.
Contract furniture demand from hybrid workspaces
The demand for modular desks, movable dividers, and adaptable lounge clusters in activity-based office layouts is expected to grow steadily through 2027. MillerKnoll’s Americas Contract business, accounting for 62% of its revenue, indicates a recovery in corporate refresh budgets following delays during 2022-2023[3]DCF Modeling, “MillerKnoll Inc. Overview,” dcfmodeling.com. Similar trends are observed in the education and healthcare sectors, where flexible classrooms and easily sanitized treatment areas are gaining traction. In the hospitality sector, furniture sales are experiencing a 4.54% growth as hotels repurpose lobbies into co-working spaces. These shifts highlight a broader pivot across non-residential segments toward adaptable environments. The U.S. furniture market is positioned to benefit significantly from this transition, driven by evolving customer needs in various verticals. This adaptability-focused approach is reshaping furniture demand across multiple industries.
Restraints Impact Analysis
| Restraint | (~) % Impact on CAGR Forecast | Geographic Relevance | Impact Timeline | |||
|---|---|---|---|---|---|---|
Inflation-squeezed discretionary budgets
Inflation-squeezed discretionary budgets
| -1.2% | National, low-income focus | Short term (≤ 2 years) |
(~) % Impact on CAGR Forecast
:
-1.2%
|
Geographic Relevance
:
National, low-income focus
|
Impact Timeline
:
Short term (≤ 2 years)
|
Container-rate volatility on Asia-US
lanes
Container-rate volatility on Asia-US
lanes
| -0.8% | Import-dependent firms | Medium term (2-4 years) | |||
Rising landfill fees and disposal rules
Rising landfill fees and disposal rules
| -0.3% | CA & Northeast | Long term (≥ 4 years) | |||
Labor shortages in upholstery clusters
Labor shortages in upholstery clusters
| -0.4% | Legacy production hubs | Medium term (2-4 years) | |||
| Source: Mordor Intelligence | ||||||
Inflation-squeezed discretionary budgets
In March 2025, the furniture and bedding CPI declined by 1.79% year-over-year, reflecting retailers' increased reliance on promotions to clear inventory. Consumers are delaying purchases of larger items, such as dining-room suites, and instead focusing on re-covering existing furniture or acquiring smaller décor pieces. Credit-card APRs exceeding 20% have driven demand for installment payment options, though rising delinquency rates pose significant financing risks for merchants. Retailers are under pressure as rising input costs and price-sensitive consumers force them to prioritize volume over margins. This dynamic is constraining revenue growth across the U.S. furniture market. The combination of elevated financing risks and promotional pricing strategies underscores the challenges faced by brands in maintaining profitability. Overall, the market is navigating a complex environment shaped by shifting consumer behavior and economic pressures.
Container-rate volatility on Asia-US lanes
Red Sea diversions are extending transit times by up to three weeks, significantly impacting vessel capacity and driving all-in rate fluctuations by triple-digit percentages within months. Freight costs, at times exceeding 15% of the price landed for low-density items, are disrupting merchandising schedules. Importers are attempting to offset these costs through surcharges; however, market elasticity limits the extent of cost pass-through. Nearshoring initiatives to Mexico and Central America are gaining momentum, but capacity constraints remain a challenge. Consequently, freight risks continue to exert downward pressure on the U.S. furniture market. These dynamics underscore the persistent volatility in supply chains, emphasizing the need for strategic planning. The ongoing capacity scarcity further complicates efforts to stabilize costs and transit times.
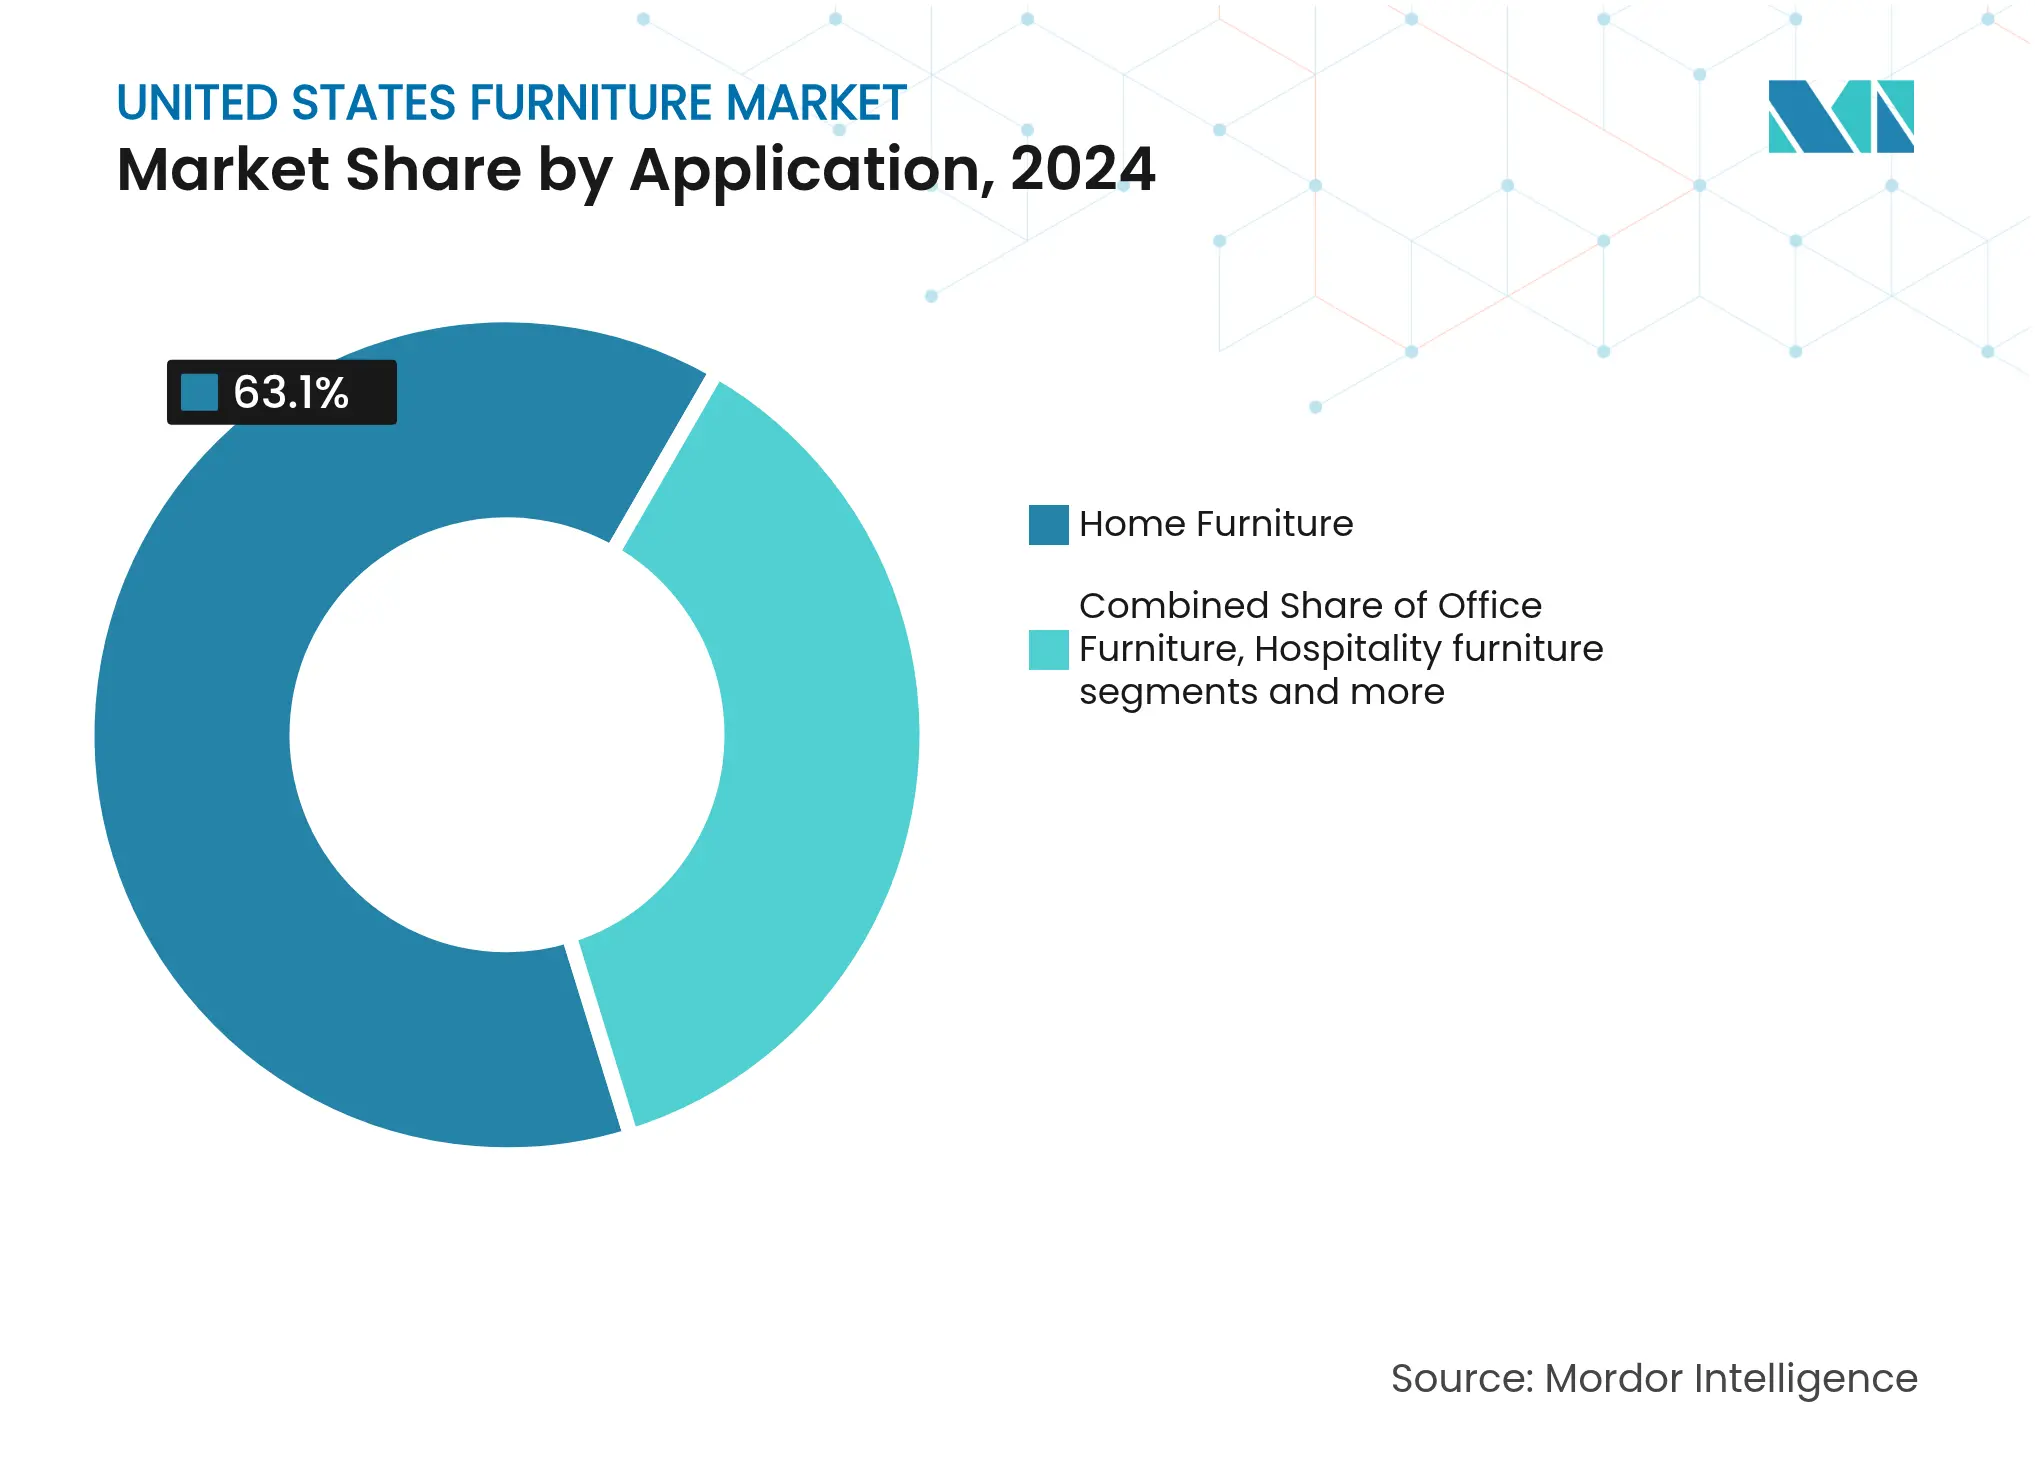
By Application: Residential Scale Anchors Growth
Home Furniture contributes 63.1% of the United States furniture market size, reflecting deep SKU breadth and recurring replacement tied to housing mobility. Hospitality, though only mid-single-digit share, outpaces others with a 4.54% CAGR thanks to post-renovation hotel budgets targeting work-friendly lobby layouts. Office collections regain relevance in tandem with hybrid schedules, while educational and healthcare furniture ride capex cycles, favoring flexible spaces. United States furniture market stakeholders diversify SKU planning to serve each niche without cannibalizing core residential assortments. The mixed material within Home Furniture skews toward wood for aesthetic warmth, whereas contract-grade segments gravitate to high-pressure laminates for durability.
In the United States furniture market, secondary demand is driven by build-to-rent managers who order standardized sets to streamline turnover processes. Hospitality buyers contribute to this demand by negotiating fleet purchases, which result in volume discounts but extend receivable cycles. Across various categories, the adoption of digital visualization tools is accelerating design approvals and reducing the length of sales funnels. These tools are also enhancing customer retention by improving the overall purchasing experience. The combination of these factors is shaping the operational and sales strategies within the market.
Note: Segment shares of all individual segments available upon report purchase
By Material: Tradition Blends with Innovation
Wood commands 56.23% of the United States furniture market share, favored for perceived quality and repairability. Yet plastic and polymer pieces are climbing at 4.70% CAGR, leveraging lightweight frames and easily recycled resin blends. Metal frames dominate outdoor settings and industrial loft décor, while engineered composites unlock strength-to-weight advantages in shelving. Sustainable sourcing stories resonate with bioplastic-wood hybrids, enabling carbon-negative claims that appeal to green-tier shoppers. FSC labels, however, impose supply-chain audits that lift costs by up to 7%, squeezing price-sensitive SKUs.
Suppliers in the U.S. furniture market are increasingly adopting low-VOC adhesives and water-based lacquers to comply with stricter indoor-air regulations. These regulatory changes are driving material advancements, which, in turn, are influencing product innovation pipelines. By integrating these environmentally friendly materials, companies aim to align with sustainability trends and enhance consumer trust. Such measures are critical for safeguarding brand reputations in a competitive market landscape. The focus on low-emission materials also reflects the industry's commitment to meeting evolving consumer preferences and regulatory standards.
By Price Range: Mid-Tier Volume, Premium Momentum
Mid-range lines held 43.14% of the United States furniture market size in 2024, giving mainstream retailers scale economies. Nevertheless, premium offerings log a 4.31% CAGR as consumers swap “fast furniture” for heirloom-intended pieces. Economy brands wrestle with freight and labor inflation that erodes already thin margins, prompting SKU rationalization. Premium shoppers favor customization, driving order-to-delivery windows of 6-8 weeks that tolerate unique designs. Lease-to-own programs surface even in upper tiers, spreading payments without diluting brand cachet.
In the U.S. furniture market, price stratification is increasingly aligning with channel preferences. Mass merchants are focusing on offering entry-level packs through online platforms, while boutique studios are emphasizing experiential showrooms to attract customers. This strategic approach caters to diverse consumer preferences, ensuring volume stability across channels. Additionally, it creates opportunities for margin expansion by targeting different market segments effectively. The combination of these strategies supports sustainable growth within the market.

Recognized by Experts. Trusted by Leaders.
A trusted intelligence partner to global decision-makers across 90+ countries.


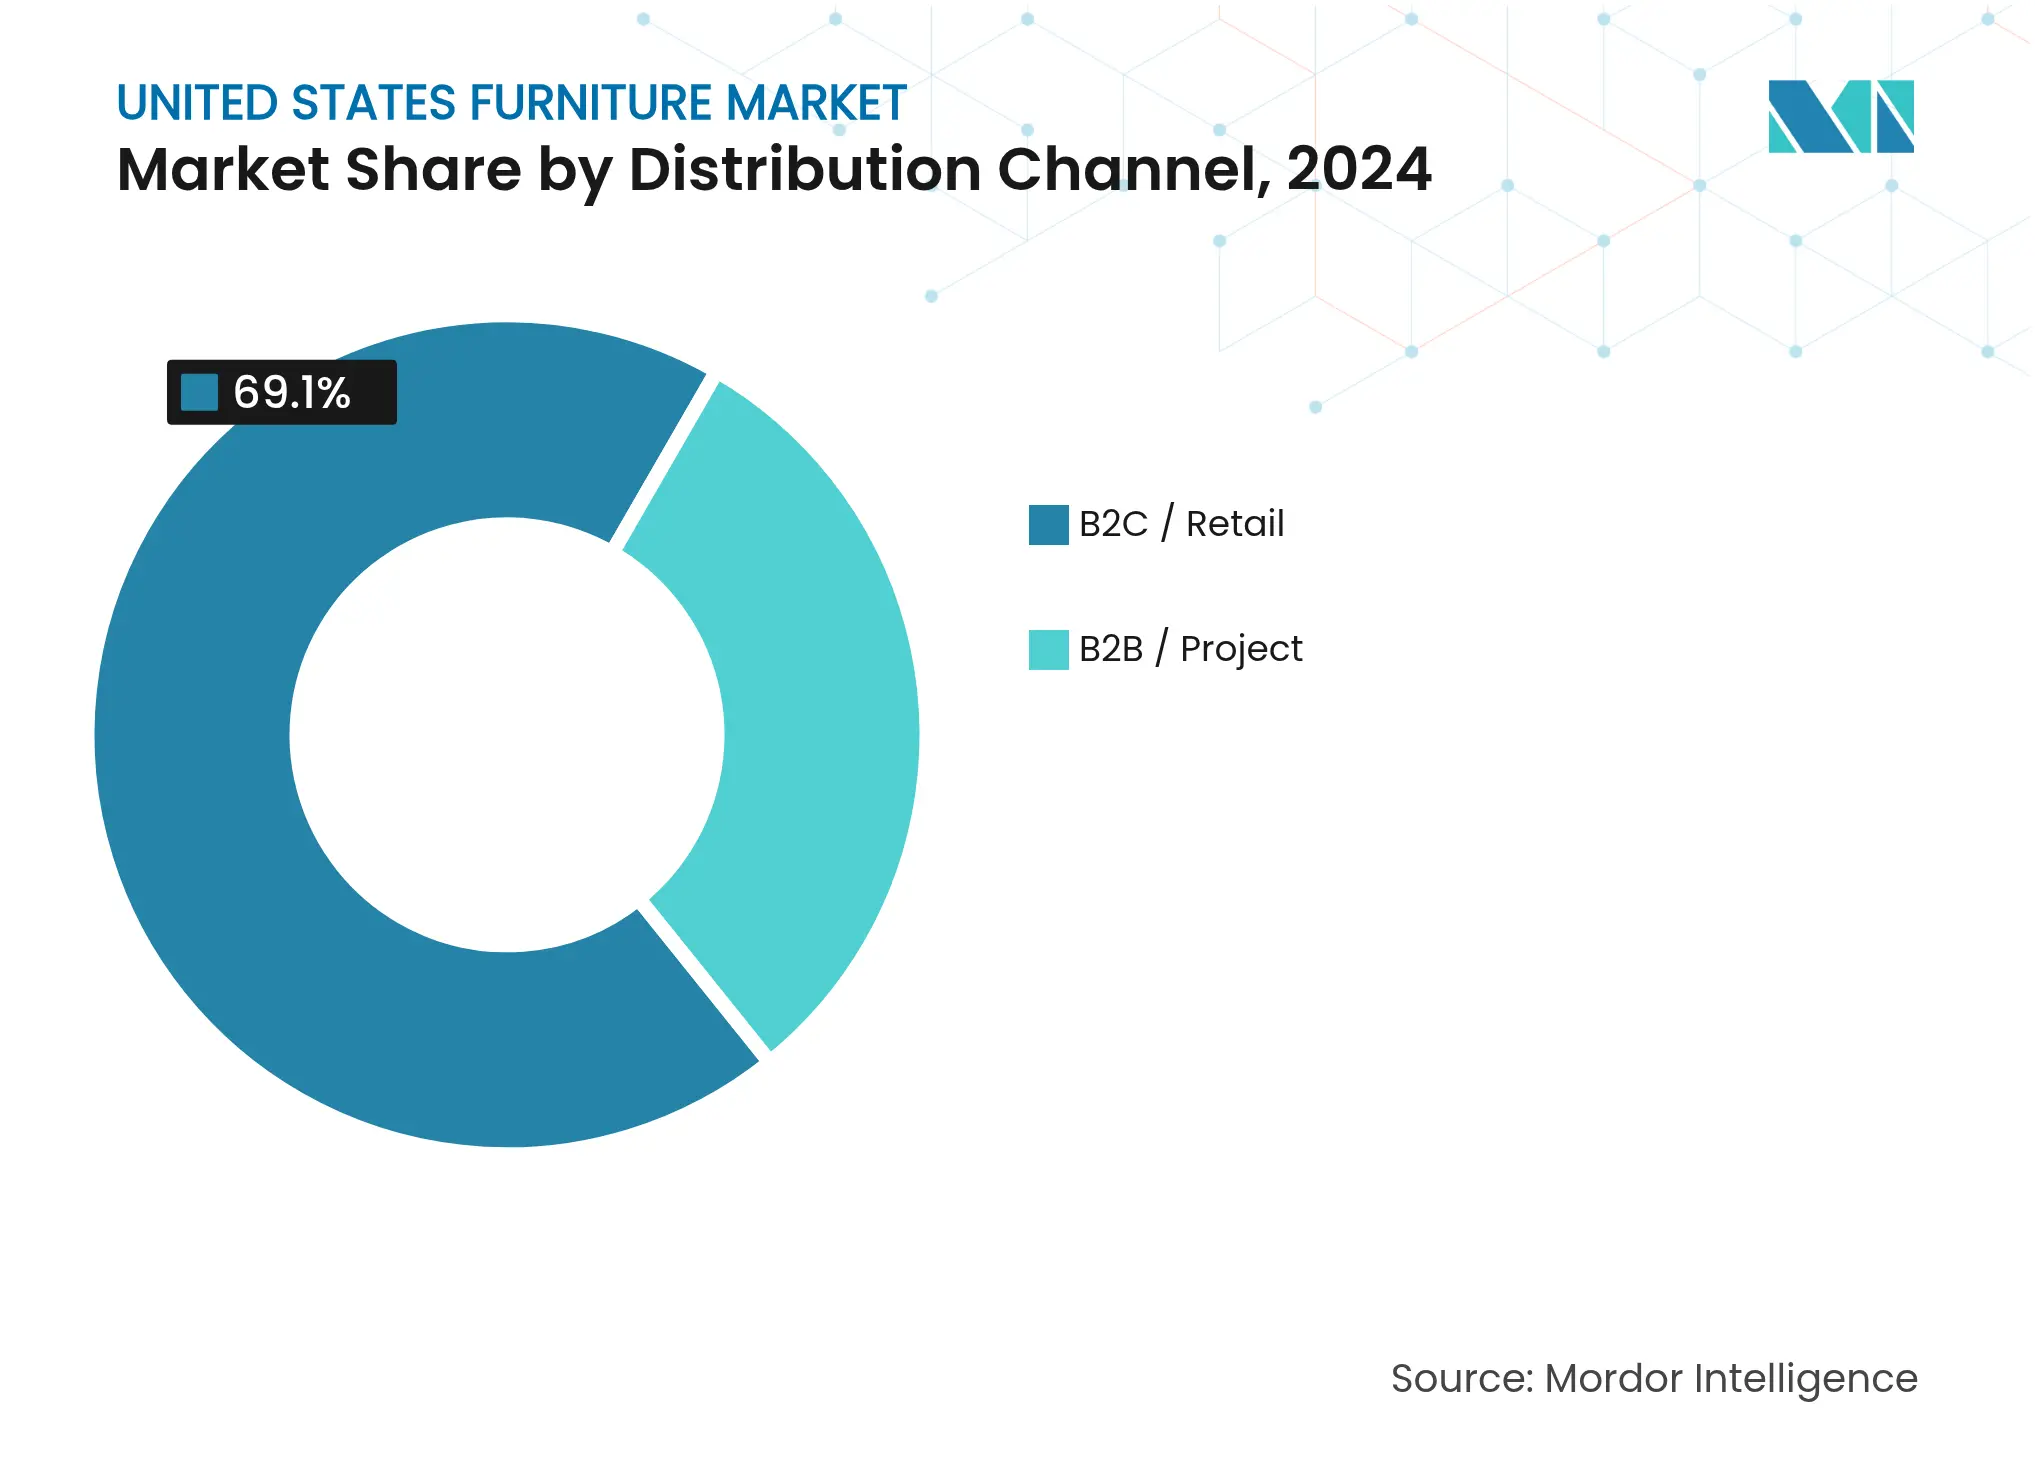
By Distribution Channel: Retail Dominance with Digital Tailwinds
B2C retail occupies 69.1% of United States furniture market size and is pacing at a 4.10% CAGR to 2030. Home-center big boxes capture DIY renovators, specialty chains offer design consultations, and pure-play e-tailers compete on assortment depth. Click-and-collect gains as customers test finishes in-store, then transact online for convenient scheduling. B2B project sales trail in share but deliver higher ticket averages through contracted installs in offices, hotels, and institutional facilities.
Market leaders in the U.S. furniture market are integrating AR applications to overlay dimensionally accurate models in customer spaces, significantly reducing return rates. These applications enhance customer experience by providing precise visualizations of furniture placement. On the operational side, API-linked inventory systems synchronize showrooms with distribution centers, minimizing stock-out risks and improving supply chain efficiency. These advancements contribute to cost optimization, which is reflected in competitive pricing strategies. As a result, these measures strengthen the market's channel performance and overall competitiveness.
Note: Segment shares of all individual segments available upon report purchase
The Southeast controls 29.21% of the United States furniture market size, buoyed by inbound migration and larger average home footprints that lift per-household spend. Port access at Savannah and Charleston streamlines import flows, though rail bottlenecks sometimes delay inland deliveries. Traditional tastes skew toward wood finishes, supporting North Carolina’s manufacturing base that anchors regional supply. Build-to-rent projects from Atlanta to Tampa standardize furniture packages, creating predictable volumes for mid-market suppliers.
Western states chart a 4.28% CAGR through 2030, propelled by tech-sector wages and a culture of outdoor living that spurs demand for patio sets and modular smart storage. California’s stringent emissions rules push adoption of formaldehyde-free boards, nudging material innovation marketwide. Capacity constraints at LA–Long Beach ports divert some inbound traffic to Pacific Northwest gateways, lengthening domestic trucking legs but easing berthing delays. Premium-positioned direct-to-consumer brands flourish in metro areas like San Francisco and Seattle, where design-service uptake is high.
The Northeast, Midwest, and Southwest fill the balance. The Northeast registers steady remodel activity tied to aging housing stock, offsetting slower new-build pace. Midwestern plants compete for labor, prompting automation grants to keep upholstery production onshore. The Southwest gains from retirees furnishing second homes, emphasizing lightweight and easy-care pieces suited to desert climates. Specialized last-mile carriers scale depots near Dallas and Phoenix to meet two-person lift requirements, ensuring broad geographic service inside the United States furniture market.
Market Concentration
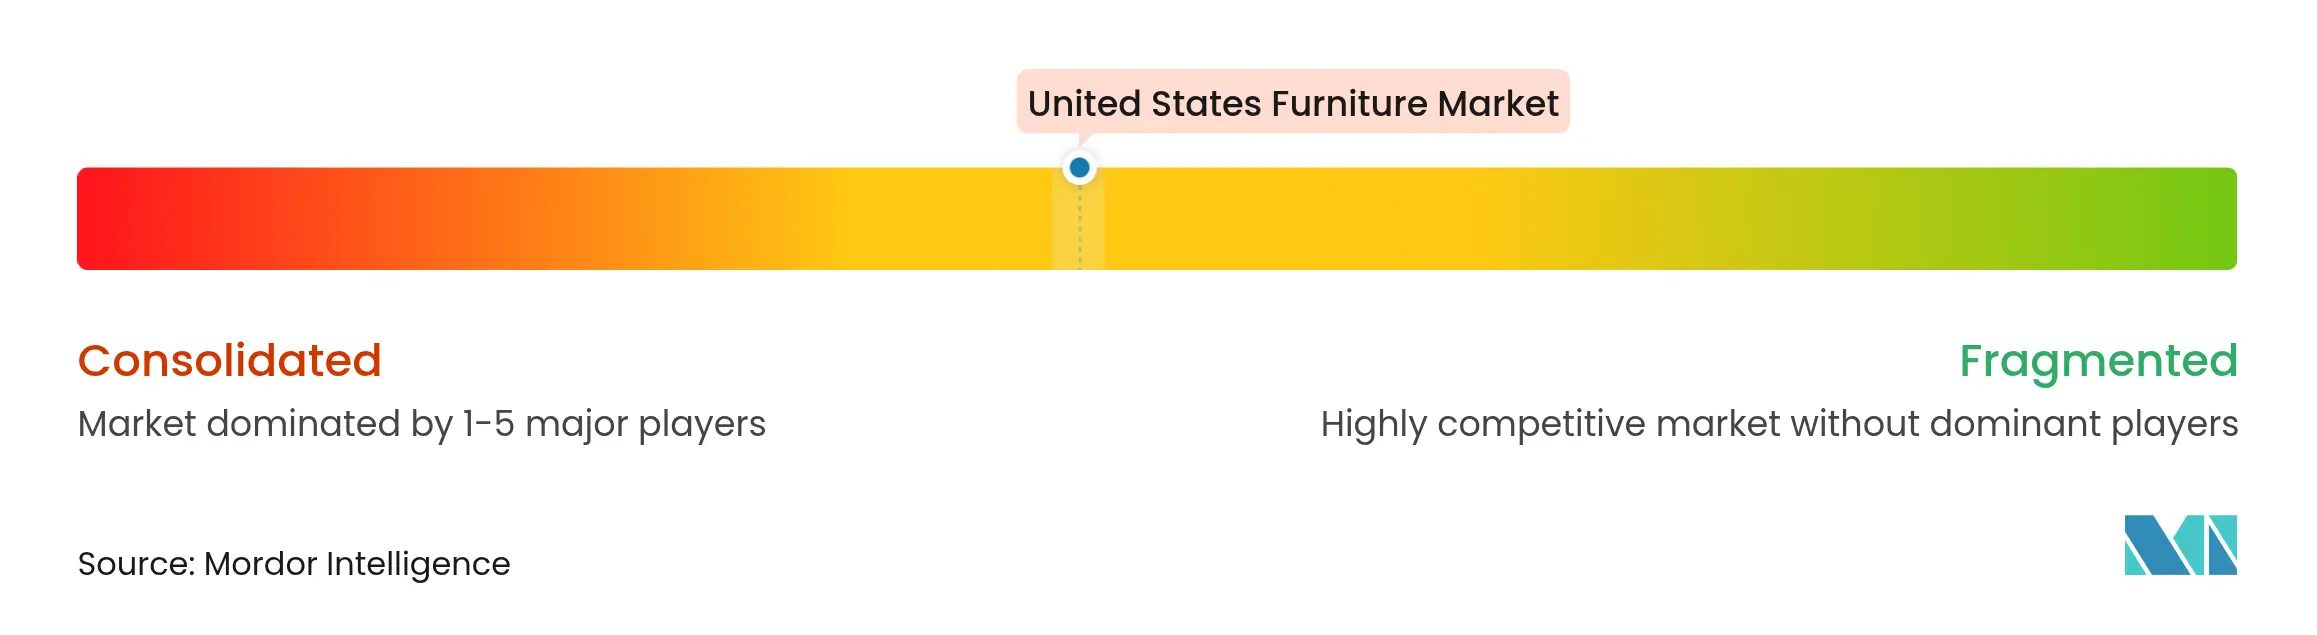
The United States furniture market is marked by fragmentation, offering ample space for innovative and challenger brands to strengthen their presence. Williams-Sonoma leverages a house-of-brands model—Pottery Barn, West Elm, and Rejuvenation—to serve multiple price points, while its April 2025 AERIN expansion deepens lifestyle appeal[4]Stock Titan, “Williams-Sonoma Expands AERIN Partnership,” stocktitan.net. IKEA counters by injecting EUR 2.1 billion into global price cuts to defend volume amid softer fiscal 2024 sales.
Technology underpins competitive gaps. AI-driven design engines shorten development cycles, freeing capital for marketing. Wayfair’s proprietary logistics network mitigates bulky-goods pain points, whereas La-Z-Boy’s 96% waste-recycling rate enhances ESG credentials. Office-as-a-subscription models from NORNORM trial flexible leasing at EUR 3 per square meter monthly, appealing to companies wary of CapEx commitments.
Domestic producers such as Bassett and Vaughan-Bassett tout Made-in-USA narratives that resonate amid freight turmoil. Concurrently, peer-to-peer resale pilots like IKEA Preowned test circular economies that may cannibalize new sales yet extend brand ecosystems. Against this backdrop, omnichannel fluency, supply-chain resilience, and sustainable innovation jointly decide winners in the United States furniture market.

*Disclaimer: Major Players sorted in no particular order
1. Introduction
2. Research Methodology
3. Executive Summary
4. Market Landscape
5. Market Size and Growth Forecasts (Value in USD)
6. Competitive Landscape
7. Market Opportunities and Future Outlook
A complete background analysis of the United States Furniture Market, which includes an assessment of the National accounts, economy, and the emerging market trends by segments, significant changes in the market dynamics, and the market overview is covered in the report. United States Furniture Market is segmented by Material (Wood, Metal, Plastic and Other Materials), by Application (Home Furniture, Office Furniture, Hospitality Furniture, and Other Furniture) and by Distribution Channel (Supermarkets, Specialty Stores, Online, and Other Distribution Channels).
A Leading Sanitaryware Company’s Journey in Saudi Arabia
4 Min Read
Strategic Expansion in the Russia Laundry Appliances Market
3 Min Read
When decisions matter, industry leaders turn to our analysts. Let’s talk.