Market Overview
| Study Period | 2020 - 2031 |
|---|---|
| Forecast Data Period | 2026 - 2031 |
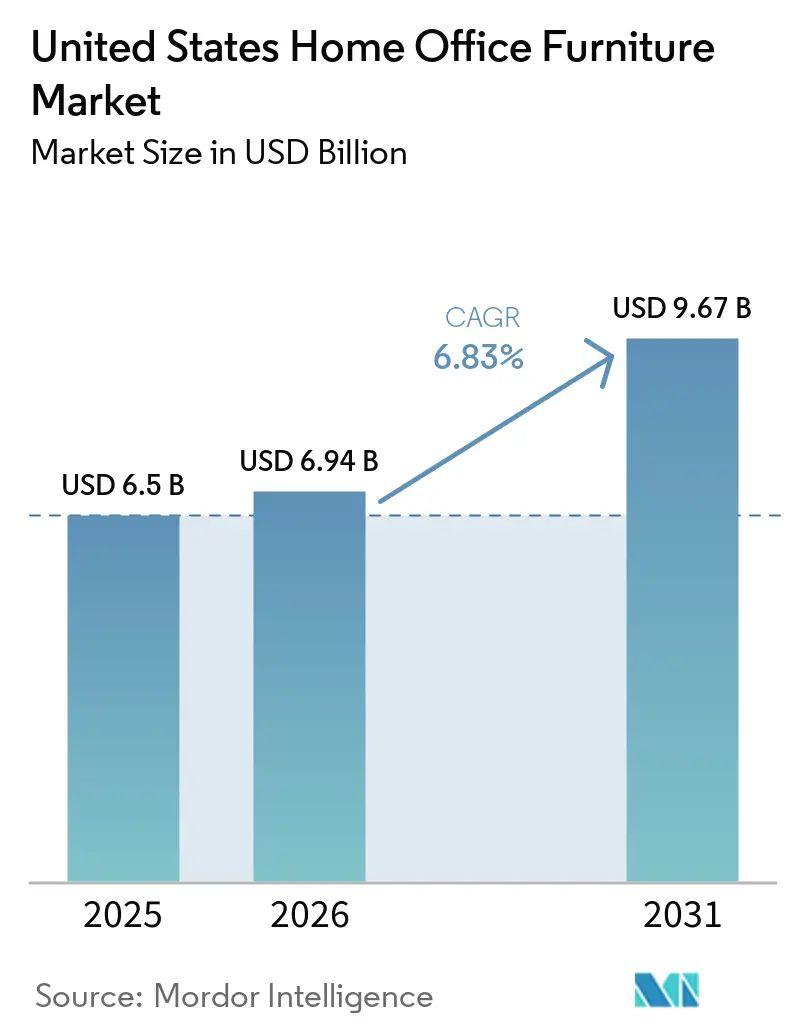
| Base Year Market Size (2025) | USD 6.5 Billion |
| Market Size (2026) | USD 6.94 Billion |
| Market Size (2031) | USD 9.67 Billion |
| Growth Rate (2026 - 2031) | 6.83% CAGR |
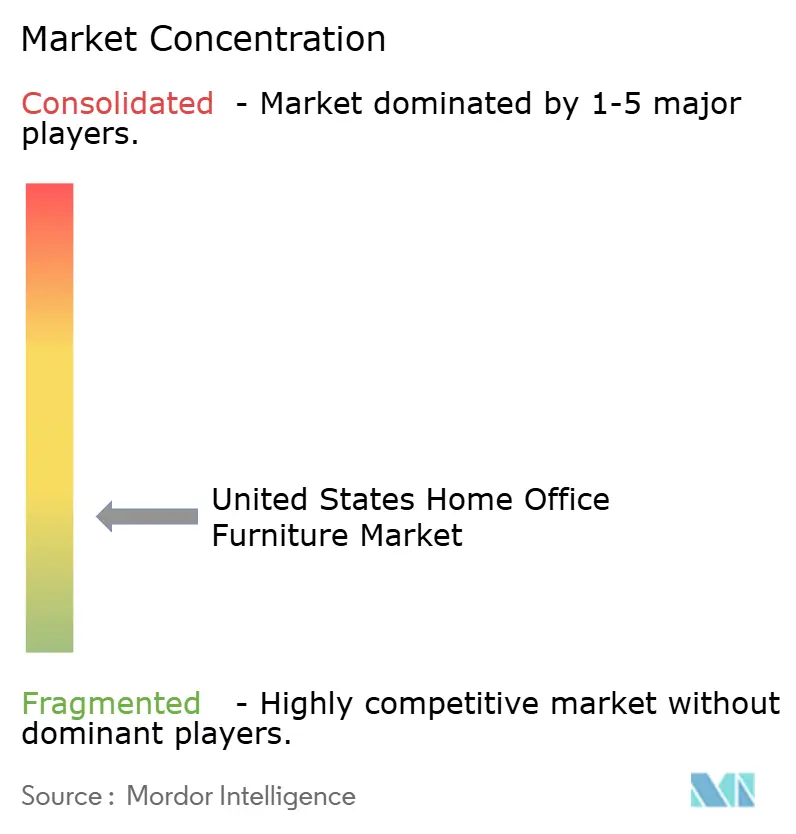
| Market Concentration | Low |
Major Players *Disclaimer: Major Players sorted in no particular order Image © Mordor Intelligence. Reuse requires attribution under CC BY 4.0. | |
United States Home Office Furniture Market Analysis by Mordor Intelligence
The United States home office furniture market size in 2026 is estimated at USD 6.94 billion, growing from 2025 value of USD 6.5 billion with 2031 projections showing USD 9.67 billion, growing at 6.83% CAGR over 2026-2031. Demand is being kept aloft by entrenched hybrid-work schedules and employer equipment stipends, both of which encourage consumers to replace improvised setups with purpose-built desks and chairs. Height-adjustable furniture and other wellness-focused designs are capturing most of the incremental spending, while digital showrooms and reliable home-delivery services allow online specialists to chip away at the long-standing dominance of big-box home centers. California’s low-VOC regulations, coupled with elevated lumber costs, are nudging manufacturers toward recycled polymers and low-emission finishes, reshaping material sourcing strategies and product marketing alike.
Key Report Takeaways
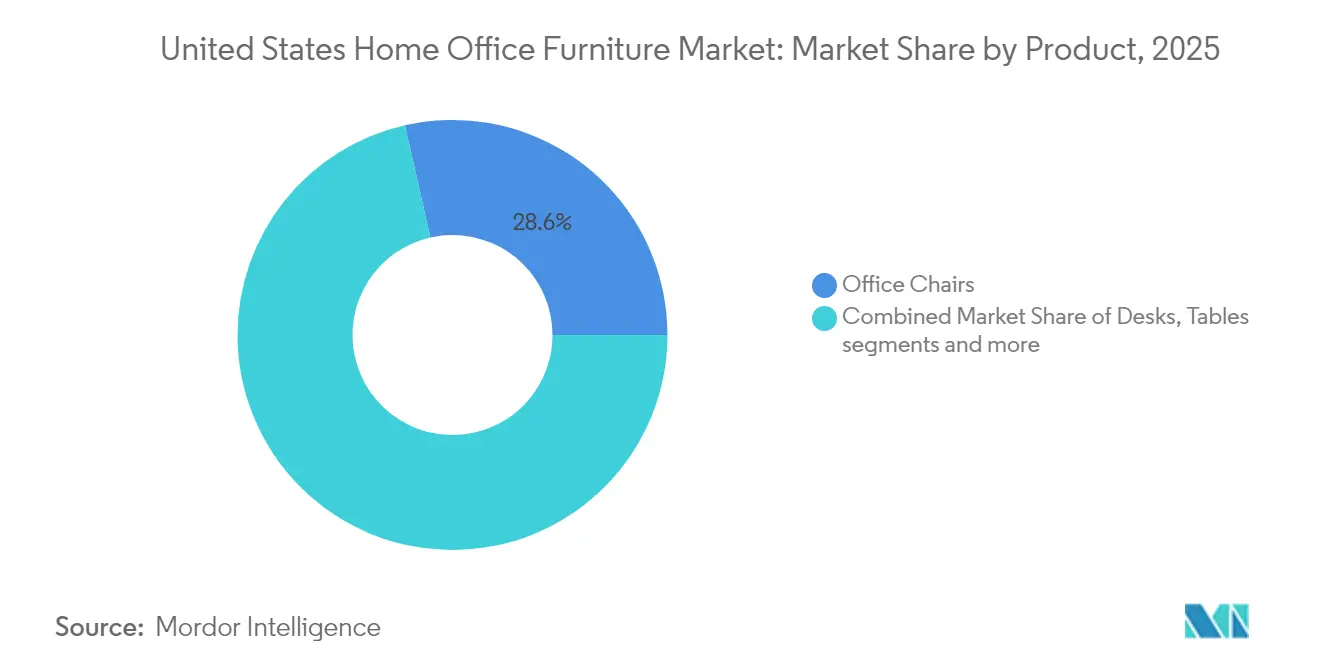
- By product category, office chairs led the market with a 28.55% revenue share in 2025, while height-adjustable desks are forecast to expand at a 7.78% CAGR through 2031.
- By material, wood accounted for 41.35% of the market size in 2025; plastic and polymer alternatives are projected to grow at a 7.01% CAGR over the same period.
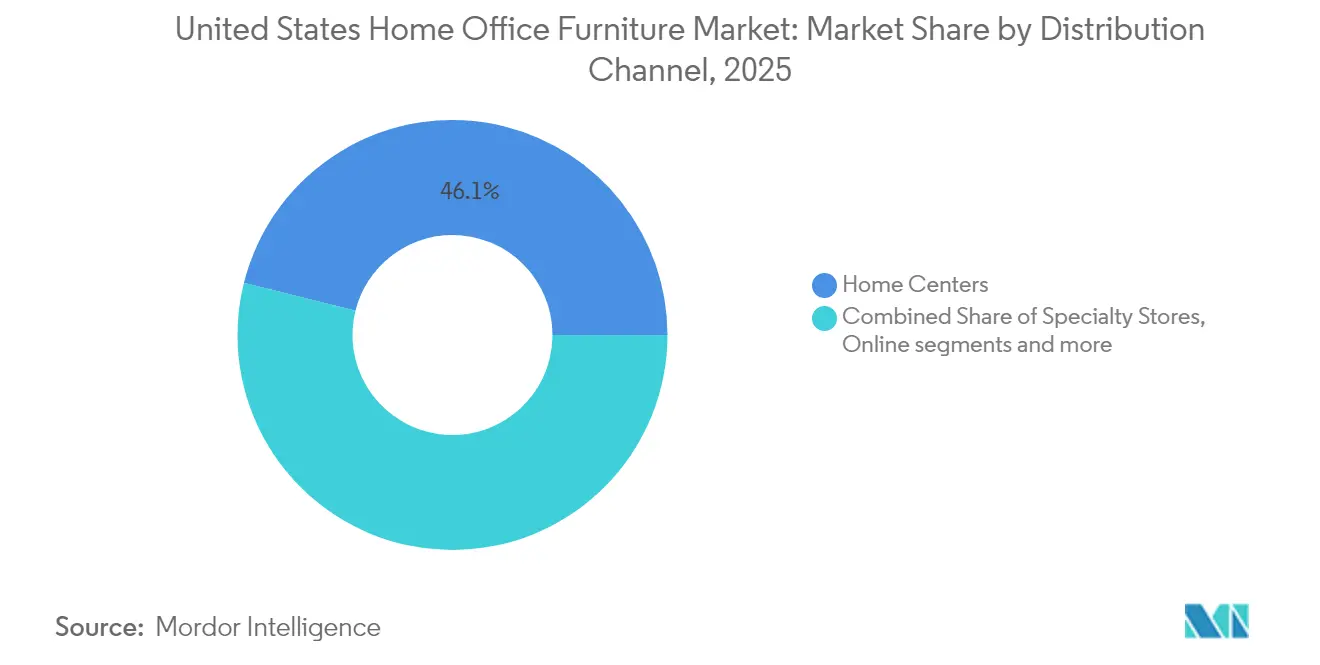
- By distribution channel, home centers held 46.10% of the United States home office furniture market share in 2025, whereas the online channel is advancing at a 8.92% CAGR to 2031.
- By price range, the mid-range segment captured 51.25% share in 2025, but the premium tier is set to rise at an 7.74% CAGR through 2031.
- By geography, the Northeast commanded 32.55% of 2025 revenue, while the west is expected to record the fastest growth at a 8.08% CAGR to 2031.
Note: Market size and forecast figures in this report are generated using Mordor Intelligence’s proprietary estimation framework, updated with the latest available data and insights as of 2026.
United States Home Office Furniture Market Trends and Insights
Drivers Impact Analysis*
| Driver | (~) % Impact on CAGR Forecast | Geographic Relevance | Impact Timeline |
|---|---|---|---|
| Adoption of Remote and Hybrid Work Models | +1.8% | Nationwide technology hubs | Medium term (3–4 yrs) |
| Increased Emphasis on Health and Ergonomics | +1.2% | Urban early adopters | Long term (≥ 5 yrs) |
| Product Innovations for Space Optimization | +0.8% | High-cost metros | Medium term (3–4 yrs) |
| Expansion of E-Commerce Channels | +0.7% | Nationwide digital natives | Medium term (3–4 yrs) |
| Driver – Low-VOC Standards in California | +0.3% | Initial California, national spillover | Long term (≥ 5 yrs) |
| Source: Mordor Intelligence | |||
Adoption of Remote and Hybrid Work Models Accelerates Furniture Purchases
Hybrid attendance policies have become standard across professional services and finance, leaving workplace occupancy well below pre-2020 norms and reshaping demand for office furniture. This permanence has produced a second investment wave in dedicated home workstations as households replace makeshift solutions with furniture tailored to long-term use. As a result, products with residential aesthetics—soft woods, muted palettes, and fabric upholstery—are selling alongside overtly task-oriented items, merging office utility with living-space style. An emerging benefit for retailers is that business-hour demand is smoothing out traditional weekend sales peaks because remote workers browse and buy throughout the workweek
Increased Emphasis on Health and Ergonomics
Rising healthcare premiums and longer screen hours have transformed ergonomics from an optional feature to a primary purchase criterion. Height-adjustable desks, already the fastest-growing product segment at 8.1% CAGR, now ship with digital height presets and activity prompts that position them as wellness devices. Certification marks lend credibility, and employers frequently require such labels before reimbursing purchases, giving certified brands a clear sales edge. A secondary effect is that marketing content focusing on posture education converts shoppers at higher rates, implying that knowledge transfer is now part of the selling proposition.
Expansion of E-Commerce Channels
Digital penetration in the United States home office furniture market share now rivals home-center dominance, propelled by improved 3-D visualization tools and doorstep delivery capabilities. Hybrid shopping journeys—research online, validate dimensions in store, complete purchase via mobile—have become mainstream, putting pressure on retailers to synchronize pricing and inventory across channels. Firms that integrate augmented-reality apps observe lower return rates, reducing reverse-logistics expenses and strengthening profitability. Additionally, small-format “experience studios” embedded in urban malls are emerging as cost-effective showrooms that bolster digital trust without the overhead of big-box real estate.
Low-VOC Standards in California Prompting Premium Sustainable SKUs
The California Air Resources Board’s strict volatile organic compound limits for adhesives and coatings push manufacturers to reformulate materials, effectively elevating the state’s rules to national baseline standards [1]California Air Resources Board, “Consumer Products Regulation for Volatile Organic Compounds,” California Air Resources Board, arb.ca.gov. Instead of treating compliance as a burden, brands highlight low-emission chemistry as a health benefit, commanding price premiums from consumers with respiratory health concerns. Because certification paperwork doubles as marketing collateral, transparent disclosure builds loyalty and encourages word-of-mouth referrals among eco-conscious buyers. An unexpected upside is that supply-chain partnerships with bio-based resin producers are accelerating, injecting new expertise into legacy wood-working networks.
Restraints Impact Analysis*
| Driver | (~) % Impact on CAGR Forecast | Geographic Relevance | Impact Timeline |
|---|---|---|---|
| Housing-Market Slowdown | -1.1% | High-cost housing markets | Short term (≤ 2 yrs) |
| Elevated Lumber & Steel Costs | -0.7% | Wood-dominant producers | Short term (≤ 2 yrs) |
| Low-Cost Asian Imports | -0.6% | Entry-level nationwide | Medium term (3–4 yrs) |
| Second-Hand & Furniture-Rental Platforms | -0.4% | Millennial urban cores | Long term (≥ 5 yrs) |
| Source: Mordor Intelligence | |||
Housing-Market Slowdown Curtailing Home-Office Upgrades
Elevated mortgage costs have cooled home-sales volumes, postponing the furniture purchases typically linked to moves. Sales data from major mid-tier chains confirm softer order flows tied to new-home completions, even as refurbishment-driven transactions hold steady. The pattern suggests that premium brands insulating their pipeline with upgrade-oriented marketing face less volatility than volume-driven value players that rely on household formations. Manufacturers targeting the middle price band are therefore pivoting to installment-financing options that spread payments over longer terms, cushioning the impact of a sluggish housing cycle.
Elevated Lumber & Steel Costs Compressing Manufacturer Margins
Input-cost volatility continues, with lumber and flat-rolled steel prices still tracking above pre-pandemic benchmarks despite moderate easing. In response, design teams are substituting recycled polymers for non-load-bearing wooden components, simultaneously reducing bill-of-materials expenses and advertising sustainability gains. This substitution strategy diversifies supplier bases and mitigates geopolitical risk tied to raw-wood tariffs, indicating that material agility is now a core competency. Furthermore, brands that publicly share life-cycle-assessment data strengthen negotiating leverage with enterprise buyers whose procurement policies prioritize environmental metrics.
*Our forecasts treat driver/restraint impacts as directional, not additive. The impact forecasts reflect baseline growth, mix effects, and variable interactions.
Segment Analysis
By Product: Ergonomic Designs Reshape Consumer Preferences
The office-chair category commands 28.55% of the United States home office furniture market share in 2025, a leadership position underpinned by higher replacement frequency and direct links to user comfort. Even as volumes stabilize, seating suppliers that refresh fabric lines and integrate posture sensors find that households willingly upgrade within three-year intervals. Height-adjustable desks, representing the fastest-growing product slot at 7.78% CAGR, infiltrate mid-range portfolios along with programmable height memory, thereby normalizing technology once reserved for executive suites. This acceleration implies that value-tier producers risk obsolescence if they fail to migrate toward even basic sit-stand functionality over the next planning cycle.
A second wave of growth stems from accessories and “other products,” such as monitor arms and portable privacy screens, which round out ergonomic ecosystems. Storage cabinets and shelving demonstrate slower but stable demand; still, their bundling with desk sets elevates average sale values and encourages aesthetic uniformity across entire rooms. Auxiliary tables for printers and peripherals remain niche, yet they capture incremental revenue in households dedicating separate zones for scanning and 3-D printing. Overall, integrated power management and wireless-charging hubs embedded in desks and chairs provide tangible proof that digital technology is now inseparable from physical furniture.


Material: Wood Dominance Challenged by Sustainable Alternatives
Wood maintains a 41.35% share of the United States home office furniture market size because natural grain and perceived durability resonate with domestic consumers. Continuing price inflation for hardwood species has not dampened enthusiasm; instead, buyers equate premium veneer with long-term asset value. Plastic and polymer alternatives, advancing at a 7.01% CAGR, transition from entry-level replacements to credible eco-friendly options thanks to recycled content and bio-resin innovations. Life-cycle assessments published in peer-reviewed journals show that upstream manufacturing stages generate most environmental impact, prompting designers to favor lower-emission polymers where structural strength is non-critical.
Metal frameworks, especially powder-coated steel and anodized aluminum, enjoy persistent demand for structural elements, while their recyclability records offer powerful marketing narratives. Niche materials—including bamboo laminates and mushroom-based composites—capture attention in design media even if current volumes are small, hinting at potential step-change adoption should cost curves fall. Across all substrates, the convergence of sustainability scoring and cost-containment goals drives experimentation, suggesting that hybrid constructions combining wood aesthetics with recycled-plastic cores may soon emerge as mainstream.
Price Range: Mid-Range Dominance Amid Premium Growth
Mid-range SKUs hold 51.25% market share in 2025, balancing affordability with recognizable brand quality. Warranty extensions and modular add-ons allow these products to compete on total cost-of-ownership rather than headline price, a shift that mitigates margin erosion in a price-sensitive segment. Premium offerings, expanding at 7.74% CAGR, benefit from the wellness narrative, with customers judging ergonomic furniture as a hedge against healthcare expenses. The introduction of official refurbishment programs—exemplified by Humanscale’s branded store—signals that circular business models can create a secondary revenue stream without cannibalizing new-product rollouts .
At the opposite end, economy-tier units wrestle with compressed margins because consumers compare global imports within seconds online. Some vertically integrated retailers respond by eliminating third-party logistics fees, thereby maintaining competitive shelf pricing. An observable consumer shift toward value-based decisions that weigh build quality against upfront savings suggests that mid-range suppliers highlighting durability metrics can siphon customers away from disposable alternatives.
Distribution Channel: Digital Transformation Reshapes Retail Landscape
Home centers still command 46.10% of the United States home office furniture market share thanks to national footprints and same-day pickup, a convenience that resonates when buyers confront sudden ergonomic discomfort. Yet the online channel, pacing ahead at 8.92% CAGR, is closing the gap as augmented-reality staging and flexible return policies tackle legacy trust barriers. Specialty stores differentiate through trained staff who offer posture assessments, converting high-touch consultations into premium ticket sizes.
Government and institutional procurement—channeled through portals such as GSA Global Supply—represents a smaller but stable slice where compliance credentials trump design flourishes . Direct-to-consumer brands leverage data analytics to personalize marketing, using real-time browsing behavior to suggest compatible chair-desk bundles, which lifts basket size while cutting acquisition costs. The interplay between logistics reliability and front-end visualization determines channel momentum, implying that last-mile execution is a competitive battleground equal in importance to showroom aesthetics.
Geography Analysis
The Northeast accounts for 32.55% of the United States home office furniture market size in 2025, an outsized share driven by dense professional-services employment and high household incomes. Because urban apartments typically lack spare rooms, multifunctional and compact furniture commands premium pricing, enabling suppliers to offset lower square-foot sales volumes with higher margins per unit. Although some interior-design talent migrates toward sunnier markets, the region’s mature retail infrastructure keeps product launches visible and fuels steady replacement cycles. A notable characteristic is that Northeastern consumers value design pedigree, so European minimalist lines often debut here before rolling out nationwide.
West market is forecast to grow at 8.08% CAGR through 2031. Larger homes support dedicated office rooms, raising demand for full suites that include storage credenzas and visitor seating. Builders increasingly pre-wire new construction for under-desk power and data, implicitly upselling residents on tech-integrated furniture solutions. The result is that suppliers who tailor product bundles to these pre-designed spaces capture first-mover advantage.
The Southeast shows steady, moderate growth patterns, each reflecting distinct cultural preferences. California, because of stringent VOC rules, sets material specifications that ripple nationally, meaning innovations piloted there often scale quickly in other states. Overall, regional diversity in housing sizes, environmental regulations, and labor markets ensures that nationwide brands must maintain flexible product strategies instead of relying on one-size-fits-all portfolios.
Competitive Landscape
The five leading players—MillerKnoll, Steelcase, Haworth, HNI Corporation, and IKEA —hold a significant but not dominant portion of the United States home office furniture market share, leaving ample room for nimble specialists. Each leverages unique heritages: contract-grade engineering, mass-market distribution, or residential design flair. Consolidation activity, such as MillerKnoll’s earlier acquisition of Knoll, reveals that scale efficiencies and complementary aesthetics drive merger logic as companies seek to serve multiple price tiers.
Emergent white-space niches revolve around smart-furniture capabilities, recycled-material innovations, and modular desks suited to evolving room layouts. Direct-to-consumer entrants exploit social-media reach and third-party logistics to compress product-development cycles, launching iterative improvements based on user feedback. Incumbents counter with in-house innovation labs and partnerships with sensor manufacturers to incorporate utilization tracking and posture analytics. Intellectual-property portfolios focusing on adjustment mechanisms and IoT integrations are, therefore, becoming strategic assets.
Service differentiation is another battlefield: in-home assembly teams, buy-back guarantees, and subscription refresh plans extend brand interaction beyond the point of sale. Such models generate recurring revenue and deepen customer loyalty, making them particularly valuable during economic slowdowns when new-unit sales soften. Overall, competition now blends product engineering, digital customer experience, and life-cycle services, redefining what constitutes market leadership in the United States home office furniture industry.
United States Home Office Furniture Industry Leaders
Steelcase Inc.
Haworth Inc.
HNI Corporation
MillerKnoll, Inc.
IKEA
- *Disclaimer: Major Players sorted in no particular order

Recent Industry Developments
- April 2025: Steelcase reported USD 3.166 billion fiscal-year revenue, citing Americas growth that offset overseas softness.
- March 2025: Hooker Furnishings confirmed its exit from the Savannah, Georgia distribution center, forecasting annual savings of USD 4.0–4.5 million beginning FY 2027
- February 2025: Haworth achieved a record USD 2.5 billion revenue following successful new-product launches.
- August 2024: Humanscale opened a branded online store for refurbished furniture, broadening access to premium ergonomics.


Research Methodology Framework and Report Scope
Market Definitions and Key Coverage
Our study defines the United States home-office furniture market as all desks, seating, storage, and ancillary accessories that are designed, marketed, and sold for use in permanent or hybrid residential workspaces, whether purchased by individuals or reimbursed by employers. According to Mordor Intelligence, value is captured at manufacturer selling price and includes goods delivered through in-store, e-commerce, contract, and direct-to-consumer channels.
Scope Exclusion: Commercial office fit-outs, contract furniture placed exclusively in coworking hubs, and second-hand sales are outside this scope.
Segmentation Overview
- By Product
- Office Chairs
- Desks
- Height Adjustable Desks
- Fixed Desks
- Tables (side tables, printer tables, etc.)
- Storage Cabinets & Shelving
- Other Products (stools, bookcase, desk accessories, etc.)
- By Material
- Wood
- Metal
- Plastic & Polymer
- Other Materials
- By Price Range
- Economy
- Mid-Range
- Premium
- By Distribution Channel
- Home Centers
- Specialty Stores (including exclusive brand outlets)
- Online
- Other Distribution Channels
- By Geography
- Northeast
- Southeast
- Midwest
- Southwest
- West
Detailed Research Methodology and Data Validation
Primary Research
We complemented secondary findings through phone interviews and short surveys with furniture distributors, logistics partners, online-only retailers, and occupational-health consultants across the Northeast, South, Midwest, and West. Insights on typical home-office order sizes, return rates, and feature preferences enabled us to adjust average selling prices and verify unit volumes.
Desk Research
Mordor analysts open every project with structured desk work that pulls recent trade data from the U.S. International Trade Commission, quarterly household expenditure tables from the Bureau of Labor Statistics, import shipment tallies on wood desks from Volza, new-housing starts from the U.S. Census Bureau, and ergonomics adoption guidelines issued by BIFMA. Company 10-Ks, investor decks, and industry white papers supply pricing movements and channel mix signals. Subscription assets such as D&B Hoovers and Dow Jones Factiva help validate revenue splits for leading suppliers. This list illustrates the caliber of public and paid references, yet it is not exhaustive.
Market-Sizing & Forecasting
A top-down build starts with nationwide household counts and remote-worker penetration, which are then multiplied by workstation replacement cycles and average spend per workstation. Results are cross-checked with sampled supplier roll-ups and channel checks to refine totals. Key variables modeled include BLS remote work share, single-family housing completions, average online basket value for desks, lumber price indices, and employer stipend prevalence. Multivariate regression paired with scenario analysis projects demand to 2030, while any volume gaps in bottom-up checks are bridged by proportional allocation from verified import values.
Data Validation & Update Cycle
Outputs pass two-step peer reviews, variance checks against historical time series, and anomaly flags triggered by quarter-on-quarter swings above five percent. Reports refresh annually, and analysts re-contact sources when material events, such as major mergers, occur before the next cycle.
Why Mordor's US Home Office Furniture Baseline Commands Reliability
Published market numbers often vary because firms pick dissimilar scope anchors, input variables, and refresh cadences.
Three gap drivers stand out: some publishers merge commercial and residential channels, others freeze average prices for multiple years, and a few update models only after census revisions. Mordor's study, by contrast, isolates purely residential demand, refreshes price ladders every six months, and applies interim updates when freight or lumber costs swing sharply.
Benchmark comparison
| Market Size | Anonymized source | Primary gap driver |
|---|---|---|
| USD 6.5 B (2025) | Mordor Intelligence | - |
| USD 6.5 B (2024) | Regional Consultancy A | shorter forecast horizon and static price escalation |
| USD 4.3 B (2024) | Industry Journal B | excludes online-only task chairs and employer-funded reimbursements |
The comparison shows that when scope and price dynamics are tightened, Mordor's 2025 baseline offers a balanced midpoint between optimistic and conservative views, giving decision-makers a value they can trace back to clear variables and repeatable steps.


Key Questions Answered in the Report
What is the current United States home office furniture market size?
The market is valued at USD 6.94 billion in 2026.
How fast is the United States home office furniture market expected to grow?
It is forecast to expand at a 6.83% CAGR, reaching USD 9.67 billion by 2031.
Which product segment is expanding most rapidly?
Height-adjustable desks lead growth, reflecting strong consumer focus on ergonomic wellness.
Why are online sales gaining share in the United States home office furniture industry?
Enhanced visualization tools, hybrid shopping behavior, and nationwide delivery networks are accelerating e-commerce adoption.
How are sustainability regulations influencing product development?
California’s low-VOC standards have become a de facto national baseline, prompting brands to reformulate materials and market low-emission advantages.
Which U.S. region shows the fastest growth in home office furniture demand?
The West records the highest forecast CAGR, buoyed by population in-migration and expanding technology employment.
Page last updated on:


