Urban Planning Software And Services Market Size and Share
Market Overview
| Study Period | 2019 - 2030 |
|---|---|
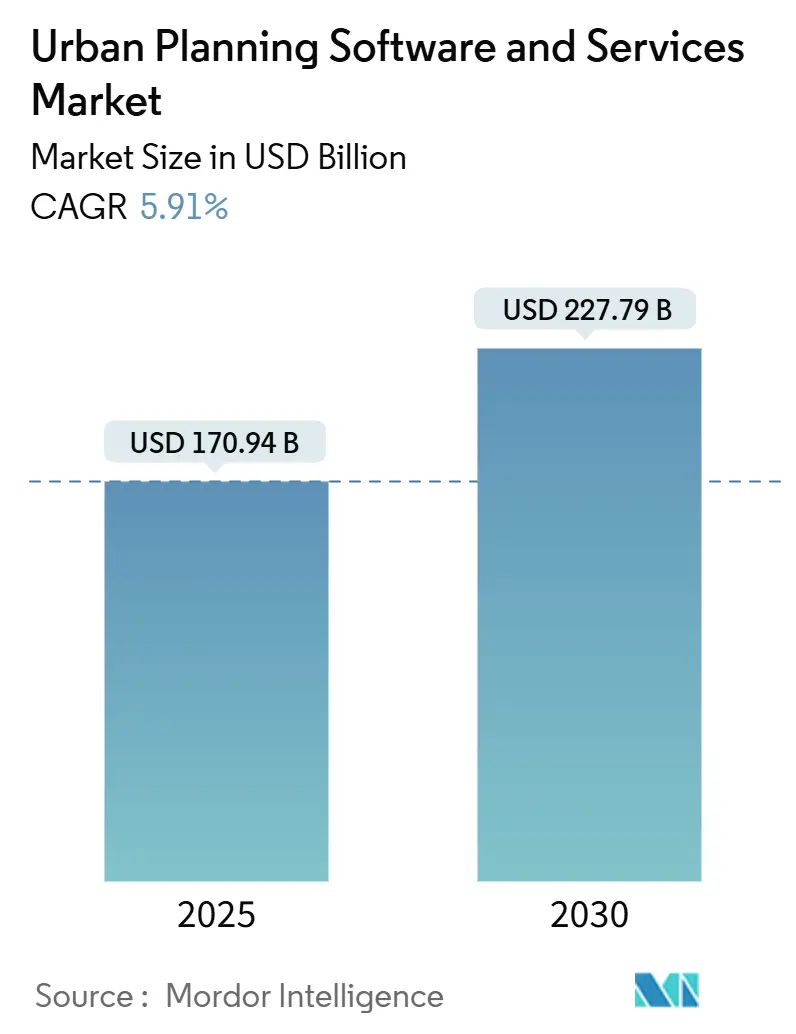
| Market Size (2025) | USD 170.94 Billion |
| Market Size (2030) | USD 227.79 Billion |
| Growth Rate (2025 - 2030) | 5.91% CAGR |
| Fastest Growing Market | South America |
| Largest Market | Asia Pacific |
| Market Concentration | Medium |
Major Players *Disclaimer: Major Players sorted in no particular order Image © Mordor Intelligence. Reuse requires attribution under CC BY 4.0. | |
Urban Planning Software And Services Market Analysis by Mordor Intelligence
The urban planning software and services market size stands at USD 170.94 billion in 2025 and is projected to reach USD 227.79 billion by 2030, translating into a 5.91% CAGR over the period. Robust public-sector spending on smart-city infrastructure, the rapid shift toward cloud-hosted platforms, and tightening government mandates for Building Information Modeling (BIM) and Geographic Information Systems (GIS) integration are accelerating technology procurement cycles. Municipal commitments to data-driven climate resilience further reinforce demand, as digital twin environments become core operating systems for city operations. Continuous platform convergence, especially BIM-GIS interoperability, allows vendors to bundle analytics, visualization, and compliance modules, raising switching costs while expanding wallet share. Competitive intensity is moderate; global incumbents are defending share through ecosystem partnerships that wrap consulting and managed services around software subscriptions, while niche entrants exploit opportunities in environmental analytics and citizen-engagement add-ons.
Key Report Takeaways
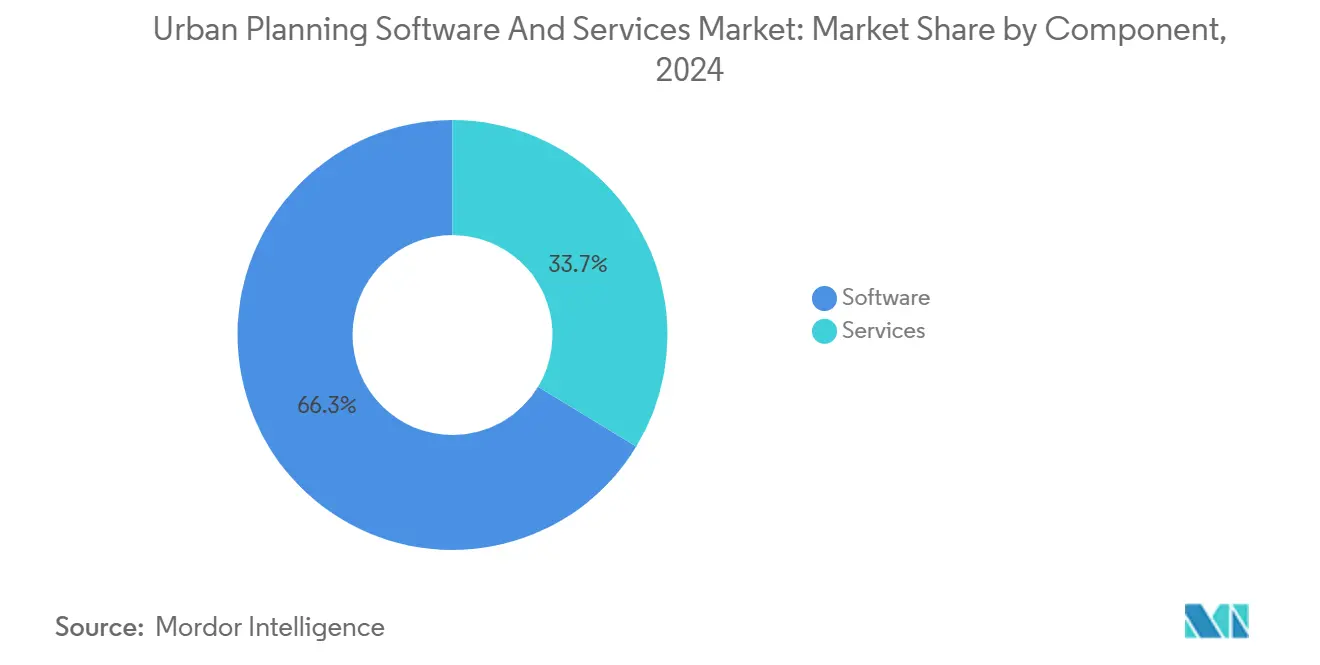
- By component, software maintained 66.32% of 2024 revenue, whereas services are on track to grow at a 7.46% CAGR to 2030, signaling a shift toward outcome-based engagements.
- By deployment, cloud platforms accounted for 59.12% of 2024 spend, and they are expanding at a 7.23% CAGR through 2030.
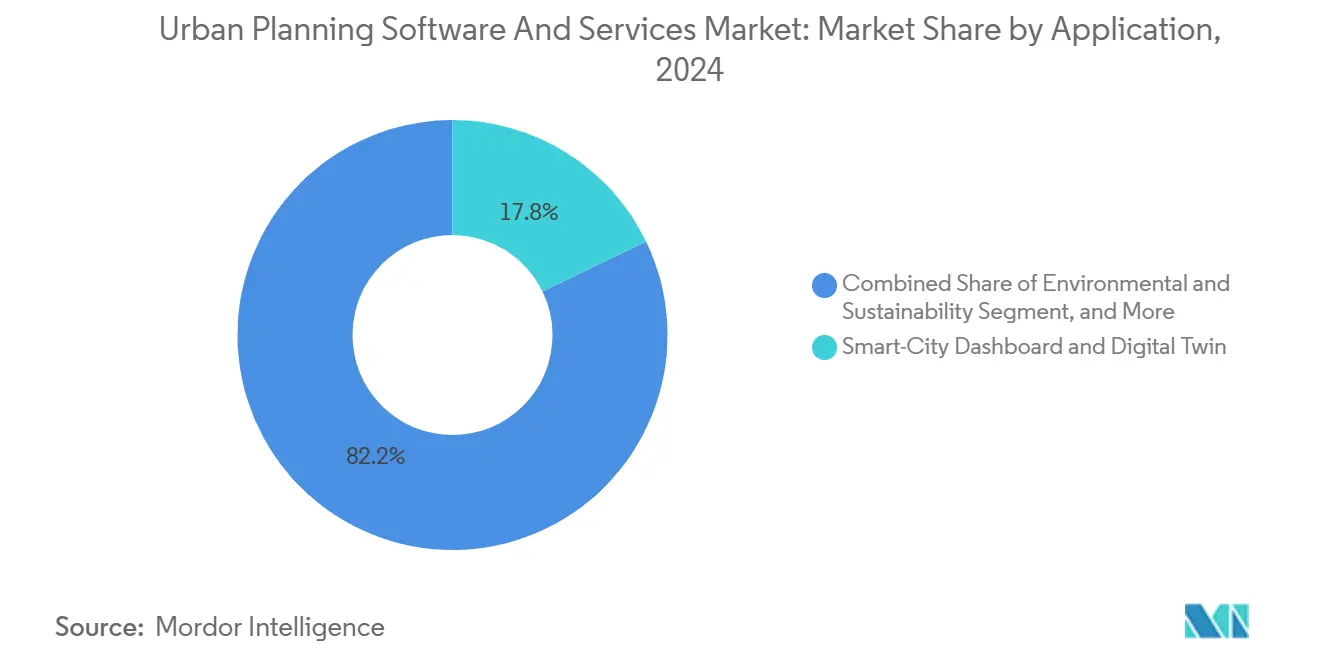
- By application, Smart-City Dashboard and Digital Twin tools captured 17.84% of the 2024 urban planning software and services market share, while environmental-sustainability modules witnessed the fastest 6.34% CAGR to 2030.
- By end user, municipal and regional governments commanded 38.49% of 2024 demand; academic institutions represent the fastest-growing customer class at 6.19% CAGR over the forecast.
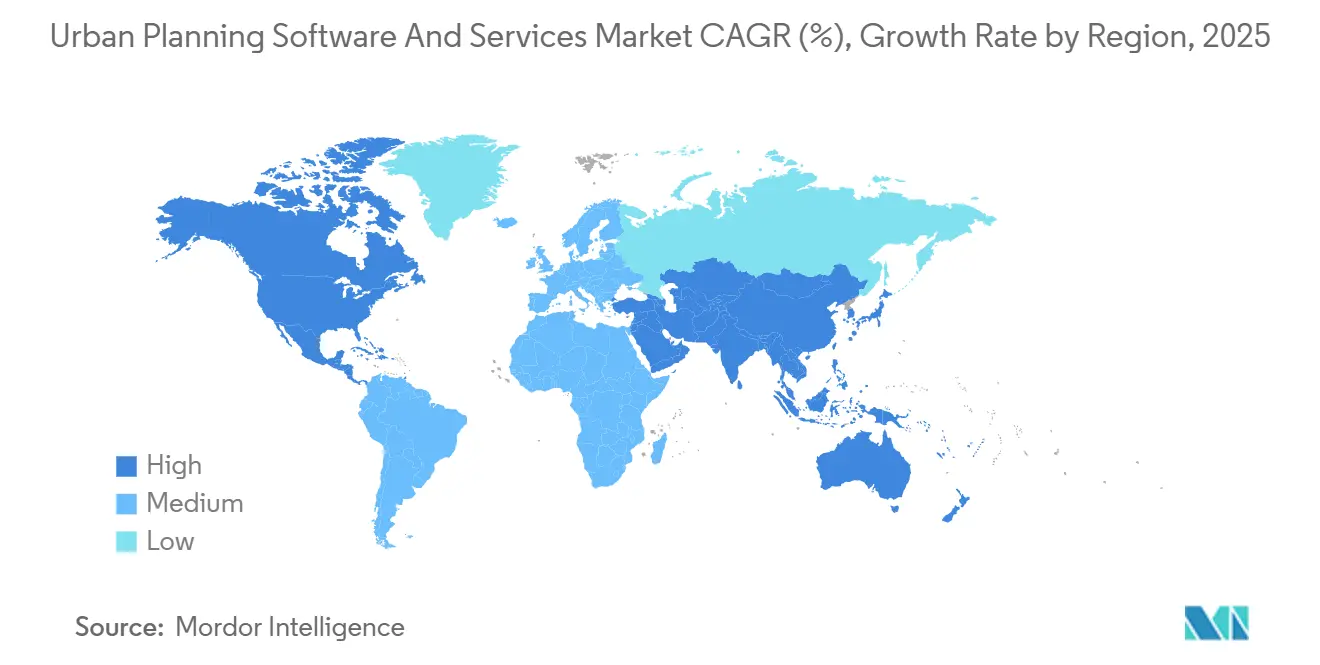
- By geography, Asia-Pacific led with 23.68% revenue in 2024; South America is poised for the highest 6.87% CAGR to 2030.
Global Urban Planning Software And Services Market Trends and Insights
Drivers Impact Analysis*
| Driver | (%) Impact on CAGR Forecast | Geographic Relevance | Impact Timeline |
|---|---|---|---|
| Smart-city stimulus programs | +1.8% | Asia-Pacific, Middle East, global spill-over | Medium term (2-4 years) |
| Government BIM-GIS mandates | +1.5% | North America, Europe, Asia-Pacific | Short term (≤ 2 years) |
| Rapid cloud migration across AEC | +1.2% | North America, Europe, global | Short term (≤ 2 years) |
| Integrated 3D city models and digital twins | +1.0% | Early adoption in developed markets | Medium term (2-4 years) |
| Urban heat-island analytics demand | +0.3% | Europe, North America, select Asia-Pacific | Long term (≥ 4 years) |
| ESG-linked municipal bond disclosure tools | +0.2% | North America, Europe | Medium term (2-4 years) |
| Source: Mordor Intelligence | |||
Mainstream smart-city initiatives and infrastructure stimulus
National and provincial governments are embedding platform funding into multi-year stimulus packages, guaranteeing recurring revenue streams for vendors. Seoul’s hyper-realistic digital-twin rollout in 2024 sets a new benchmark for municipal visualization standards. Munich’s publicly funded Digital Twin project targets climate-resilient redevelopment of its historic center, catalyzing demand for high-resolution environmental analytics plug-ins. Gulf cities such as Dubai deploy AI-enabled traffic-signal twins that cut congestion and operational carbon, validating ROI for data-rich 3D models.[1]Middle East AI News, “Digital Twin Takes Traffic Signals…,” MIDDLEEASTAINEWS.COMThese programs shift procurement from one-off licenses to evergreen platform contracts that bundle hosting, data, and managed services.
Government BIM and GIS adoption mandates
Compulsory BIM in public works removes discretionary budgeting obstacles and accelerates procurement. Hong Kong’s mandate covers USD 316 billion in approved works, anchoring vendor pipelines. Malaysia’s Construction Industry Development Board underscores BIM-digital-twin fusion as a prerequisite for smart-city readiness, broadening regulatory momentum beyond the Global North. [2]CIDB, “Preparing Smart Cities…,” SMART.CIDB.GOV.MY Data-repository regulations also create advisory and integration revenue for vendors that can ensure sovereign data controls.
Rapid cloud migration across the AEC value chain
Architecture, engineering, and construction firms are standardizing on secure cloud stacks to meet collaboration and cybersecurity mandates, pushing municipalities to align with similar deployment models. Rising cyber-compliance thresholds under frameworks such as the Cybersecurity Maturity Model extend to city contracts, propelling cloud adoption for GIS-BIM workloads. Subscription models replace capex with opex budgeting and unlock elastic compute for heavy 3D simulations.
Need for integrated 3D city models and digital twins
Planners recognize that standalone GIS or BIM cannot capture the systemic interplay of mobility, energy, and climate variables. Gothenburg’s city twin shows how parametric modeling and game-engine visualization identify segregation hotspots and climate-adaptation priorities. Universities refine methodologies-for instance, Tokyo’s rapid-twin framework to standardize data pipelines that later commercial platforms can productize, accelerating mainstream adoption.
Restraints Impact Analysis*
| Restraint | (%) Impact on CAGR Forecast | Geographic Relevance | Impact Timeline |
|---|---|---|---|
| High up-front licensing and data-integration costs | -0.8% | Smaller municipalities worldwide | Short term (≤ 2 years) |
| Skills shortage in urban-tech professions | -0.6% | Acute in developed markets | Medium term (2-4 years) |
| Cross-border data-sovereignty barriers | -0.3% | Europe, Asia-Pacific, emerging markets | Long term (≥ 4 years) |
| Algorithmic-zoning litigation risk | -0.2% | North America, Europe | Long term (≥ 4 years) |
| Source: Mordor Intelligence | |||
High upfront licensing and data-integration costs
Enterprise platforms can exceed USD 1 million in first-year spend once data migration, customization, and training are included. Marseille’s budgeting-optimization modernization required enterprise licensing plus integration of legacy finance feeds across 12,500 employees, underscoring the fiscal hurdle for mid-tier cities.[3]Pigment, “How City of Marseille Optimized Budgeting…,” PIGMENT.COMWhen funding is unavailable, municipalities defer adoption or restrict scope to departmental pilots, delaying full-platform scale-up.
Shortage of skilled urban-tech professionals
Nine out of 10 local planning departments in England report recruitment challenges, forcing 60% to rely on agency staff and 51% on expensive consultants. Similar gaps exist across North America and the Asia-Pacific in advanced GIS, data-science, and digital-twin operations. The talent bottleneck raises total implementation cost and prolongs time-to-value, dampening market pace.
*Our forecasts treat driver/restraint impacts as directional, not additive. The impact forecasts reflect baseline growth, mix effects, and variable interactions.
Segment Analysis
By Component: Services accelerate platform adoption
Software licenses generated 66.32% of 2024 revenue, but services are advancing at 7.46% CAGR, confirming buyer preference for turnkey outcomes. Municipal clients increasingly bundle integration, workflow mapping, and change-management services into initial awards to de-risk digital-twin rollouts. The urban planning software and services market size for services reached USD 56.7 billion in 2025 and is tracking to surpass USD 87 billion by 2030. Service-led engagements cement long-term vendor relationships, opening cross-sell channels for analytics modules.
Second-phase managed-service contracts often equal or exceed original software value, particularly where cloud hosting, 24/7 data-ops, and cybersecurity monitoring are required. Brantford’s Cloudpermit deployment shows how smaller cities outsource end-to-end permit workflows, creating 2,385 digital workspaces without local IT burden. As more jurisdictions align procurement with outcome-based key performance indicators, services revenue will outpace license growth.


By Deployment: Cloud dominance reshapes competition
Cloud accounted for 59.12% of 2024 spend and is scaling at 7.23% CAGR. Municipalities seeking multi-agency collaboration favor elastic compute and real-time data-stream ingestion. The urban planning software and services market share for on-premises solutions is shrinking as capital-expenditure budgets face pressure, although sovereign-data jurisdictions still demand localized hosting. Vendors exploit platform-as-a-service formats to upsell AI analytics, pay-per-simulation models, and carbon-footprint dashboards.
More than half of new RFPs in 2025 specify cloud-native or hybrid architectures, compelling legacy on-prem incumbents to re-platform. Providers with FedRAMP-equivalent certifications gain an edge, particularly in North America and Europe, where cybersecurity compliance is non-negotiable. Cloud-first architectures also reduce deployment lead times, thereby accelerating time-to-impact for municipalities under tight political deadlines.
By Application: Environmental sustainability drives innovation
Smart-City Dashboards and Digital-Twin suites held 17.84% share in 2024, yet environmental-sustainability modules are expanding fastest at 6.34% CAGR. Munich’s climate-twin illustrates how analytics pinpoint heat-island zones and model cooling interventions, turning sustainability from a reporting obligation into an operational imperative. As ESG disclosure rules strengthen, planners embed carbon-baseline and mitigation analytics within core workflows.
Transportation and mobility applications integrate traffic-signal twins and multimodal ridership analytics to optimize flows and cut emissions. Land-use and zoning functions are increasingly commoditized but remain purchasing triggers due to statutory necessity. Infrastructure and utility applications ride on grid-modernization funds, while AI-augmented scenario engines differentiate premium packages.

By End User: Academic institutions emerge as catalyst
Municipal governments contributed 38.49% of the 2024 spend, reflecting direct accountability for zoning, mobility, and resilience. However, academia’s 6.19% CAGR signals its rising influence. Universities conduct prototyping-such as hyper-scale twin simulation-then license findings to industry, shortening innovation cycles. The urban planning software and services market size attributable to universities is forecast to double by 2030.
Consultancies remain pivotal intermediaries, customizing workflows and bridging skill gaps inside public agencies. Real-estate developers adopt platforms for feasibility analytics to navigate complex zoning reforms. Transport authorities, exemplified by Metro Istanbul’s expectation of a 25% energy cut via digital twin operations, validate ROI for asset-heavy operators.
Geography Analysis
Asia-Pacific maintained a 23.68% share in 2024, underpinned by extensive smart-city mandates in China, India, and South Korea. Seoul’s nationwide 4th Smart City Comprehensive Plan (2024-2028) embeds digital-twin deployment across urban infrastructure, ensuring stable procurement pipelines. Singapore, Tokyo, and emerging Southeast-Asian metros allocate multi-year budgets to BIM-GIS convergence, sustaining vendor bookings through 2030.
South America, while smaller, leads in growth at a 6.87% CAGR to 2030. Development-bank financing steers Brazilian, Colombian, and Chilean municipalities toward cloud-native planning suites that circumvent legacy IT constraints. The urban planning software and services market size for the region is projected to cross USD 14 billion by 2030, driven by integrated transport and resilience projects.
North America holds mature yet resilient demand, anchored by federal BIM mandates and municipal carbon-reduction targets. Europe benefits from EU Green Deal funding that rewards smart-city projects fitting climate-adaptation metrics. Data-sovereignty rules, however, encourage hybrid deployments to keep sensitive GIS layers within national borders. Middle East and Africa show accelerating adoption, especially in Gulf Cooperation Council states, where giga-projects require next-generation planning tech; Dubai’s AI-directed traffic twin exemplifies applied deployment.

Competitive Landscape
Market leadership remains with Autodesk, Esri, and Bentley Systems, each leveraging open-platform strategies to lock in ecosystem partners. In 2025, Esri extended ArcGIS Urban with holistic site-plan management, deepening stickiness among city planners. Autodesk’s integration of ArcGIS basemaps into Forma tightens BIM-GIS workflows and multiplies upsell opportunities for carbon-analysis modules.
Bentley, Nemetschek, and Dassault Systèmes are intensifying interoperability pacts to protect installed bases as cloud-native disruptors surface. Trimble’s 14% rise in annual recurring revenue and USD 1 billion buyback underline investor confidence in subscription expansion. Smaller pure-plays differentiate on AI-powered urban massing, zoning-responsive generative design, or climate-risk scoring. Competitive pressure is tempered by high data-migration switching costs, yet cloud deployments reduce lock-in, compelling incumbents to show continuous ROI through analytics updates and partner integrations.
Urban Planning Software And Services Industry Leaders
Autodesk, Inc.
Environmental Systems Research Institute, Inc. (Esri)
Bentley Systems, Incorporated
Trimble Inc.
Hexagon AB
- *Disclaimer: Major Players sorted in no particular order

Recent Industry Developments
- March 2025: Esri launched comprehensive site-plan management in ArcGIS Urban, enabling 3D model uploads and environmental-impact analysis.
- February 2025: Munich commenced climate-resilient old-town planning using its municipal digital twin.
- February 2025: Bentley Systems posted Q4 2024 revenue of USD 349.8 million, with subscription revenues at USD 315.6 million.
- February 2025: Dassault Systèmes reported FY 2024 revenue of EUR 6.21 billion, up 22% in 3DEXPERIENCE software.


Global Urban Planning Software And Services Market Report Scope
| Software |
| Services |
| Cloud-Based |
| On-Premises |
| Land-Use and Zoning |
| Transportation and Mobility Planning |
| Infrastructure and Utilities |
| Environmental and Sustainability |
| Smart-City Dashboard and Digital Twin |
| Municipal and Regional Governments |
| Urban Planning and Design Consultancies |
| Real-Estate and Infrastructure Developers |
| Academic and Research Institutions |
| Transport and Transit Authorities |
| North America | United States | |
| Canada | ||
| Mexico | ||
| Europe | Germany | |
| United Kingdom | ||
| France | ||
| Russia | ||
| Rest of Europe | ||
| Asia-Pacific | China | |
| Japan | ||
| India | ||
| South Korea | ||
| Australia | ||
| Rest of Asia-Pacific | ||
| Middle East and Africa | Middle East | Saudi Arabia |
| United Arab Emirates | ||
| Rest of Middle East | ||
| Africa | South Africa | |
| Egypt | ||
| Rest of Africa | ||
| South America | Brazil | |
| Argentina | ||
| Rest of South America | ||
| By Component | Software | ||
| Services | |||
| By Deployment | Cloud-Based | ||
| On-Premises | |||
| By Application | Land-Use and Zoning | ||
| Transportation and Mobility Planning | |||
| Infrastructure and Utilities | |||
| Environmental and Sustainability | |||
| Smart-City Dashboard and Digital Twin | |||
| By End User | Municipal and Regional Governments | ||
| Urban Planning and Design Consultancies | |||
| Real-Estate and Infrastructure Developers | |||
| Academic and Research Institutions | |||
| Transport and Transit Authorities | |||
| By Geography | North America | United States | |
| Canada | |||
| Mexico | |||
| Europe | Germany | ||
| United Kingdom | |||
| France | |||
| Russia | |||
| Rest of Europe | |||
| Asia-Pacific | China | ||
| Japan | |||
| India | |||
| South Korea | |||
| Australia | |||
| Rest of Asia-Pacific | |||
| Middle East and Africa | Middle East | Saudi Arabia | |
| United Arab Emirates | |||
| Rest of Middle East | |||
| Africa | South Africa | ||
| Egypt | |||
| Rest of Africa | |||
| South America | Brazil | ||
| Argentina | |||
| Rest of South America | |||


Key Questions Answered in the Report
How fast is the urban planning software and services market expected to grow to 2030?
The market will expand at a 5.91% CAGR, rising from USD 170.94 billion in 2025 to USD 227.79 billion in 2030.
Which deployment model is gaining the most traction among city governments?
Cloud-based platforms command 59.12% of current spending and show a 7.23% CAGR, driven by collaboration and cybersecurity demands.
What factors are propelling demand for environmental-sustainability planning tools?
Climate-adaptation mandates and ESG reporting rules are pushing municipalities to adopt analytics that model carbon baselines and heat-island risks within their digital twins.
Which region will post the highest growth through 2030?
South America leads with a 6.87% CAGR as development-bank financing and modernization programs accelerate digital-planning adoption.
How are vendors safeguarding market position amid new entrants?
Leaders such as Autodesk and Esri deepen interoperability partnerships, bundle services, and continuously release analytics upgrades to raise switching costs.
Why are academic institutions becoming important customers?
Universities deploy advanced modeling environments for research and pilot emerging methodologies that later scale into municipal procurement, driving a 6.19% CAGR within this segment.
Page last updated on:


