
Geographic Information System Market Size and Share
Market Overview
| Study Period | 2020 - 2031 |
|---|---|
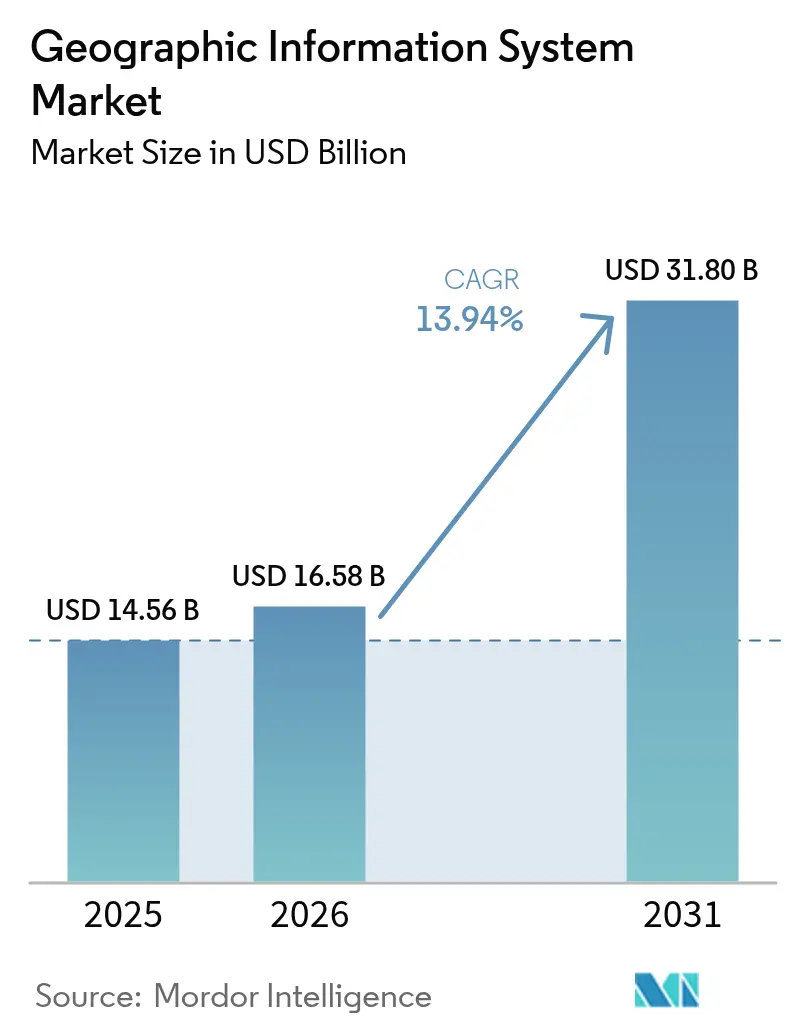
| Market Size (2026) | USD 16.58 Billion |
| Market Size (2031) | USD 31.8 Billion |
| Growth Rate (2026 - 2031) | 13.94 % |
| Fastest Growing Market | Asia-Pacific |
| Largest Market | North America |
| Market Concentration | Medium |
Major Players *Disclaimer: Major Players sorted in no particular order Image © Mordor Intelligence. Reuse requires attribution under CC BY 4.0. | |
Geographic Information System Market Analysis by Mordor Intelligence
The Geographic Information System market size was valued at USD 14.56 billion in 2025 and estimated to grow from USD 16.58 billion in 2026 to reach USD 31.8 billion by 2031, at a CAGR of 13.94% during the forecast period (2026-2031). Rapid smart-city roll-outs, national open-data mandates, and cloud-native deployments keep demand on an upward slope. Automated feature extraction from sub-30 cm imagery and real-time spatial analytics now reduce decision latency from weeks to minutes, pushing adoption in transportation, oil and gas, and public safety applications. [1]Satellogic, “Pushing Intelligence to the Edge: Satellogic's Vision for AI-Powered Earth Observation,” SATELLOGIC.COM Vendors that bundle AI, edge processing, and managed services continue to gain share as enterprises prioritize scalability and cyber-secure integration with operational networks.
Key Report Takeaways
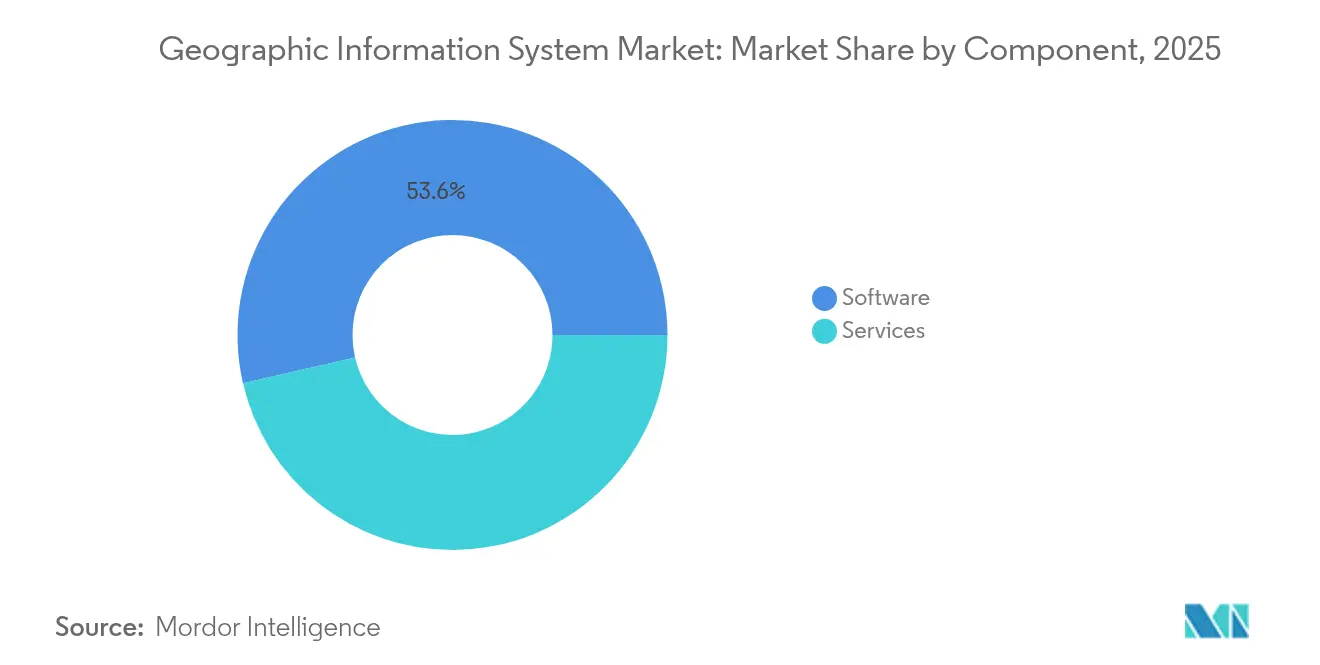
- By component, software commanded 53.60% of the Geographic information system market share in 2025, while services are projected to grow at a 15.45% CAGR through 2031.
- By function, mapping led with a 34.10% share of the Geographic information system market in 2025; geospatial data management and analysis is forecast to post a 15.70% CAGR to 2031.
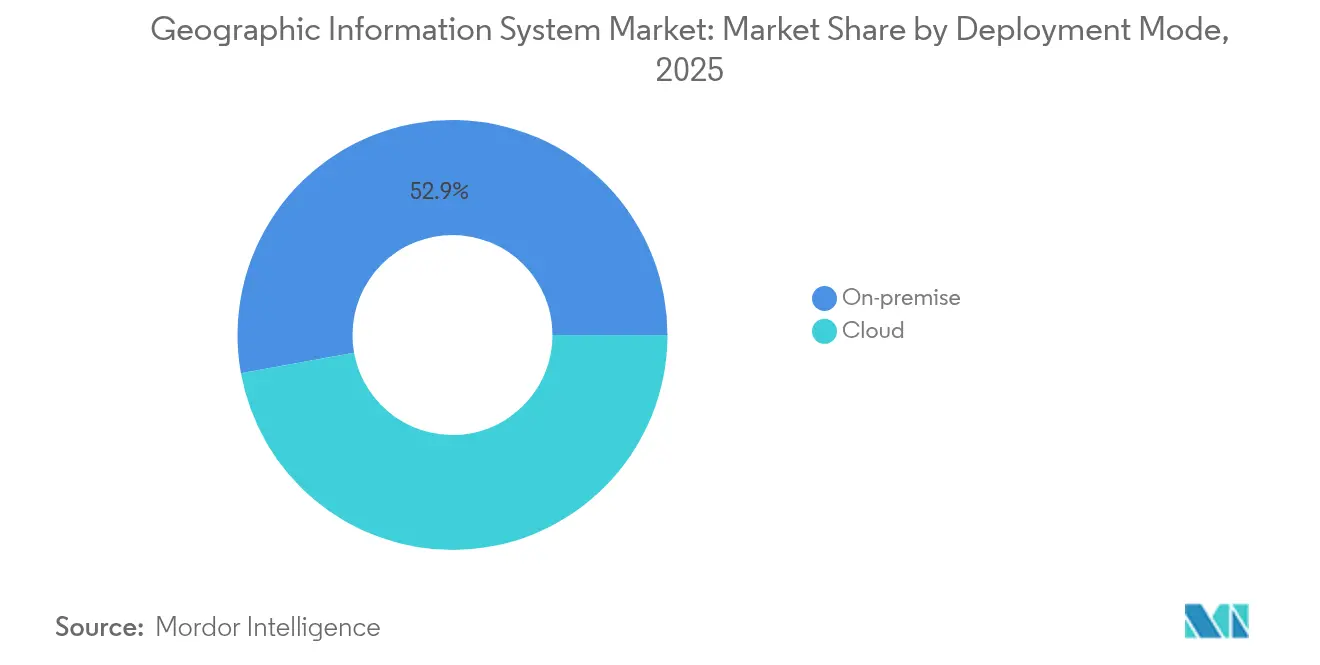
- By deployment mode, on-premise installations held 52.85% of the Geographic information system market size in 2025, whereas cloud deployment is expected to expand at a 16.05% CAGR.
- By end-user industry, transportation and logistics contributed 28.35% of the 2025 spending of the Geographic information system market; oil and gas exhibits the fastest trajectory at a 15.90% CAGR through 2031.
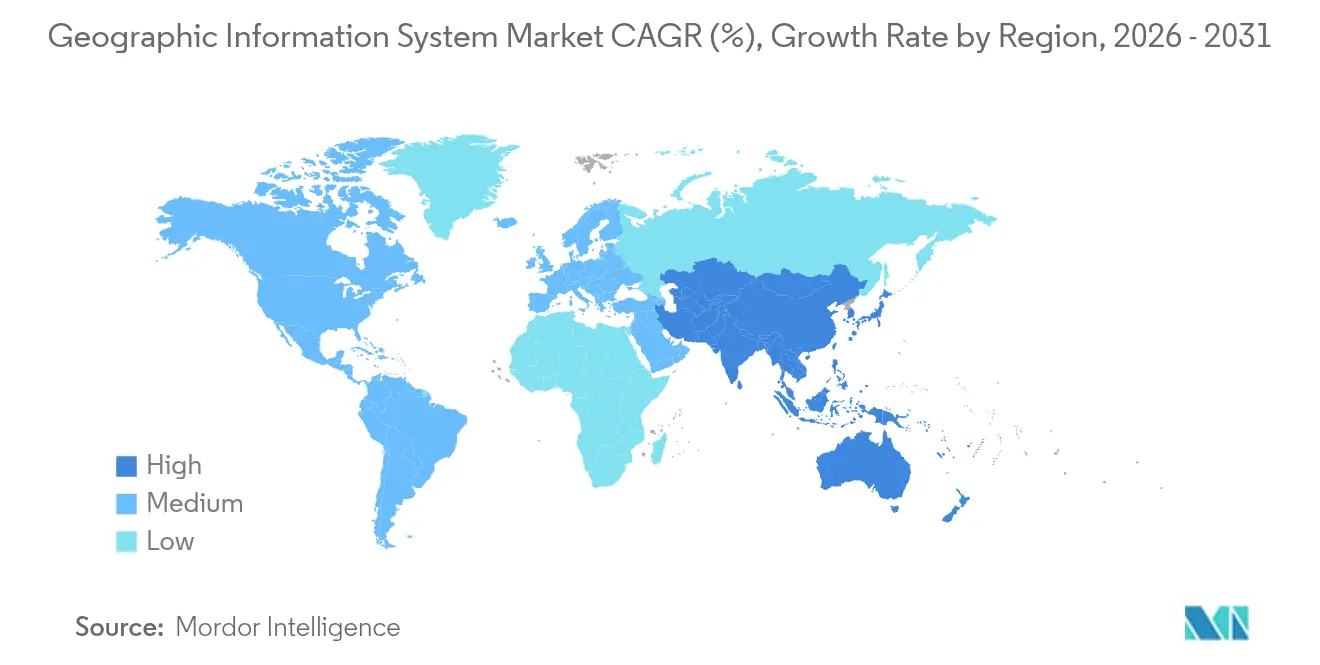
- By geography, North America maintained a 37.80% share in 2025 of the Geographic information system market; Asia-Pacific is set for the highest regional CAGR of 15.95% to 2031.
Note: Market size and forecast figures in this report are generated using Mordor Intelligence’s proprietary estimation framework, updated with the latest available data and insights as of 2026.
Market Trends and Insights
Drivers Impact Analysis of Geographic Information System Market*
| Driver | (~) % Impact on CAGR Forecast | Geographic Relevance | Impact Timeline |
|---|---|---|---|
| Widespread smart-city roll-outs require real-time geospatial infrastructure | +3.2% | Global, early gains in APAC and EU | Medium term (2–4 years) |
| Cloud-native GIS lowers TCO and speeds enterprise integration | +2.8% | North America and EU, spill-over to APAC | Short term (≤ 2 years) |
| Mobile-first field-data-collection platforms expand addressable user base | +2.1% | Global, emerging markets strong | Medium term (2–4 years) |
| AI-powered auto-classification of satellite imagery accelerates analytics | +2.5% | North America, EU, China | Long term (≥ 4 years) |
| Sub-30 cm commercial microsatellite constellations unlock new precision use cases | +1.9% | Global, defense and agriculture focus | Long term (≥ 4 years) |
| National open-data mandates drive adoption | +1.8% | EU core, North America secondary | Medium term (2–4 years) |
| Source: Mordor Intelligence | |||
Widespread Smart-City Roll-Outs Require Real-Time Geospatial Infrastructure
City agencies are integrating the Geographic information system market platforms with 5G, IoT, and edge compute to orchestrate urban services. Singapore’s Open Digital Platform synchronizes district cooling, waste, and energy through streaming geospatial feeds, improving incident response and infrastructure uptime. [2]Esri, “Esri Collaborates with Google Maps Platform to Offer High-Quality Photorealistic 3D Tiles,” ESRI.COM Los Angeles uses real-time dashboards to route emergency crews, drawing 3.5 million situational-awareness map views during peak events. As municipalities budget for digital twins, vendors that deliver scalable 3D visualization, sensor APIs, and cybersecurity hardening capture a growing portion of public-sector IT spend.
Cloud-Native GIS Lowers TCO and Speeds Enterprise Integration
Bell Canada saved 40-60% in infrastructure outlay by shifting to a cloud-native geospatial data platform, illustrating how containerized micro-services and managed upgrades shorten deployment cycles. ArcGIS Enterprise on Kubernetes and similar offerings align GIS operations with DevOps pipelines, allowing dynamic scaling during disaster events without procurement delays. Push-down analytics in cloud data warehouses eliminate ETL bottlenecks, widening the Geographic information system market addressable base beyond traditional mapping teams.
Mobile-First Field-Data-Collection Platforms Expand Addressable User Base
Smartphone apps now merge GNSS, camera, and lidar sensors into simple survey workflows, cutting field-data costs by up to 70% and boosting accuracy. [3]Trimble Inc., “Trimble Investor Overview – August 2024,” TRIMBLE.COM Augmented-reality overlays help workers visualize buried utilities, preventing excavation mishaps. Offline synchronization protects continuity in remote zones, while 5G uplinks stream high-definition imagery to supervisors, underscoring how the Geographic information system market evolves into frontline operations.
AI-Powered Auto-Classification of Satellite Imagery Accelerates Analytics
Visual-language models now tag ships, roads, and crop stress directly on-orbit, reducing analytic latency from days to minutes. Defense agencies detect illicit construction faster, insurers monitor catastrophe exposure daily, and agribusinesses adjust irrigation in near real time. Service providers monetize API endpoints rather than raw pixels, expanding the Geographic Information System market value creation.
Restraints Impact Analysis of Geographic Information System Market*
| Restraint | (~) % Impact on CAGR Forecast | Geographic Relevance | Impact Timeline |
|---|---|---|---|
| Legacy IT integration complexity with OT and SCADA systems | -2.1% | Global, manufacturing and utilities | Short term (≤ 2 years) |
| Persistent data-quality/lineage gaps in crowdsourced layers | -1.8% | Global, all VGI users | Medium term (2–4 years) |
| Rising cloud-egress fees for petabyte-scale imagery archives | -1.3% | North America and EU | Short term (≤ 2 years) |
| Export-control tightening on high-resolution geospatial data | -1.1% | Global, defense and commercial | Long term (≥ 4 years) |
| Source: Mordor Intelligence | |||
Legacy IT Integration Complexity with OT and SCADA Systems
Utilities merging modern GIS with decades-old SCADA confront data-model mismatches, protocol gaps, and new cyber-threat surfaces. Liberty Utilities extended its migration timeline by 18 months due to iterative testing and middleware development. These overruns shift spending toward professional services, slowing software conversions in the Geographic information system market.
Persistent Data-Quality / Lineage Gaps in Crowdsourced Layers
Volunteered geographic information still exhibits uneven accuracy, especially outside urban OECD areas. Peer-reviewed assessments across European cities reveal inconsistent point-of-interest attributes, forcing enterprises to budget extra validation passes. Until automated conflation tools mature, mission-critical users will limit reliance on open contributions, capping growth in certain Geographic information system market niches.
*Our forecasts treat driver/restraint impacts as directional, not additive. The impact forecasts reflect baseline growth, mix effects, and variable interactions.
Geographic Information System Market Segment Analysis
By Component:
Services Propel Digital TransformationServices revenue in the Geographic information system market rose sharply in 2026, advancing at a 15.45% CAGR as enterprises outsourced cloud migration, AI model tuning, and lifecycle support. Managed-service bundles now cover data-quality audits, security patching, and 24/7 monitoring, shifting spending from capital to operating budgets. Software still accounts for 53.60% of 2025 sales, anchored by the ArcGIS, Hexagon NetWorks, and Trimble Cityworks portfolios. Their continuous update cadence, Esri reinvests roughly 28% of annual turnover into R&D, keeping feature velocity high, while open-API frameworks welcome third-party extensions. Hardware remains essential for GNSS receivers, lidar scanners, and rugged tablets, yet margins compress as more functions migrate into the software layer. The geographic information system market size tied to pure hardware shipments therefore grows more slowly, even as sensor count climbs.
Industry buyers favor vendors that can deliver outcome-oriented service-level agreements; for example, Hexagon’s 2025 decision to divest non-core assets freed capital to bolster subscription support offerings. Training academies, DevOps toolchains, and certified partner networks now form critical selection criteria, signaling a pivot from license counts to customer success metrics across the Geographic information system market.



By Function:
Mapping Underpins Insight-Driven AnalyticsMapping held a 34.10% share in 2025, furnishing the spatial context for every downstream workflow. Yet the analytics sub-segment is expanding fastest at 15.70% CAGR, powered by edge inference, foundation models, and data-lakehouse architectures. Enterprises embed predictive geofencing into ERPs, while authorities model urban heat islands through multi-spectral stacks. Surveying remains steady, reinvented through drone photogrammetry that compresses week-long terrain captures into same-day deliverables.
Telematics gains from electric-vehicle routing and cold-chain monitoring, integrating EV-specific range calculations. Location-based services flourish via hyper-personalized retail apps that trigger in-store promotions, though competition from native smartphone OS APIs keeps vendor margins in check. Overall, the Geographic information system market aligns functional roadmaps around holistic data-fabric principles, merging ingestion, cataloging, and AI pipelines under a single governance umbrella.
By Deployment Mode:
Cloud Drives Scalability, Hybrid Ensures ControlOn-prem clusters still host 52.85% of deployed instances, favored by defense, utilities, and regulators that demand air-gapped architectures. Cloud footprints, however, grow at a 16.05% CAGR as sovereign-cloud frameworks and FedRAMP-equivalent certifications ease compliance barriers.
The geographic information system market size attributable to cloud subscriptions more than doubles between 2026 and 2031. GPU pools, serverless geospatial SQL, and regional edge zones offer elastic performance for compute-intensive terrain analytics. Yet, rising egress fees spur new patterns of object storage tiering, in-cloud AI inference, and on-orbit compression to keep total cost of ownership predictable. Hybrid blueprints enjoy heightened interest; sensitive telemetry is processed at the edge, while non-confidential layers flow to public clouds for collaboration.
By End-User Industry:
Oil and Gas Surges as Digital Twins MatureTransportation and logistics contributed 28.35% of 2025 revenue, deploying GIS for fleet routing, yard management, and cross-border compliance. Oil and gas posts the fastest climb, charting a 15.90% CAGR as producers layer leak-detection models and regulatory reporting onto refineries’ 3D twins. OMV’s deployment demonstrates how continuous spatial audits shrink inspection downtime and bolster ESG transparency.
Government and defense remain stalwarts, expanding intelligence-surveillance-reconnaissance feeds and next-generation 9-1-1 roll-outs. Utilities accelerate grid digitalization, integrating vegetation-risk analytics and outage prediction. Construction, mining, and telecom realize step-changes through lidar-to-BIM pipelines, pit-wall monitoring, and 5G millimeter-wave siting, respectively. Collectively, these verticals illustrate the widening relevance of the Geographic information system market across physical-asset life cycles.
Geography Analysis
North America Geographic Information System Market
North America preserved 37.80% of 2025 spending, thanks to mature cloud infrastructure, robust R&D funding, and agency mandates like the U.S. Geospatial Data Act that standardize interoperability and metadata. Federal programs secure multi-year budgets for wildfire modeling, broadband equity mapping, and critical-infrastructure resilience. Enterprises such as Trimble invest more than USD 660 million annually in innovation, generating patents that reinforce the region’s technological edge. Yet rising cloud-de-storage fees pose cost challenges for petabyte-class imagery analytics, motivating negotiations for localized sovereign clouds.
APAC and Saudi Arabia Geographic Information System Market
Asia-Pacific is on track for the highest 15.95% regional CAGR, fuelled by megacity modernization and infrastructure stimulus. Singapore scales 3D underground mapping to mitigate space constraints, while India’s Digital Twin Mission links logistics corridors with unified parcel-level cadasters. Saudi Arabia’s USD 1 billion digital-twin collaboration with Naver underscores Gulf ambitions for smart-city leadership. Regional hurdles include fragmented data-residency rules and varying export controls, yet domestic satellite launches and sovereign cloud zones are mitigating dependencies.
EMEA and South America Geographic Information System Market
Europe’s growth remains steady, anchored by the INSPIRE directive that democratizes high-value datasets. Open access spawns start-ups specializing in climate-risk scoring and renewable-siting analytics. GDPR influences architecture design, spurring privacy-enhancing computation and in-region processing. South America, the Middle East, and Africa together represent a smaller base but display accelerated adoption in mineral exploration, precision agriculture, and infrastructure security. These markets often leapfrog legacy systems, adopting cloud-native GIS from inception, thereby enlarging the Geographic information system market size through greenfield demand.

Regulatory Landscape
Geographic information system deployments are shaped by government interoperability and data-governance frameworks that push agencies toward standardized, shareable geospatial layers. In the United States, the Geospatial Data Act framework (43 USC 2806) is operationalized through the Federal Geographic Data Committee (FGDC) standards policy, which directs federal agencies to use voluntary consensus standards consistent with OMB Circular A-119. This influences procurement language, metadata requirements, and cross-agency data exchange.
In Europe, INSPIRE is under active revision to align with Regulation (EU) 2024/903, with a stronger tilt toward API-based access and simplified technical rules for publishing and reusing geospatial datasets. Standards bodies also anchor compliance: ISO/TC 211 advances core geospatial standards, including updates such as ISO 19135:2026 and ongoing work on tile and API-related specifications. These efforts support conformance and machine-readable interoperability needed for cloud-native, multi-provider GIS environments.
Value Chain Analysis
The GIS value chain begins with data capture and sourcing, spanning satellite and airborne remote sensing, GNSS, lidar, and mobile and IoT field collection, alongside authoritative registries. Upstream data providers and sensor ecosystems feed imagery, elevation, and thematic layers into processing workflows where validation, conflation, cataloging, and governance convert raw inputs into decision-grade datasets. Processing has shifted toward cloud pipelines that host scalable storage and compute for feature extraction and analytics, while platform vendors package capabilities as desktop, web, and API services that integrate into enterprise systems.
Downstream, distribution and monetization increasingly occur inside major GIS platforms through embedded data marketplaces and integrated operational workflows. Esri expanded embedded access to premium weather intelligence through Baron Weather and extended high-resolution basemap refresh via Vantor, illustrating chain tightening around platform-centric delivery. Enterprise platform integrations, such as ArcGIS connectors to operational software stacks, reduce fragmentation for buyers. System integrators and managed service providers support implementation and operations, including cloud migration, cybersecurity hardening, and lifecycle support, particularly in hybrid deployments where sensitive layers remain on-premise while collaboration and scale-out analytics run in public or sovereign clouds.
Competitive Landscape
Moderate concentration characterizes the Geographic information system market: Esri, Hexagon, Trimble, Bentley Systems, and HERE Technologies collectively capture an estimated 60% of global revenue. Esri fortifies dominance via quarterly feature releases and a 2,000-member partner ecosystem. Hexagon sharpened its focus by divesting USD 90 million in non-core assets and reinvesting in AI-enabled public-safety modules. Trimble fuses hardware and SaaS, converting device telemetry into subscription dashboards that smooth revenue volatility.
Consolidation accelerates: KKR acquired IQGeo for USD 333 million to penetrate telecom network orchestration, [4]KKR, “KKR Completes Acquisition of Geospatial Software Business IQGeo,” KKR.COM while Siemens closed a USD 10 billion deal for Altair, marrying simulation with geospatial digital twins. Meanwhile, HERE and AWS committed USD 1 billion over ten years to embed AI-rich mapping into software-defined vehicles. Start-ups such as Mach9 secured USD 12 million to speed lidar point-cloud processing by 96 times, threatening incumbent workflows.
Competitive levers shift toward AI model libraries, edge-optimized runtimes, and sector-specific solutions. Vendors embed large language models to translate natural-language prompts into spatial queries, broadening user reach beyond GIS specialists. Regulatory licenses for sub-30 cm imagery act as defensive moats, while open-source geocoding and vector-tile engines erode lock-in elsewhere. Ultimately, players able to deliver turnkey, compliance-ready, and cloud-agnostic offerings command premium valuation multiples across the Geographic information system market.
Geographic Information System Industry Leaders
Environmental Systems Research Institute, Inc. (Esri)
Hexagon AB
Trimble Inc.
Autodesk, Inc.
Bentley Systems, Incorporated
- *Disclaimer: Major Players sorted in no particular order

Geographic Information System Market Companies Covered in this Report
- Environmental Systems Research Institute, Inc. (Esri)
- Hexagon AB
- Trimble Inc.
- Autodesk, Inc.
- Bentley Systems, Incorporated
- Topcon Positioning Systems, Inc.
- Pitney Bowes, Inc. (Precisely)
- Caliper Corporation
- Mapbox, Inc.
- Maxar Technologies Inc.
- Fugro N.V.
- SuperMap Software Co., Ltd.
- CARTO (CartoDB Inc.)
- Blue Marble Geographics, LLC
- GIS Cloud Ltd.
- TomTom N.V.
- Seequent Limited
- Spatialworks, Inc.
- Geosoft Inc.
- Woolpert, Inc.
- NV5 Geospatial Solutions, Inc.
- BlackSky Technology Inc.

Market Opportunities and Future Outlook
Government mandates and implementation plans are expanding the addressable scope for enterprise GIS beyond traditional mapping teams, especially where geospatial analytics becomes a prerequisite for infrastructure funding, approvals, or performance monitoring. In 2026, Bihar mandated geospatial analytics for state infrastructure projects above INR 50 crore, with technical approval routed through BIRSAC. The Government of India also released the VB-GRAMG framework, placing geospatial planning for rural infrastructure onto integrated digital platforms (including PM Gati Shakti, Bhuvan, and India-WRIS). These actions create whitespace for vendors and service providers in project screening, corridor planning, asset registries, and ongoing compliance reporting.
Utilities and built-environment workflows form another opportunity band as organizations replace legacy network models and connect GIS with OT, EAM, and BIM/CAD systems. Esri's ArcGIS Utility Network 2026 release added capabilities such as a telecom domain network configuration and enhanced tracing, which aligns with multi-asset network management programs. Switzerland's geoinformation strategy action plan also emphasizes SWISSGEO operationalization and GeoBIM advancement, reinforcing demand for interoperable digital-twin workflows. City-scale operations programs can further expand room for real-time dashboards and integrated asset coordination, as reflected in Karnataka's approval of a GIS-based integrated digital dashboard for the Greater Bengaluru Authority and Andhra Pradesh's Urban Digital Registry initiative to geo-reference and map 50 lakh properties across 123 urban local bodies using GIS and QR-coded physical tagging.
Recent Industry Developments in Geographic Information System Market
- July 2026: Esri launched ArcGIS for ServiceNow, enabling bidirectional integration between GIS layers and ServiceNow workflows. The deployment brings location intelligence into everyday enterprise service management, tightening GIS use across IT and field operations.
- June 2026: Hexagon acquired ITRES Research Limited to expand capabilities in airborne hyperspectral and thermal remote sensing. Adding specialized imaging technologies strengthens Hexagon's end-to-end stack for high-value mapping, analytics, and sector workflows that depend on advanced sensor data.
- August 2025: HERE Technologies and AWS entered a 10-year, USD 1 billion alliance to co-develop AI-powered mapping engines for automotive OEMs. The agreement deepens cloud-native map production and distribution, accelerating the shift toward API-delivered, continuously updated location services that integrate into broader GIS and analytics environments.


Geographic Information System Market Report Scope and Research Methodology
Market Definition and Coverage
For this methodology, the geographic information system (GIS) market is defined as revenues generated from GIS software, GIS-related services, and enabling hardware used to capture, manage, analyze, and visualize location-based data for commercial and public use.
Scope exclusions: We exclude pure surveying field labor billed as a standalone service when it is not tied to a GIS product or a platform deployment.
Segments Covered in This Report
- By Component
- Hardware
- Software
- Services
- By Function
- Mapping
- Surveying
- Telematics and Navigation
- Location-based Services
- Geospatial Data Management and Analysis
- By Deployment Mode
- On-premise
- Cloud
- By End-user Industry
- Agriculture
- Utilities
- Mining
- Construction
- Transportation and Logistics
- Oil and Gas
- Government and Defence
- Telecommunications
- Other End-user Industries
- By Geography
- North America
- United States
- Canada
- Mexico
- South America
- Brazil
- Argentina
- Chile
- Rest of South America
- Europe
- Germany
- United Kingdom
- France
- Italy
- Spain
- Rest of Europe
- Asia-Pacific
- China
- India
- Japan
- South Korea
- Malaysia
- Singapore
- Australia
- Rest of Asia-Pacific
- Middle East and Africa
- Middle East
- United Arab Emirates
- Saudi Arabia
- Turkey
- Rest of Middle East
- Africa
- South Africa
- Nigeria
- Rest of Africa
- Middle East
- North America
Data Sources, Market Sizing, and Validation
Desk Research
Desk work started with anchoring the demand pool using public data series that show where geospatial spending tends to land. We reviewed sources such as USGS and NASA Earth observation programs, Eurostat digital economy tables, US Census and national statistics offices for construction and utilities indicators, and open procurement portals for government mapping and IT purchases.
After that, model inputs were supported using company filings, investor decks, product documentation, and reputable press coverage that describes rollouts like smart city projects and cloud migrations. When company revenue splits were unclear, we used paid subscriptions for company financials and news intelligence to cross-check business line exposure, and we scanned patent databases to spot newer GIS capabilities that can influence adoption. The desk source list above is illustrative only, and many other public and paid references were used for collection, checks, and clarification.
Primary Interviews and Surveys
Primary interviews and short surveys were used to confirm what buyers actually purchase under GIS budgets, and how pricing shifts as deployments move from on-premise to cloud. We spoke with software and services stakeholders, channel partners, and user teams across government, utilities, construction, transportation, and natural resources, then we revisited a few contacts when the model outputs showed unusual swings by region.
Distribution of primary research fieldwork respondents
| Company type | Respondent position | Region |
|---|---|---|
| Top tier: 35% | CXOs: 12% | APAC: 40% |
| Mid tier: 50% | Functional/Unit leaders: 43% | EMEA: 34% |
| Smaller Players: 15% | Managers: 45% | Americas: 26% |
Market-Sizing & Forecasting
Sizing was built using a top-down and bottom-up sequence that stays practical for a global software-led market. First, a top-down demand pool was reconstructed by linking digital infrastructure spend and public-sector mapping activity to GIS penetration rates by major end-use areas, and then converting that into revenue using region-specific pricing ranges.
To keep the totals grounded, we corroborated them with selective bottom-up checks, such as sampled average annual contract values by deployment type, channel checks on typical seat counts, and a limited roll-up of supplier exposure where disclosure allowed it. Inputs used in the model included cloud versus on-premise mix, average license or subscription pricing, services attach rates, refresh or upgrade cycles, and the pace of smart city and utility network digitization programs. For forecasting, scenario analysis was applied around two main levers, cloud migration speed and public-sector project cadence, which were then adjusted using the direction shared by interviewees for budget growth and renewal behavior. Where bottom-up details were missing, gaps were handled by applying conservative adoption ranges and rechecking the implied spend per organization against interview benchmarks.
Data Validation & Update Cycle
Validation was done through several checks so the final series does not rely on a single indicator. We compared modeled revenues with independent signals such as government tender activity, disclosed performance trends in geospatial software lines, and regional IT spending momentum, and then investigated outliers before sign-off.
If a region or end-use estimate moved faster than expected, we rechecked the price and penetration assumptions and re-contacted a few respondents to understand the reason for the change. Reports are refreshed annually, and interim updates are made when a material event changes demand, pricing, or deployment patterns. Before delivery, an analyst completes a final pass to ensure the latest public updates are reflected in the numbers and narrative.
Mordor Intelligence's Geographic Information System Market Size Compared With Other Published Estimates
Published GIS market values often differ because scope lines are not drawn the same way, and also because pricing and cloud migration assumptions are refreshed at different times. The chosen base year, the currency conversion timing, and whether services are counted broadly can shift the reported total.
Standalone land surveying labor revenue is the biggest swing item, and it sits outside Mordor Intelligence's scope. That keeps the estimate tied to GIS software, services, and enabling hardware spend rather than the full surveying economy. Other differences usually come from how cloud subscriptions are annualized, whether navigation-focused location-based services are treated as GIS, and whether the model uses aggressive adoption curves without cross-checking them against procurement and renewal signals.
Benchmark comparison
| Source | Market Size | Gaps in Research Methodology |
|---|---|---|
| Mordor Intelligence | USD 14.56 B (2025) | |
| Global Publisher A | USD 11.61 B (2025) | Uses a narrower counted revenue pool in practice for GIS, often treating services as limited implementation only, and it can understate recurring subscription value when renewals and multi-year contracts are not normalized. |
| Industry Publisher B | USD 15.86 B (2025) | Often applies a wider inclusion set across hardware and adjacent location-based tools, and the uplift can come from bundling navigation or field mobility categories that are not always purchased as GIS. |
Looking across the figures, most of the spread can be explained by what gets counted as GIS services and whether adjacent location-based tools are pulled into the total. By keeping the inputs traceable to deployment mix, price ranges, and buyer renewal behavior, the estimate stays easier to replicate and to update when adoption or pricing shifts.


Key Questions Answered in the Report
How big will location-intelligence spending be by 2031?
The Geographic information system market is projected to reach USD 31.8 billion by 2031, nearly doubling 2026 levels at a 13.94% CAGR.
Which component outperforms over the next five years?
Services, thanks to cloud migration and managed-support demand, is forecast to grow at 15.45% CAGR, ahead of software and hardware.
Why does Asia-Pacific post the fastest growth rate?
Government-funded smart-city programs, mega-infrastructure builds, and high mobile-device penetration propel a 15.95% regional CAGR.
What limits adoption in utilities?
Integrating modern GIS with legacy SCADA increases project complexity, imposes cybersecurity requirements, and extends timelines.
How is AI changing geospatial analytics?
On-orbit and cloud inference now classifies satellite imagery in minutes, enabling rapid crop-health, defense, and climate-risk insights.
Which recent deal signals rising consolidation?
KKR’s USD 333 million purchase of IQGeo highlights private-equity interest in telecom-centric geospatial platforms.
Page last updated on:




