Market Overview
| Study Period | 2020 - 2031 |
|---|---|
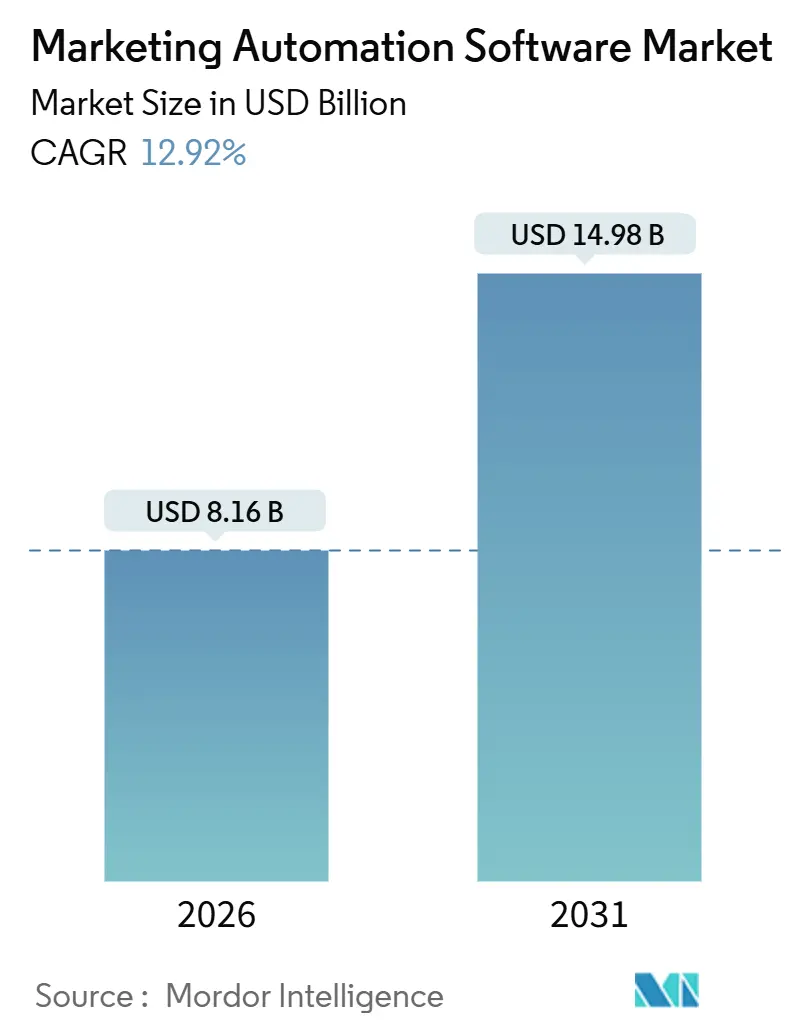
| Market Size (2026) | USD 8.16 Billion |
| Market Size (2031) | USD 14.98 Billion |
| Growth Rate (2026 - 2031) | 12.92% CAGR |
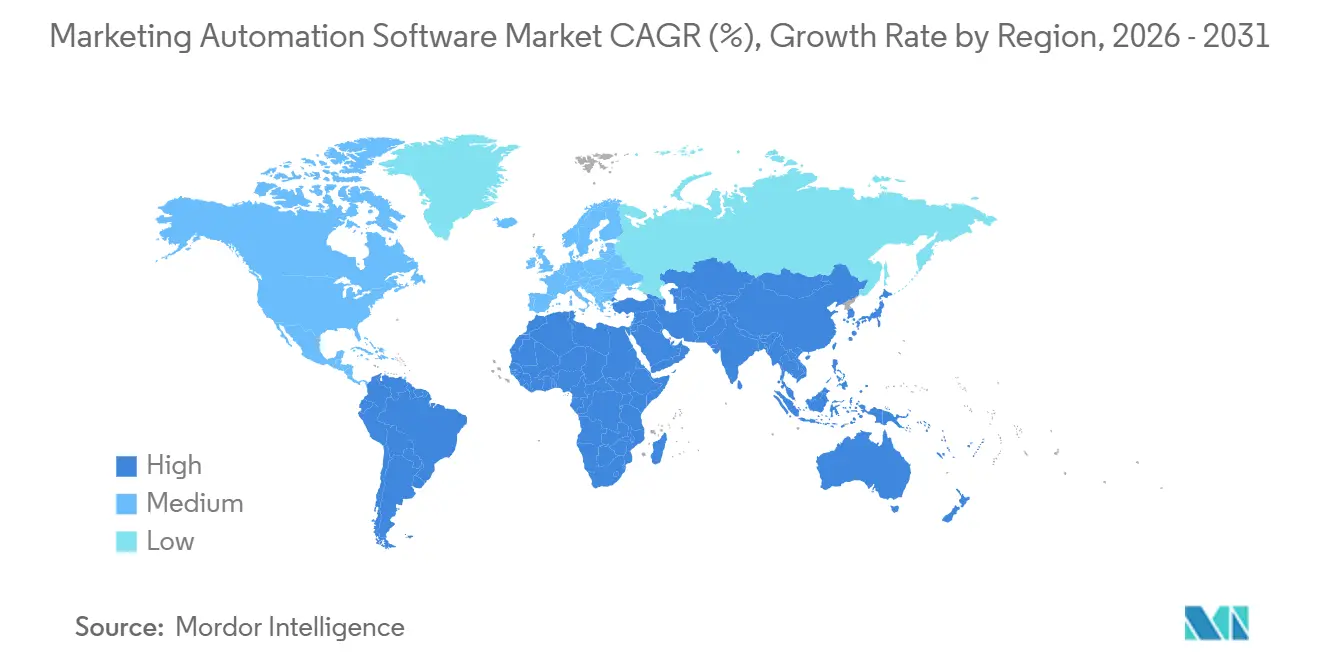
| Fastest Growing Market | Asia Pacific |
| Largest Market | North America |
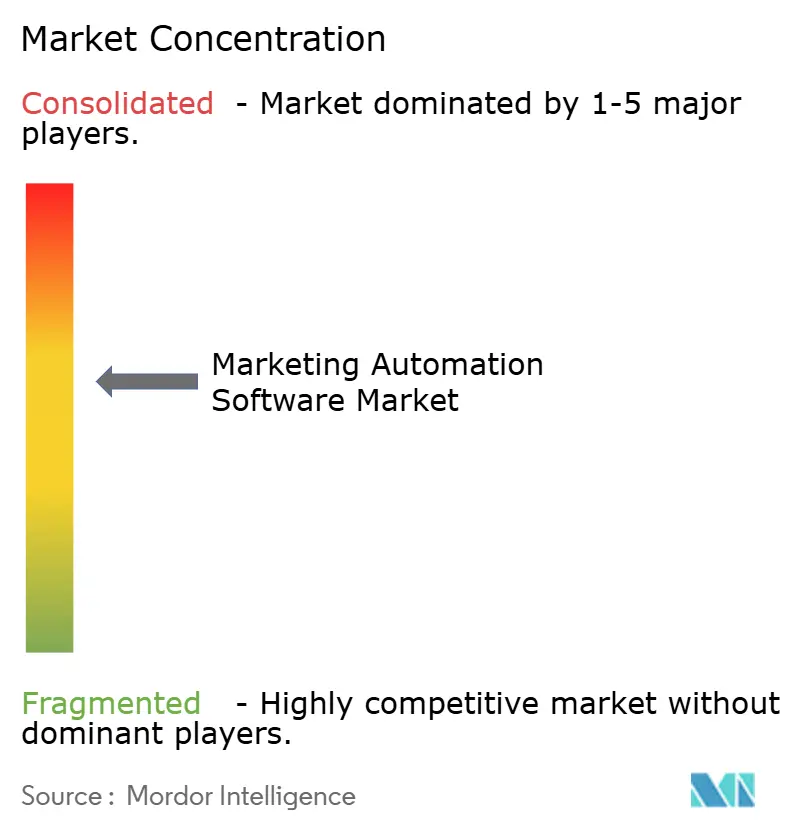
| Market Concentration | Medium |
Major Players *Disclaimer: Major Players sorted in no particular order Image © Mordor Intelligence. Reuse requires attribution under CC BY 4.0. | |
Marketing Automation Software Market Analysis by Mordor Intelligence
The marketing automation software market size stands at USD 8.16 billion in 2026 and is projected to reach USD 14.98 billion by 2031, advancing at a 12.92% CAGR over the forecast period. This growth reflects a structural migration from campaign-centric workflows to real-time, AI-directed personalization engines that absorb behavioral signals across owned, earned, and paid channels. The convergence of composable customer data platforms with marketing clouds has unlocked granular segmentation that was technically infeasible before 2024, while cloud-native pricing has lowered entry barriers for small and medium enterprises. Generative AI now automates content production and predictive lead scoring, enabling faster experimentation cycles and compressing time-to-campaign launch. Geographic momentum is shifting toward Asia-Pacific, where mobile-first consumer behavior and government digitization incentives are expanding the addressable base of small businesses. Although privacy regulations and multi-vendor integration challenges inject friction, vendors that embed compliance controls and open APIs are capturing an outsized share of new budgets.
Key Report Takeaways
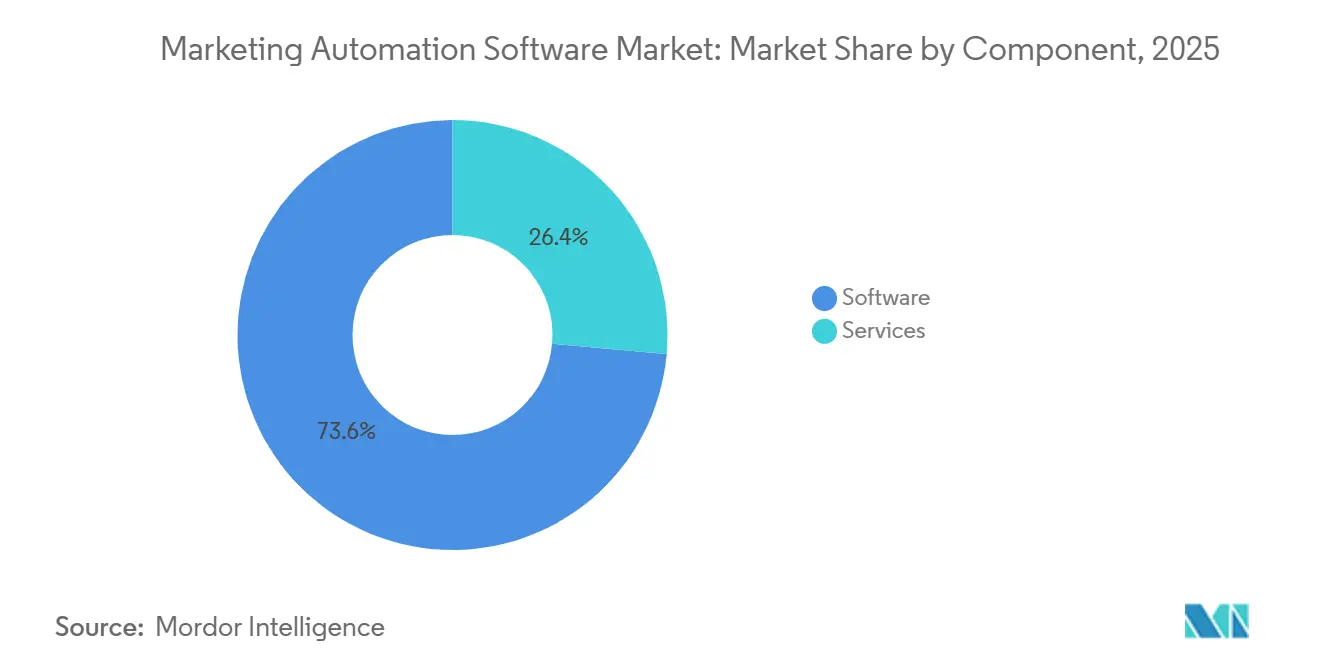
- By component, software captured 73.59% of the marketing automation software market share in 2025, while services are projected to expand at a 13.28% CAGR through 2031.
- By deployment, cloud-based models held 82.14% share in 2025 and are forecast to register the fastest growth at a 13.39% CAGR to 2031.
- By organization size, small and medium enterprises accounted for 62.88% of 2025 deployments and are poised to grow at a 13.33% CAGR through 2031.
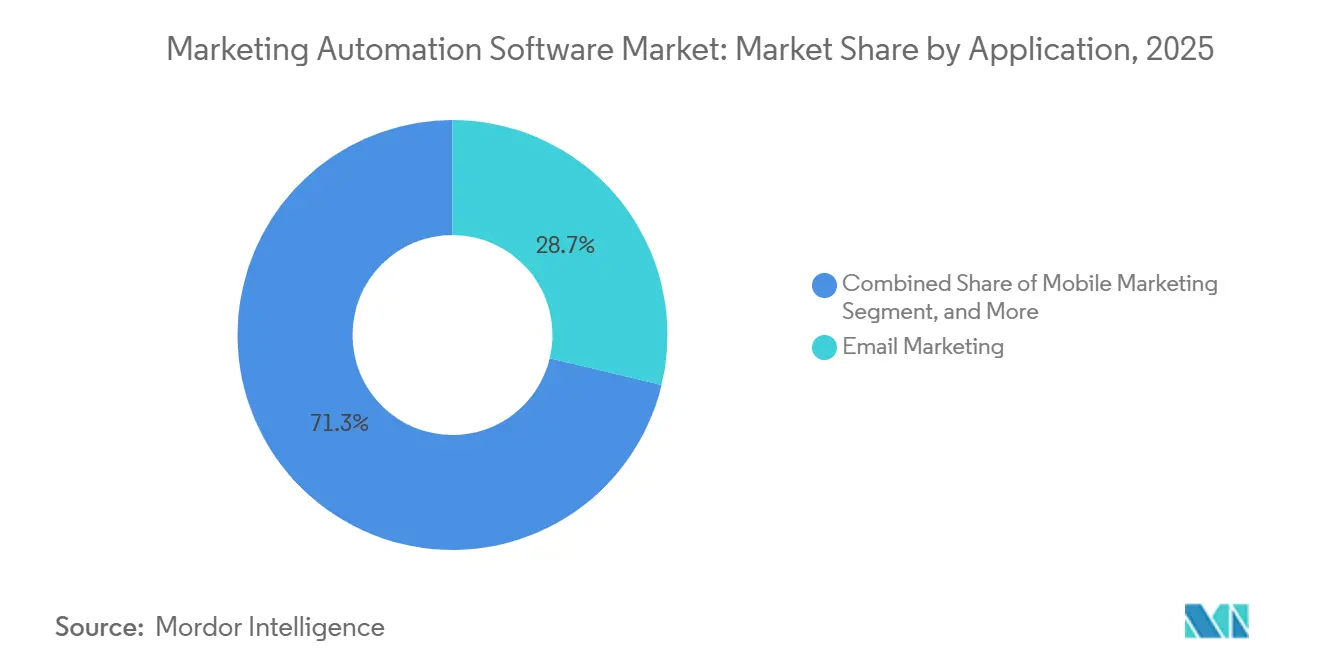
- By application, email marketing led with 28.73% of the marketing automation software market share in 2025, whereas mobile marketing is expected to advance at a 14.79% CAGR to 2031.
- By end-user vertical, retail and e-commerce dominated with 22.49% of the marketing automation software market share in 2025, while healthcare is set to grow the fastest at a 14.73% CAGR through 2031.
- By geography, North America retained a 42.38% share in 2025, yet Asia-Pacific is projected to post the highest regional CAGR at 13.96% over the forecast period.
Note: Market size and forecast figures in this report are generated using Mordor Intelligence’s proprietary estimation framework, updated with the latest available data and insights as of January 2026.
Global Marketing Automation Software Market Trends and Insights
Drivers Impact Analysis*
| Driver | (~) % Impact on CAGR Forecast | Geographic Relevance | Impact Timeline |
|---|---|---|---|
| Increase in SMB-First Cloud Adoption Surge Across Emerging Asia | +2.1% | Asia-Pacific core, spillover to Middle East and Africa | Medium term (2-4 years) |
| AI-Powered Hyper-Personalization Boosting Campaign ROI | +2.3% | Global, early concentration in North America and Europe | Short term (≤ 2 years) |
| Integration of Composable CDPs with CRM Suites | +1.8% | Global, led by North America and Europe enterprise segments | Medium term (2-4 years) |
| Compliance-Led Omnichannel Expansion in BFSI | +1.5% | Europe and North America, expanding to Asia-Pacific hubs | Long term (≥ 4 years) |
| Generative AI Content Automation Reducing Creative Cycle Time | +2.0% | Global, highest adoption in North America and Western Europe | Short term (≤ 2 years) |
| Zero-Party Data Collection Mandates Post-Cookie Deprecation | +1.6% | Global, pressure strongest in Europe and California | Medium term (2-4 years) |
| Source: Mordor Intelligence | |||
AI-Powered Hyper-Personalization Boosting Campaign ROI
Generative and predictive models inside core platforms now merge behavioral, transactional, and contextual data to tailor content to each prospect. Adobe’s 2025 executive survey showed that 65% of marketers rank AI as their primary revenue lever, yet only 12% have unlocked full ROI, underscoring a maturity gap that vendors address with pre-trained vertical models.[1]Adobe, “Adobe Digital Trends Report 2025,” Adobe.com Salesforce Einstein reduced manual segmentation time by 40% in a 2024 pilot for financial services users, allowing teams to shift hours from data work toward strategy. McKinsey’s 2025 benchmarking reported a 10-15% revenue uplift for brands running AI-driven personalization compared with rules-based cohorts. Streaming data from apps and IoT devices now triggers outreach within milliseconds, replacing daily batch cycles. As data pipelines harden, conversion lift is expected to rise further, anchoring long-term spending on AI modules.
Generative AI Content Automation Reducing Creative Cycle Time
Large language models embedded in marketing suites compress asset production from weeks to hours. HubSpot Breeze AI trimmed content creation times by up to 70% for early adopters during 2025 rollouts. Jasper AI generated more than 1 billion words of marketing copy in 2024, enabling 30-40% faster A/B test iterations for subscribers. Mid-market teams without in-house creative talent lean on AI drafts as scaffolds, while brand-voice variance still demands human review. Boston Consulting Group found that 38% of AI-assisted campaigns required additional editing to align tone, partly offsetting the speed gains. Vendors now fine-tune models on proprietary libraries to improve consistency and reduce rework cycles.
Integration of Composable CDPs with CRM Suites
Reverse-ETL tools such as Hightouch push unified customer profiles from cloud warehouses into campaign engines within minutes, eliminating batch latency that once hampered personalization.[2]Hightouch, “Composable CDP Launch,” Hightouch.io Salesforce Data Cloud cut duplicate records by up to 80%, sharpening targeting and lowering media waste for early users. Composability decouples data storage from application logic, reducing vendor lock-in and enabling firms to swap orchestration layers without rewriting pipelines. Financial services and healthcare companies favor the approach because it satisfies data-residency and consent mandates. Growing ecosystems of pre-built connectors are also opening new revenue streams for system-integrator partners.
Increase in SMB-First Cloud Adoption Surge Across Emerging Asia
Small firms in India, Indonesia, Vietnam, and the Philippines are adopting cloud marketing suites at a rate 2-3 percentage points faster than their North American peers each year. Localized rupee-denominated plans costing less than USD 50 per month removed foreign-exchange risk for Indian micro-enterprises. Digital India incentives and subsidized credits cut SaaS costs by up to 25% for qualifying SMBs, broadening the buyer base.[3]Telecom Regulatory Authority of India, “Annual Report 2024-25,” Trai.gov.in Mobile data prices averaged USD 0.09 per gigabyte in 2025, ensuring always-on access to cloud workflows. Vendors offering vernacular interfaces and regional payment rails logged 40% growth in Asia-Pacific SMB revenue in 2025. The momentum is expanding total addressable demand and driving template-driven features suited to resource-constrained teams.
Restraints Impact Analysis*
| Restraint | (~) % Impact on CAGR Forecast | Geographic Relevance | Impact Timeline |
|---|---|---|---|
| Multi-Vendor MarTech Stack Integration Overheads in Heavy-Industry Manufacturing | -1.2% | Global, most acute in Europe and North America legacy bases | Long term (≥ 4 years) |
| Mid-Market Talent Shortage in Marketing Operations Across EMEA | -0.9% | Europe and Middle East, spillover to North Africa | Medium term (2-4 years) |
| SaaS Subscription Fatigue Driving Higher Tool Churn in SMBs | -1.0% | Global, pronounced in North America and Western Europe | Short term (≤ 2 years) |
| Increasing Privacy Sandbox Restrictions Curtailing Third-Party Data Targeting | -0.8% | Global, strongest in Europe and California | Medium term (2-4 years) |
| Source: Mordor Intelligence | |||
Multi-Vendor MarTech Stack Integration Overheads in Heavy-Industry Manufacturing
Manufacturers often run 15-30 disparate systems spanning ERP, CRM, analytics, and content management. PwC found that custom middleware to bridge these tools consumes up to 30% of MarTech budgets and introduces data errors exceeding 5% in complex environments. Schema mismatches weaken AI models because inconsistent inputs degrade the quality of recommendations. Integration work also diverts capital away from campaign innovation, slowing payback periods for new licenses. Incumbent suites with broad connector libraries retain an edge, yet high switching costs deter late adopters from entering the marketing automation software market.
Mid-Market Talent Shortage in Marketing Operations Across EMEA
PwC’s 2025 Digital Skills Survey revealed a 23% shortfall in qualified marketing technologists across Germany, France, and the United Kingdom, with gaps most acute in SQL, API management, and platform administration. Universities lag in curriculum updates, so firms rely on vendor certificates that produce narrow skill sets. Mid-market employers struggle to match enterprise salaries, turning to consultants who charge EUR 150-250 (USD 160-265) per hour and thereby inflate the total cost of ownership. Staffing gaps push teams toward batch email tactics rather than event-driven journeys, muting ROI. Slower deployment velocity limits regional penetration and tempers the marketing automation software market growth outlook across EMEA.
*Our forecasts treat driver/restraint impacts as directional, not additive. The impact forecasts reflect baseline growth, mix effects, and variable interactions.
Segment Analysis
By Component: Services Expand on Integration Complexity
The services segment accounts for a growing share of the marketing automation software market size, advancing at a 13.28% CAGR from 2026-2031 as enterprises outsource integration and managed operations. Services include consulting, implementation, and ongoing campaign execution, often bundled in outcome-based contracts. Software still accounted for 73.59% of revenue in 2025, reflecting SaaS subscription dominance, yet rising architectural complexity is tilting incremental spend toward certified partners. For example, Salesforce’s professional services backlog hit USD 3.2 billion in Q4 2024, underscoring demand for Data Cloud and Marketing Cloud rollouts. Boutique agencies now specialize in HIPAA-compliant workflows or PSD2-aligned campaigns, addressing vertical nuances that generic vendors cannot cover internally.
Platform vendors amplify partner ecosystems rather than building services in-house to protect gross margins. Adobe added 18% consulting revenue in fiscal 2024 by helping clients operationalize Firefly generative AI features, while Accenture reported 25-35% services growth in its marketing technology practice. End-users view external specialists as insurance against skill shortages, a dynamic that reinforces stickiness because service providers embed themselves deeply in day-to-day operations.


By Deployment: Cloud Dominance Mirrors Hybrid Work Reality
In 2025, cloud-based models dominated with an 82.14% share and are projected to lead the growth race, boasting a 13.39% CAGR through 2031. Elastic scalability supports peak-season traffic without capital overhead, a capability demonstrated during the 2025 holiday promotions, when several retailers tripled outbound volume without throttling. On-premise persists in heavily regulated environments that demand air-gapped security, yet even these sectors experiment with private cloud options that preserve control while unlocking AI modules. Microsoft addresses sovereignty needs with Azure-based sovereign cloud regions, allowing public-sector clients to tap Copilot features without cross-border data exposure.
Feature velocity favors cloud because vendors can push weekly releases, enhance security posture, and deliver pre-built API connectors at scale. Klaviyo rolled out generative content recommendations to its customer base within weeks in 2024, whereas on-premise rivals faced months-long upgrade cycles. Consequently, many organizations treat on-premise as a transitional strategy while modernizing core data systems.
By Organization Size: SMEs Provide Volume While Enterprises Supply Revenue
Small and medium enterprises made up 62.88% of deployments in 2025 and are set to expand at a CAGR of 13.33% through 2031. The marketing automation software market benefits as SMB e-commerce players seek to achieve parity with larger peers in personalization and retention. Mailchimp’s integration with Intuit Assist AI lets micro-businesses align outreach with cash flow, maximizing campaign effectiveness without adding headcount. Meanwhile, large enterprises contribute higher absolute revenue through multi-module contracts exceeding USD 500,000 annually. Multi-touch attribution, account-based orchestration, and advanced consent management underpin enterprise upgrade cycles, positioning vendors like Salesforce and Adobe to upsell industry clouds.
Enterprises also fuel the services subsector because complex CRM, ERP, and data-warehouse landscapes require customization. However, composable architectures and reverse-ETL tooling reduce dependency on monolithic suites, an evolution that could redistribute deal sizes over the next five years.
By Application: Mobile Marketing Captures Attention Shift
Email marketing retained 28.73% revenue share in 2025, thanks to proven ROI, yet mobile marketing is set to outpace all other applications with a 14.79% CAGR. Push notifications yield 7-10% click-through rates, far above email averages, prompting retailers, food-delivery platforms, and gaming apps to triple their mobile engagement budgets. Braze processes over 10 billion mobile messages daily, illustrating scale requirements for event-triggered personalization. Campaign management and lead management remain core modules, but their growth is slower because they have reached maturity in early-adopter sectors. Social media and inbound marketing continue to ascend as Instagram, TikTok, and YouTube converge content and commerce, driving the need for automation of short-form video workflows.
Analytics now emphasizes privacy-compliant multi-touch attribution. Google’s deprecation of third-party cookies heightened the importance of first-party data, driving demand for dashboards that reconcile web, app, and in-store interactions. Vendors embedding real-time insights directly into orchestration workflows command pricing premiums and reduce customer churn.

By End-User Vertical: Healthcare Accelerates on Telehealth Momentum
Retail and e-commerce led spending with 22.49% in 2025 because abandoned cart recovery and loyalty management are automation staples. Nonetheless, healthcare shows the highest growth trajectory, with a 14.73% CAGR through 2031. Telehealth adoption underscores the need for HIPAA-compliant reminders, consent capture, and medication adherence messaging capabilities, now bundled in Salesforce Health Cloud and Microsoft Cloud for Healthcare. BFSI verticals demand PSD2-ready auditing and algorithmic transparency, pushing vendors to supply out-of-the-box consent tooling. Manufacturing still lags due to integration complexity, but early wins in account-based marketing for industrial equipment signal latent potential as API-ready ERPs gain a foothold.
Media and entertainment employ automation for viewer segmentation and recommendation, though top streaming firms often build proprietary engines. Government and education adoption rises slowly due to procurement constraints, yet EU digital learning grants are catalyzing experiments with cloud-based outreach platforms in public universities.
Geography Analysis
North America accounted for 42.38% of revenue in 2025, thanks to vendor concentration and decades of digital marketing maturity, yet new customer growth is slowing as penetration nears saturation. Salesforce exceeded 150,000 customers, and HubSpot crossed 205,000 by late 2024, pushing incumbents to mine for upsell opportunities and to expand into the micro-SMB tier. Canada’s immigration-led tech expansion and generous R&D tax credits nurture challenger vendors that compete aggressively on price and customer support. Mexican manufacturers benefiting from nearshoring enlarge the prospect pool for B2B automation, although language localization and payment rails need refinement.
Asia-Pacific is the fastest-growing region, with a 13.96% CAGR, fueled by India’s SMB digitization, China’s data-sovereignty-driven enterprise cloud migration, and Southeast Asia’s mobile-first consumer habits. Rupee-denominated pricing and subsidized credits under Digital India reduced SaaS adoption costs by up to 25%, thereby expanding the market for marketing automation software among microenterprises. China’s bifurcated landscape sees multinational vendors serving foreign-invested firms, while Alibaba Cloud and Tencent Cloud dominate domestic niches by offering in-country hosting. Japan remains cautious but is shifting as fintech and e-commerce disruptors adopt cloud-native suites backed by AWS and Azure local zones. Australia mirrors U.S. maturity metrics, whereas Southeast Asia’s linguistic and regulatory fragmentation requires heavy localization investment.
Europe’s stricter GDPR enforcement creates both barriers and moats. Platforms with robust consent management win enterprise trust, particularly in automotive, banking, and retail. Southern and Eastern Europe trail Western peers by 30-40% in IT spend as a share of revenue, limiting the pace of adoption. A 23% talent gap among marketing technologists, documented by PwC, elevates implementation costs and favors managed-service models. Middle East deployments are concentrated in the United Arab Emirates and Saudi Arabia under national digital agendas, though SMB adoption outside major urban centers remains modest. Africa’s early market is confined largely to South Africa and Egypt because connectivity and payment infrastructure elsewhere are still maturing. Latin America is led by Brazil and Argentina, where currency volatility complicates USD pricing; vendors offering multi-currency billing reduce friction and gain share.

Competitive Landscape
The marketing automation software market is moderately fragmented. The top five players, Salesforce, HubSpot, Adobe, Oracle, and Microsoft, control roughly 45-50% of 2025 revenue. Ecosystem lock-in from deep integrations across CRM, commerce, and services sustains incumbent share, as switching costs can exceed USD 500,000 for global deployments. However, composable architectures and reverse-ETL tools are lowering entry barriers, enabling enterprises to swap orchestration layers without dismantling data foundations. Generative AI narrows the feature gap, letting mid-market-focused providers like Klaviyo and Braze compete on workflow simplicity and time-to-value.
Vertical specialization is an emergent differentiation path. Healthcare requires audit logs and EHR integration that horizontal platforms often treat as bolt-ons. Braze’s acquisition of Inkit expanded transactional messaging compliance for regulated industries, while Zoho rolled out sector-specific templates to shrink implementation timelines.
Pricing pressure is intensifying. Salesforce Marketing Cloud operating margins fell from 25% in fiscal 2022 to 22% in fiscal 2024 as vendors absorbed AI R&D costs while discounting to secure multi-year renewals. Startups continue to attract venture capital, and ActiveCampaign raised USD 240 million in early 2025 to fund regional expansion and feature parity pursuits. Despite rising consolidation, new entrants leveraging AI for autonomous campaign orchestration continue to surface, keeping market concentration in check.
Marketing Automation Software Industry Leaders
HubSpot, Inc.
Adobe Systems Inc.
Oracle Corporation (Eloqua)
Acoustic L.P.
Salesforce Inc. (Pardot and Marketing Cloud)
- *Disclaimer: Major Players sorted in no particular order

Recent Industry Developments
- November 2025: Salesforce expanded Agentforce with autonomous agents that execute end-to-end campaigns, lowering manual workload by up to 60% for retail and financial-services pilots.
- October 2025: Adobe embedded Firefly generative AI across Experience Cloud, letting marketers create on-brand assets in-workflow and cutting creative timelines by up to 50%.
- September 2025: HubSpot partnered with Google Cloud to embed Vertex AI for predictive scoring and content recommendations while preserving data residency controls.
- July 2025: Microsoft added Copilot-assisted campaign creation in Dynamics 365 Marketing, enabling natural-language prompts to generate audience segments and assets.


Research Methodology Framework and Report Scope
Market Definitions and Key Coverage
According to Mordor Intelligence analysts, our study treats the global marketing automation software market as the universe of licensed or subscription-based platforms and related modules that automatically execute, manage, and analyze repetitive marketing tasks across email, social, web, mobile, and lead-capture channels. The definition includes packaged solutions sold as standalone suites or integrated within CRM stacks that generate recurring software revenue.
Scope Exclusions: We purposely exclude one-off professional services and in-house, custom-built scripts that are not commercially supported.
Segmentation Overview
- By Component
- Software
- Services
- By Deployment
- Cloud-Based
- On-Premise
- By Organization Size
- Large Enterprises
- Small and Medium Enterprises
- By Application
- Campaign Management
- Email Marketing
- Lead Management
- Analytics and Reporting
- Social Media Marketing
- Mobile Marketing
- Inbound Marketing
- Sales Enablement
- Other Applications
- By End-User Vertical
- Banking, financial services and insurance (BFSI)
- Retail and E-Commerce
- IT and Telecom
- Healthcare
- Manufacturing
- Media and Entertainment
- Government
- Education
- Other End-User Verticals
- By Geography
- North America
- United States
- Canada
- Mexico
- Europe
- Germany
- United Kingdom
- France
- Spain
- Rest of Europe
- Asia-Pacific
- China
- Japan
- India
- South Korea
- Australia
- Rest of Asia-Pacific
- Middle East and Africa
- Middle East
- Saudi Arabia
- United Arab Emirates
- Rest of Middle East
- Africa
- South Africa
- Egypt
- Rest of Africa
- Middle East
- South America
- Brazil
- Argentina
- Rest of South America
- North America
Detailed Research Methodology and Data Validation
Primary Research
Our analysts held structured interviews and short surveys with software vendors, digital agencies, and end-user managers across North America, Europe, and Asia Pacific. These conversations clarified average selling prices, churn rates, and adoption triggers, and helped fine-tune assumed pay-as-you-go pricing tiers.
Desk Research
We gathered foundational supply and demand indicators from open reports published by bodies such as the International Telecommunication Union, United States Census Bureau, Eurostat, and the Interactive Advertising Bureau. Company 10-Ks, investor decks, annual SaaS benchmarks, and public procurement data helped us size vendor penetration by region and industry. Access to D&B Hoovers and Dow Jones Factiva provided spend benchmarks and deal news that anchored trend direction. This list is illustrative; many other secondary references supported validation.
Market-Sizing & Forecasting
We started with a top-down reconstruction that scaled global enterprise IT budgets against verified marketing-technology spending ratios, which are then split by automation penetration. Select bottom-up roll-ups of leading vendor revenues, channel checks, and sampled ASP × user counts were used to cross-check totals once and adjust for freemium tiers. Key variables in the model include email volume per firm, cloud marketing spend share, SMB digitalization rates, and regional GDP-per-capita, each projected through a multivariate regression to 2030. Forecast curves were stress tested through scenario analysis to reflect macro slowdowns and privacy regulation shifts.
Data Validation & Update Cycle
Before publication, Mordor analysts run every figure through a three-level review; anomaly flags trigger re-contact with sources, and material news events prompt interim refreshes. Our dashboards are revisited annually, so clients always receive an updated baseline.
Why Mordor's Marketing Automation Software Baseline Commands Reliability
Published estimates rarely agree because firms differ on what revenue streams count, how fast cloud adoption grows, and which currencies anchor their base year. Mordor Intelligence applies a disciplined scope, yearly refresh cadence, and pricing realignment that keep its totals reproducible.
Key gap drivers include inclusion of professional services, use of aggressive seat-expansion ratios, or outdated vendor lists. Where others inflate totals by blending broader digital-experience spending, we limit inputs to pure-play automation software and reconcile every assumption with live interviews.
Benchmark comparison
| Market Size | Anonymized source | Primary gap driver |
|---|---|---|
| USD 7.23 B | Mordor Intelligence | - |
| USD 7.39 B | Global Consultancy A | Counts managed services as software licensing |
| USD 7.46 B | Industry Journal B | Applies uniform 20 percent price uplift across regions |
| USD 47.02 B | Global Consultancy C | Bundles email infrastructure and customer-data platforms into scope |
These contrasts show that our carefully delimited scope, transparent variables, and annual reviews deliver a balanced starting point decision makers can trust.


Key Questions Answered in the Report
How fast is the marketing automation software market expected to grow through 2031?
The market is projected to advance at a 12.92% CAGR, reaching USD 14.98 billion by 2031.
Which deployment model dominates current implementations?
Cloud installations captured 82.14% share in 2025 and will continue expanding because hybrid work favors elastic, always-updated platforms.
Why is mobile marketing a key growth application?
Push notifications and in-app messaging deliver 7-10% click-through rates, significantly higher than email, driving a 14.79% CAGR for mobile marketing modules.
What restrains adoption in heavy-industry manufacturing?
Integration overheads with legacy ERP systems can consume up to 30% of MarTech budgets, delaying ROI and slowing platform rollouts.
Which geography offers the fastest expansion opportunity?
Asia-Pacific is forecast to grow at a 13.96% CAGR, propelled by SMB cloud adoption in India, Indonesia, Vietnam, and the Philippines.
How concentrated is vendor competition?
The top five suppliers control about 45-50% of revenue, indicating moderate concentration with ample room for niche and regional challengers.
Page last updated on:


