United States Virtual Reality Market Size and Share
Market Overview
| Study Period | 2019 - 2030 |
|---|---|
| Forecast Data Period | 2025 - 2030 |
| Historical Data Period | 2019 - 2023 |
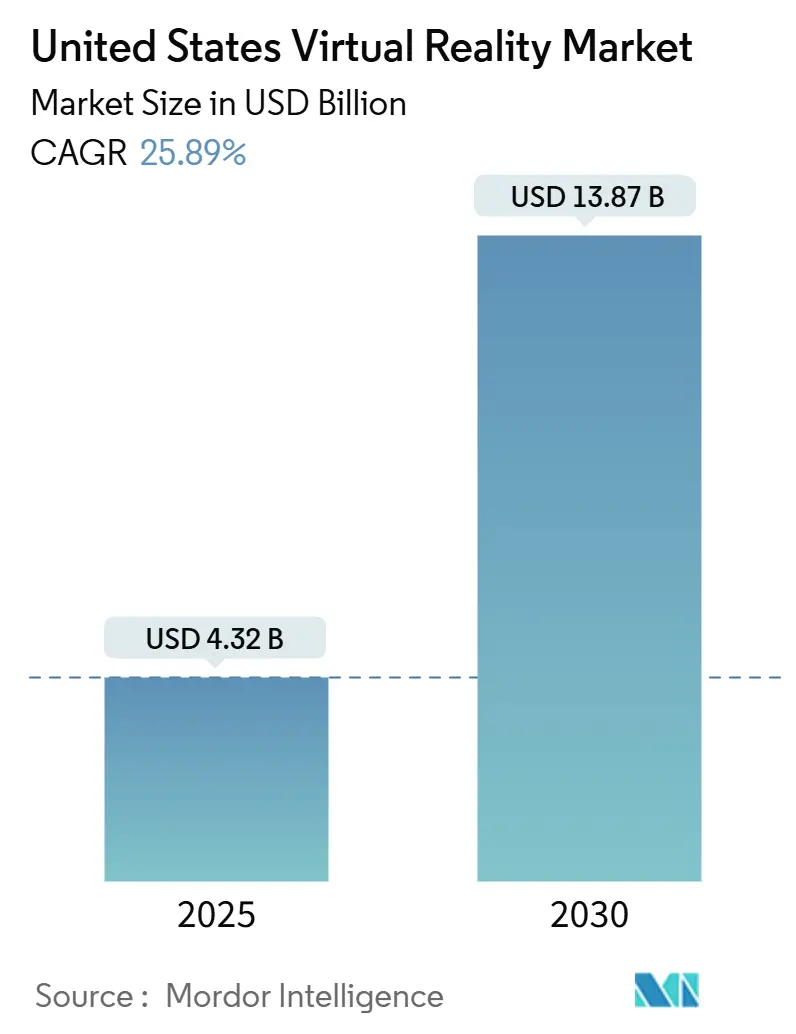
| Market Size (2025) | USD 4.32 Billion |
| Market Size (2030) | USD 13.87 Billion |
| Growth Rate (2025 - 2030) | 25.89% CAGR |
| Market Concentration | High |
Major Players *Disclaimer: Major Players sorted in no particular order Image © Mordor Intelligence. Reuse requires attribution under CC BY 4.0. | |
United States Virtual Reality Market Analysis by Mordor Intelligence
The United States Virtual Reality market size reached USD 4.32 billion in 2025 and is projected to grow to USD 13.87 billion by 2030, reflecting a 25.89% CAGR. Enterprise demand for immersive training, falling headset prices below USD 300, expanding 5G coverage, and supportive federal tele-health reimbursement converge to accelerate adoption across both consumer and professional settings. Hardware continues to generate the bulk of revenue, but managed services, content licensing, and cloud rendering now outpace physical unit growth as businesses seek recurring value. Regional concentration in California’s technology corridor remains strong, yet defense procurement and multi-site corporate roll-outs distribute deployments across the Midwest, South, and Northeast. Semiconductor supply constraints for micro-OLED displays, motion-sickness concerns, and premium device costs moderate the near-term trajectory but have not derailed long-run optimism for the US Virtual Reality market.
Key Report Takeaways
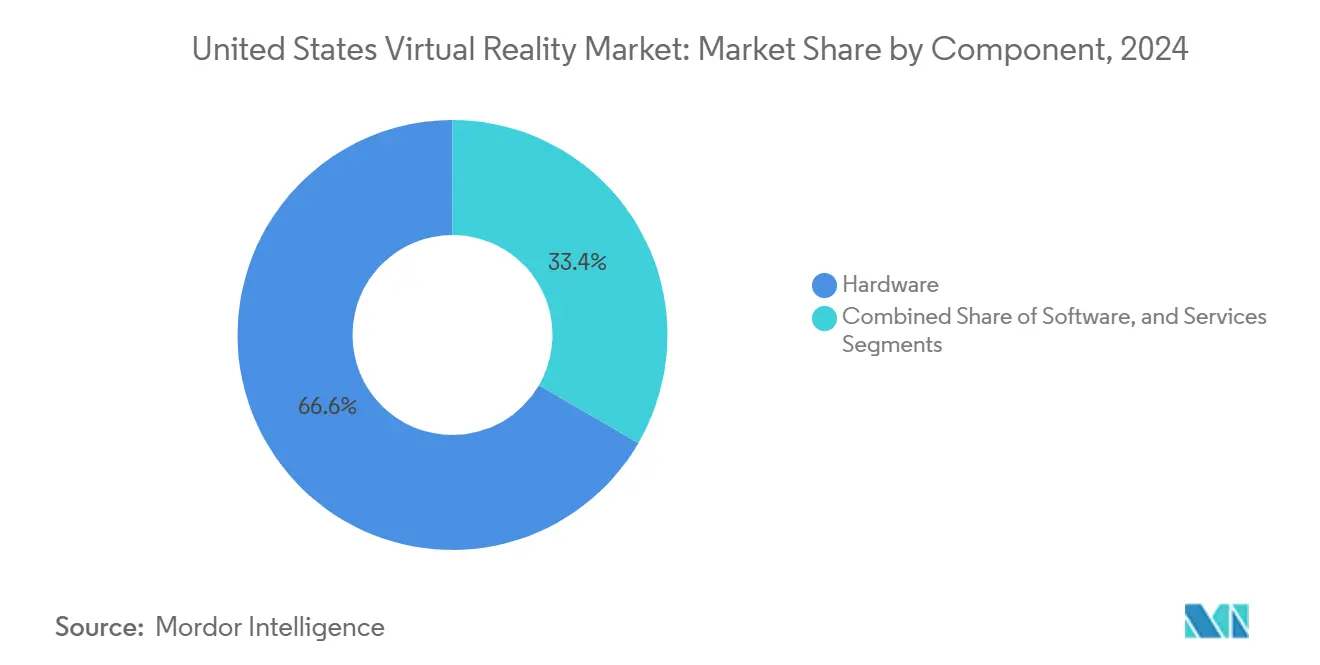
- By component, hardware led with 66.63% share of the US Virtual Reality market size in 2024, while services is forecast to expand at a 27.33% CAGR through 2030.
- By device type, standalone headsets captured 55.83% of US Virtual Reality market share in 2024; smartphone-powered VR is projected to record the highest 26.66% CAGR to 2030.
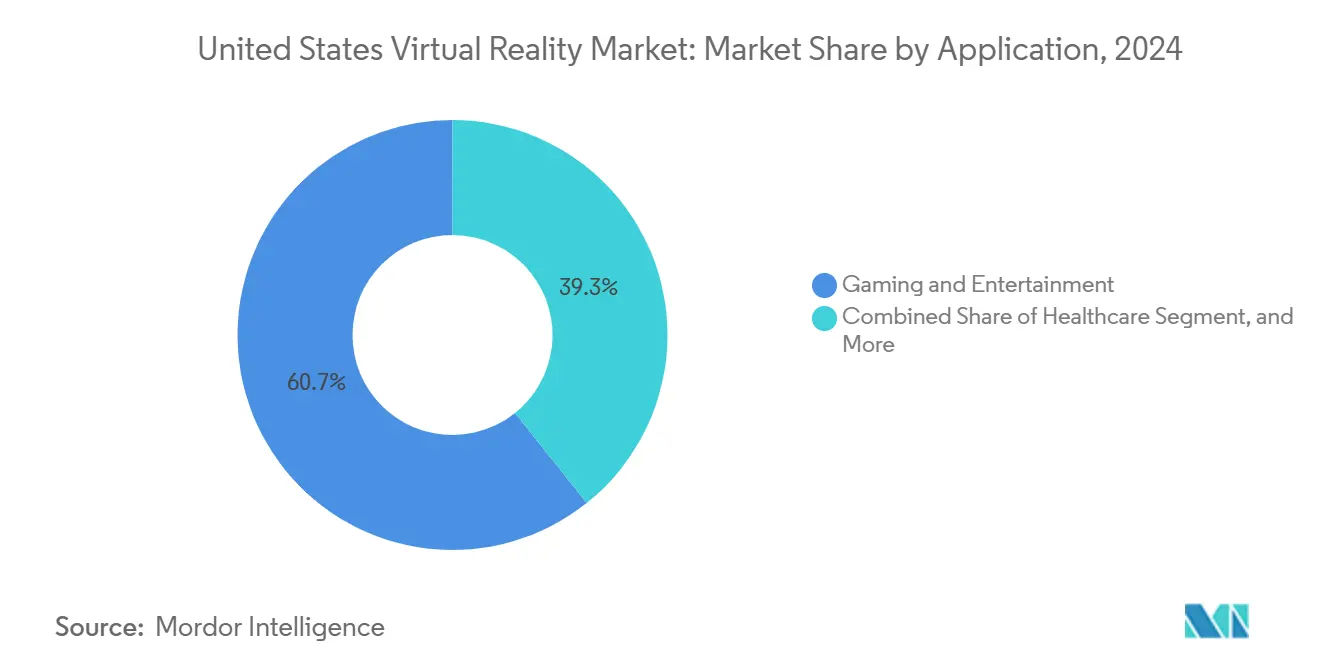
- By application, gaming and entertainment accounted for 60.73% of the US Virtual Reality market size in 2024, whereas healthcare is advancing at a 26.88% CAGR through 2030.
- By end user, consumer adoption represented 68.62% of total spending in 2024 in the US Virtual Reality market share, while enterprise use cases are expected to rise at a 27.55% CAGR between 2025 and 2030.
Worldwide, activity is shaped by contributions from multiple countries and regions, with United states representing one among them. The global report on virtual reality (vr) market by Mordor Intelligence reflects how these countries and regional layers combine into a single system.
United States Virtual Reality Market Trends and Insights
Drivers Impact Analysis*
| Driver | (~) % Impact on CAGR Forecast | Geographic Relevance | Impact Timeline |
|---|---|---|---|
| Explosion of affordable standalone headsets | +4.2% | Global, with early gains in California, Texas, New York | Short term (≤ 2 years) |
| 5G and edge-rendered cloud VR lowering latency | +3.8% | APAC core, spill-over to North America urban centers | Medium term (2-4 years) |
| Growing enterprise spending on immersive training | +5.1% | North America and EU corporate hubs | Medium term (2-4 years) |
| Generative-AI pipelines slashing 3-D content cost | +4.7% | Global, concentrated in tech innovation centers | Short term (≤ 2 years) |
| Federal tele-health reimbursement for therapeutic VR | +2.9% | National, with early gains in healthcare-dense regions | Long term (≥ 4 years) |
| Live-sports and concert rights packaging in VR | +3.3% | North America entertainment markets | Medium term (2-4 years) |
| Source: Mordor Intelligence | |||
Explosion of Affordable Standalone Headsets
Meta introduced Quest 3S at USD 299 in 2024, lowering the entry barrier for both consumers and corporate buyers.[1]Andrew Bosworth, “Quest 3S Launch Announcement,” Meta Blog, meta.com UPS documented a 75% cut in facility training time after deploying Quest headsets for package-handler instruction.[2]United Parcel Service, “Virtual Reality Training Cuts Package-Handler Prep Time,” ups.com Samsung’s Galaxy XR, announced at USD 1,799, targets a mid-premium niche between Meta’s high-volume strategy and Apple’s Vision Pro at USD 3,499. Untethered designs remove the PC requirement, enabling mobile safety drills on shop floors and field sites. Qualcomm’s Snapdragon XR2+ Gen 2 chipset boosts rendering performance 2.5-fold over the prior generation, delivering console-grade visuals in portable form factors. Streamlined FDA pathways for standalone therapeutic devices further expand addressable healthcare use cases.
Growing Enterprise Spending on Immersive Training
Intel reported a 300% five-year ROI from factory-floor VR instruction that reduced accidents and sped skills transfer.[3]Microsoft Corporation, “Mixed Reality Total Economic Impact,” microsoft.com Pfizer installed 800+ headsets across vaccine lines, trimming new-employee onboarding by 40%. The Department of Homeland Security found 89% of first-responder agencies plan to introduce VR drills within two years. Microsoft cited a 216% return for mixed-reality deployments in heavy-equipment maintenance, with USD 14.62 million net present value per 1,000-unit roll-out. Regulatory frameworks in aviation and healthcare favor standardized, simulation-based certification, accelerating enterprise budget allocation to VR programs.
5G and Edge-Rendered Cloud VR Lowering Latency
Network infrastructure advances enable cloud-rendered VR experiences that eliminate device processing constraints, with 5G networks achieving sub-20 millisecond latency required for seamless immersive applications while edge computing nodes reduce data transmission distances by up to 75%. Verizon's 5G Ultra Wideband deployment covers 230 million Americans as of 2024, supporting enterprise VR applications that previously required dedicated high-performance computing infrastructure costing USD 10,000 - USD50,000 per deployment.
Generative-AI Pipelines Slashing 3-D Content Cost
Artificial intelligence content generation reduces VR development costs by 60-80% through automated 3D asset creation, texture synthesis, and environment modeling that previously required specialized artists commanding USD 75,000 - USD 150,000 annual salaries. NVIDIA's Omniverse platform integrates AI-powered content creation tools that enable real-time collaboration between distributed development teams while automatically generating photorealistic materials and lighting configurations from simple text prompts. Meta's AI-assisted content pipeline supports Quest developers through automated optimization, cross-platform compatibility testing, and performance profiling that reduces time-to-market by 40-60% for enterprise VR applications.
Restraints Impact Analysis*
| Restraint | (~) % Impact on CAGR Forecast | Geographic Relevance | Impact Timeline |
|---|---|---|---|
| High total cost of ownership for premium HMDs | -2.8% | Global, particularly affecting SME adoption | Short term (≤ 2 years) |
| Motion-sickness and hygiene concerns in shared devices | -1.9% | Global, with higher impact in shared-use scenarios | Medium term (2-4 years) |
| Fragmented developer tool-chain and standards | -2.3% | Global, concentrated in development centers | Long term (≥ 4 years) |
| Semiconductor supply risk for micro-OLED displays | -1.6% | Global, with Asia-Pacific supply concentration | Medium term (2-4 years) |
| Source: Mordor Intelligence | |||
High Total Cost of Ownership for Premium HMDs
Apple Vision Pro’s USD 3,499 sticker sets a steep hurdle for smaller firms, and ancillary software plus hygiene consumables can lift lifecycle cost above USD 5,000 per seat. Microsoft HoloLens 2 pricing mirrors that range and adds annual cloud-service fees. Insurance carriers now mandate sanitation protocols, lengthening device turnover time and inflating labor expense. Small businesses lacking in-house IT often outsource support, pushing ownership costs beyond hardware alone. In healthcare, FDA documentation and validation can add USD 50,000–100,000 to project budgets, delaying breakeven timelines for providers.
Motion-Sickness and Hygiene Concerns in Shared Devices
Stanford research shows 15.6% of users abandon VR sessions due to nausea, and early exposure discomfort affects up to 80%, especially among women. Post-COVID hygiene expectations require alcohol-resistant face cushions and UV-C boxes between users, adding consumable and equipment spend. Patients with vestibular disorders or certain medications face elevated cybersickness risk, limiting therapeutic reach. Corporations report that 20–30% of trainees need multiple acclimation rounds, elongating program schedules. ISO committees are drafting ergonomic norms, but the absence of unified global standards complicates compliance for multinationals.
*Our forecasts treat driver/restraint impacts as directional, not additive. The impact forecasts reflect baseline growth, mix effects, and variable interactions.
Segment Analysis
By Component: Services Accelerate Despite Hardware Dominance
Hardware retained 66.63% of the US Virtual Reality market in 2024 as Meta and Apple shipped high-volume headsets; however, services are forecast to grow at a 27.33% CAGR by 2030, signaling a pivot toward subscription and support revenue. Meta’s Quest for Business bundle, covering device management and custom content, produced USD 1.2 billion in 2024 non-hardware revenue.
Enterprises favor outsourced content creation, regulatory consulting, and multi-tenant device portals to minimize internal overhead, propelling managed-service providers. Healthcare remains the premium niche: therapeutic software validation, patient monitoring, and compliance auditing sustain high billable rates. As engagement metrics migrate from unit sales to monthly active users, the US Virtual Reality market size increasingly reflects annuity-style billing rather than one-off device purchases.


By Device Type: Smartphone VR Surges While Standalone Leads
Standalone units delivered 55.83% of device shipments in 2024, establishing them as the anchor of the US Virtual Reality market. Smartphone-powered head-mounted displays, however, are tracking a 26.66% CAGR on the back of pre-existing handset bases and district-wide education pilots in Texas and Florida.
Apple’s ecosystem tie-ins let Vision Pro relay content seamlessly across iPhone and Mac, reinforcing cross-device stickiness. Google and Samsung’s Android-XR partnership promises a parallel open-architecture alternative. Tethered PC rigs remain essential for high-fidelity design review in aerospace and automotive workflows but surrender share to more portable formats. ISO battery-safety guidelines and Qualcomm’s silicon roadmap, which serves both mobile and standalone segments, streamline developer support, easing fragmentation concerns.
By Application: Healthcare Breakthrough Challenges Gaming Dominance
Gaming retained 60.73% of 2024 spending, yet FDA clearance of 69 therapeutic devices by September 2024 established healthcare as the fastest-growing vertical at 26.88% CAGR. Virtual pain-distraction modules, cognitive-behavioral therapy, and remote physical rehabilitation continue to secure coverage under updated CMS codes.
Veterans Affairs pilots illustrate PTSD symptom reduction on par with traditional methods, and hospital chains in New York deploy VR for orthopedic rehab, cutting nurse visits per patient. Retail uses virtual showrooms to shrink returns, while the Department of Homeland Security replicates hazardous scenarios for first-responder drills, underscoring versatility. As cloud rendering matures, photorealistic medical imaging becomes possible on lightweight devices, compressing modality costs.
By End User: Enterprise Acceleration Challenges Consumer Base
Consumers held 68.62% of spend in 2024 through gaming and social-VR titles, but enterprise budgets are expanding at a 27.55% CAGR. Pfizer’s production-line deployment shortened new-hire ramp-up 40%, while ExxonMobil leverages immersive simulations for refinery safety exercises.
The US Army’s Integrated Visual Augmentation System contract funnels bulk procurement to Microsoft, anchoring defense demand. Education boards in California adopt virtual field trips to support STEM curricula without travel costs. Healthcare providers, buoyed by reimbursement and clinical evidence, procure higher-spec devices for treatment and surgical rehearsal. As ROI proofs accumulate, the US Virtual Reality market attracts line-item allocations in IT, HR, and operations budgets that once belonged solely to consumer entertainment.
Geography Analysis
California’s innovation belt accounted for about 45% of 2024 headset shipments and remains the decision-making nucleus for platform architecture. Yet its 23.8% forecast CAGR trails national averages as saturation tempers incremental growth. New York and Massachusetts concentrate financial-services, education, and hospital systems keen on VR collaboration, contributing steady high-value demand.
The South is the breakout region at a 28.2% CAGR, propelled by Texas oil-and-gas safety training, Florida aerospace prototyping, and North Carolina clinical-trial hubs. Lower facility costs attract start-ups to Austin and Raleigh, diffusing the developer base of the US Virtual Reality market. Midwestern automotive and machinery clusters adopt immersive design reviews to pare prototype iterations, citing cost savings on physical mock-ups.
Federal broadband dollars under the BEAD program extend high-speed connectivity to rural communities, allowing schools in Kansas and healthcare networks in Montana to pilot cloud-rendered VR. Defense contracts distribute along base locations, injecting procurement dollars into Colorado, Georgia, and Virginia. Divergent state incentive programs, ranging from R&D tax credits to workforce grants, shape corporate site-selection, but uniform FDA rules ensure medical deployments maintain national compliance consistency.
Competitive Landscape
Five vendors, Meta, Apple, Microsoft, Samsung, and Google, collectively held more than 90% of the 2024 US shipments, underscoring an oligopolistic posture. Meta leverages a subsidized hardware model to grow software revenue, while Apple pursues a premium margin through the vertical integration of silicon, optics, and services. Microsoft aligns with the defense and industrial segments through the integration of HoloLens and Azure cloud services. Samsung’s forthcoming Galaxy XR relies on its display and handset supply chain, while Google supplies the open-ecosystem OS layer.
Patent depth and standards-body seats act as competitive moats, limiting the disruption of low-cost entrants. Nevertheless, white-space remains around mid-market enterprises seeking sub-USD 1,000 total installation pricing, healthcare suppliers requiring bespoke regulatory support, and K-12 institutions constrained by per-student budgets. Generative AI toolkits reduce 3D asset creation costs by up to 80%, enabling smaller studios to launch compelling content libraries.
Supply-side risks center on micro-OLED fabrication, primarily located in Asia, with a limited producer roster, leading to potential price volatility. Vendors hedge through multi-sourcing: Microsoft negotiates display deals with Samsung, and Apple is rumored to explore domestic pilot lines. As 5G eliminates tethering latency, cloud-native rendering could tilt value capture from device makers to service providers, reshaping bargaining power over the next cycle.
United States Virtual Reality Industry Leaders
Meta Platforms, Inc.
Apple Inc.
Sony Group Corporation
Microsoft Corporation
Alphabet Inc.
- *Disclaimer: Major Players sorted in no particular order


Recent Industry Developments
- January 2025: CES unveiled Samsung Galaxy XR pricing at USD 1,799 alongside Sony display partnerships.
- November 2024: Magic Leap secured USD 160 million to scale enterprise AR/VR solutions.
- October 2024: Apple confirmed enterprise roll-outs of Vision Pro at Walmart, Nike, and Strivr, validating premium positioning.
- October 2024: Vuzix landed a USD 20 million strategic investment for smart-glasses R&D.


United States Virtual Reality Market Report Scope
| Hardware |
| Software |
| Services |
| Standalone VR Headsets |
| Tethered PC/Console VR Headsets |
| Smartphone-based VR |
| VR Peripherals and Accessories |
| Gaming and Entertainment |
| Healthcare |
| Education and Training |
| Industrial and Manufacturing |
| Retail and E-commerce |
| Other Applications |
| Consumer |
| Enterprise |
| Healthcare Providers |
| Educational Institutions |
| Government and Defense |
| Other End Users |
| By Component | Hardware |
| Software | |
| Services | |
| By Device Type | Standalone VR Headsets |
| Tethered PC/Console VR Headsets | |
| Smartphone-based VR | |
| VR Peripherals and Accessories | |
| By Application | Gaming and Entertainment |
| Healthcare | |
| Education and Training | |
| Industrial and Manufacturing | |
| Retail and E-commerce | |
| Other Applications | |
| By End User | Consumer |
| Enterprise | |
| Healthcare Providers | |
| Educational Institutions | |
| Government and Defense | |
| Other End Users |


Key Questions Answered in the Report
How large is U.S. virtual-reality spending in 2025 and what is its growth outlook to 2030?
Total outlays reached USD 4.32 billion in 2025 and are on track to climb to USD 13.87 billion by 2030, reflecting a 25.89% CAGR.
Which headset category currently enjoys the widest adoption among U.S. users?
Standalone devices such as Meta Quest models held 55.83% of 2024 shipments, thanks to sub-USD 300 pricing and untethered mobility.
What return on investment are enterprises realizing from immersive training?
Meta Quest deployments delivered a 219% ROI and USD 4.2 million net present value over three years, while Intel logged a 300% ROI across five years of factory-safety programs.
Why is healthcare emerging as the fastest-growing application for VR?
Forty-nine FDA-cleared therapeutic devices and new CMS reimbursement codes are driving a 26.88% CAGR for clinical use, covering pain management, rehabilitation, and mental-health therapies.
Who are the leading headset suppliers in the United States?
Meta, Apple, Microsoft, Samsung, and Google together shipped more than 90% of U.S. units in 2024, underscoring a highly concentrated vendor landscape.
Page last updated on:


