Virtual, Augmented and Mixed Reality (VR/AR) Market Size and Share
Market Overview
| Study Period | 2020 - 2031 |
|---|---|
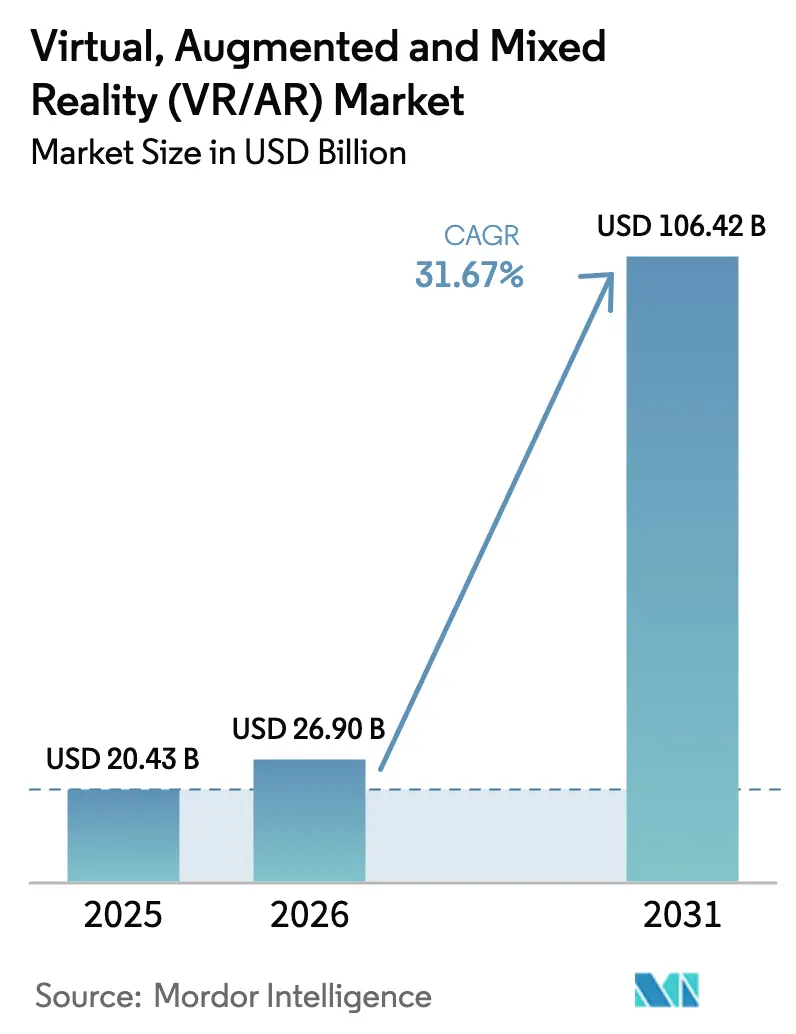
| Market Size (2026) | USD 26.90 Billion |
| Market Size (2031) | USD 106.42 Billion |
| Growth Rate (2026 - 2031) | 31.67% CAGR |
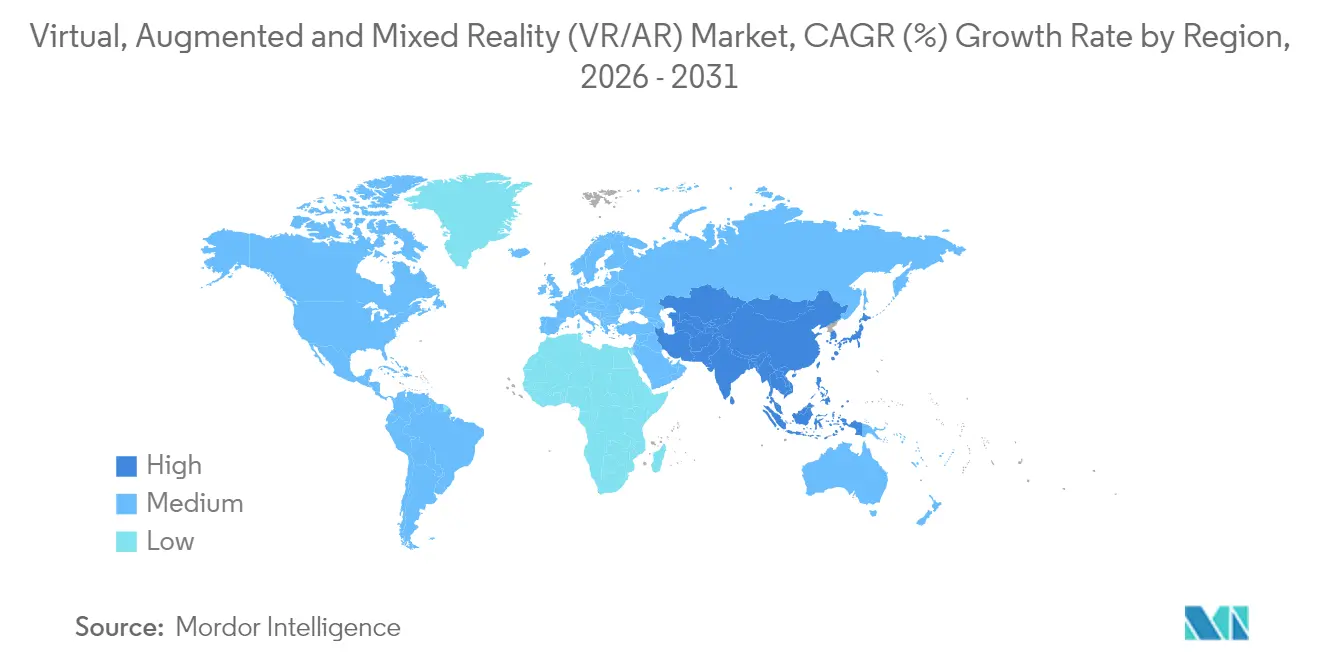
| Fastest Growing Market | Asia Pacific |
| Largest Market | North America |
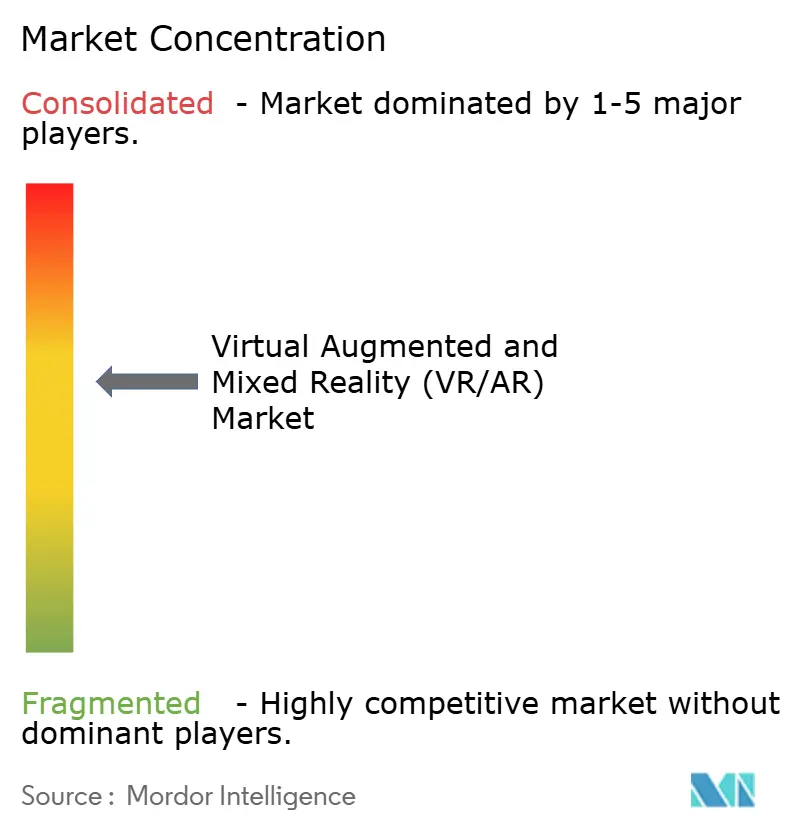
| Market Concentration | Medium |
Major Players
*Disclaimer: Major Players sorted in no particular order Image © Mordor Intelligence. Reuse requires attribution under CC BY 4.0. |
|
Virtual, Augmented and Mixed Reality (VR/AR) Market Analysis by Mordor Intelligence
The Virtual Augmented And Mixed Reality Market size was valued at USD 20.43 billion in 2025 and estimated to grow from USD 26.9 billion in 2026 to reach USD 106.42 billion by 2031, at a CAGR of 31.67% during the forecast period (2026-2031).
The surge reflects wide-ranging adoption across healthcare, manufacturing, retail and other enterprise settings, supported by 5G roll-outs, edge computing nodes and open-source development frameworks that reduce latency, improve scalability and cut time-to-MVP. Hardware innovation is shifting toward lighter headsets and smart glasses, while services growth signals a structural pivot to cloud rendering and managed XR platforms. Competitive dynamics show platform ecosystems consolidating influence even as specialist vendors carve out domain-specific beachheads. Regional momentum is led by North America’s installed base yet Asia-Pacific’s policy support and manufacturing depth point to faster long-term expansion.
Key Report Takeaways
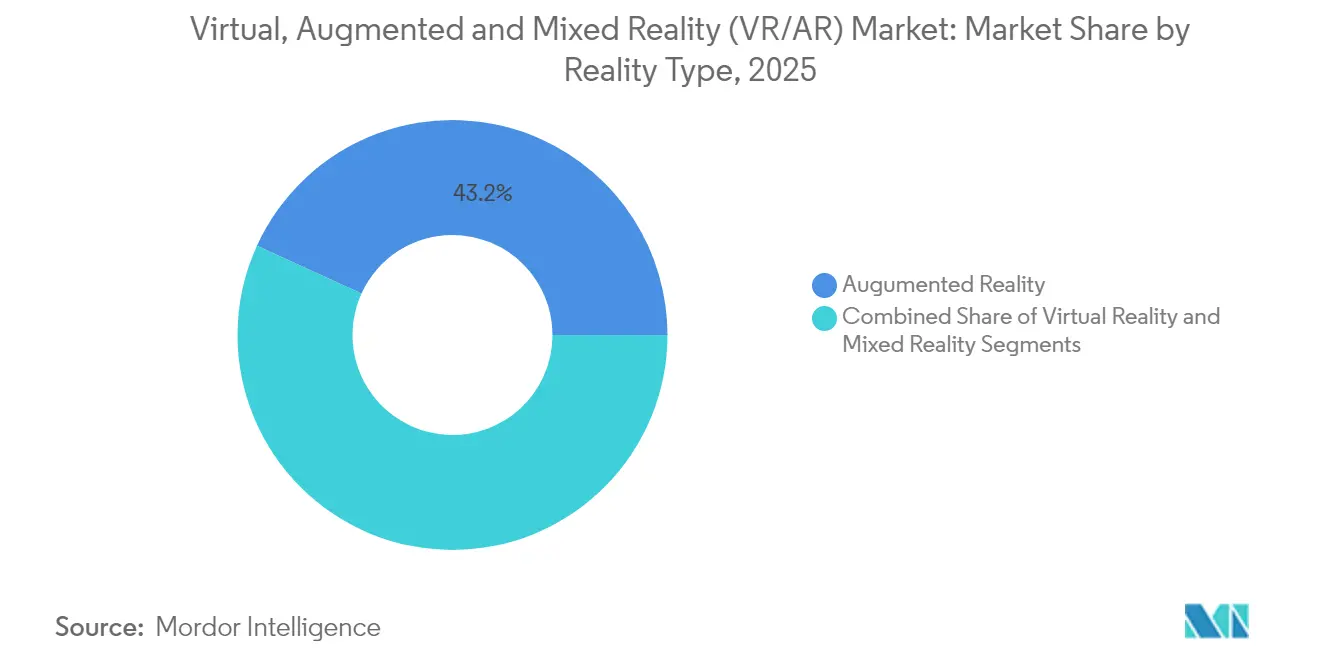
- By reality type, Augmented Reality led with 43.18% of the Virtual, Augmented and Mixed Reality market share in 2025, while Mixed Reality is on track for the fastest 33.69% CAGR to 2031.
- By component, hardware held 56.05% share of the Virtual, Augmented and Mixed Reality market size in 2025; services are forecast to expand at a 36.46% CAGR through 2031.
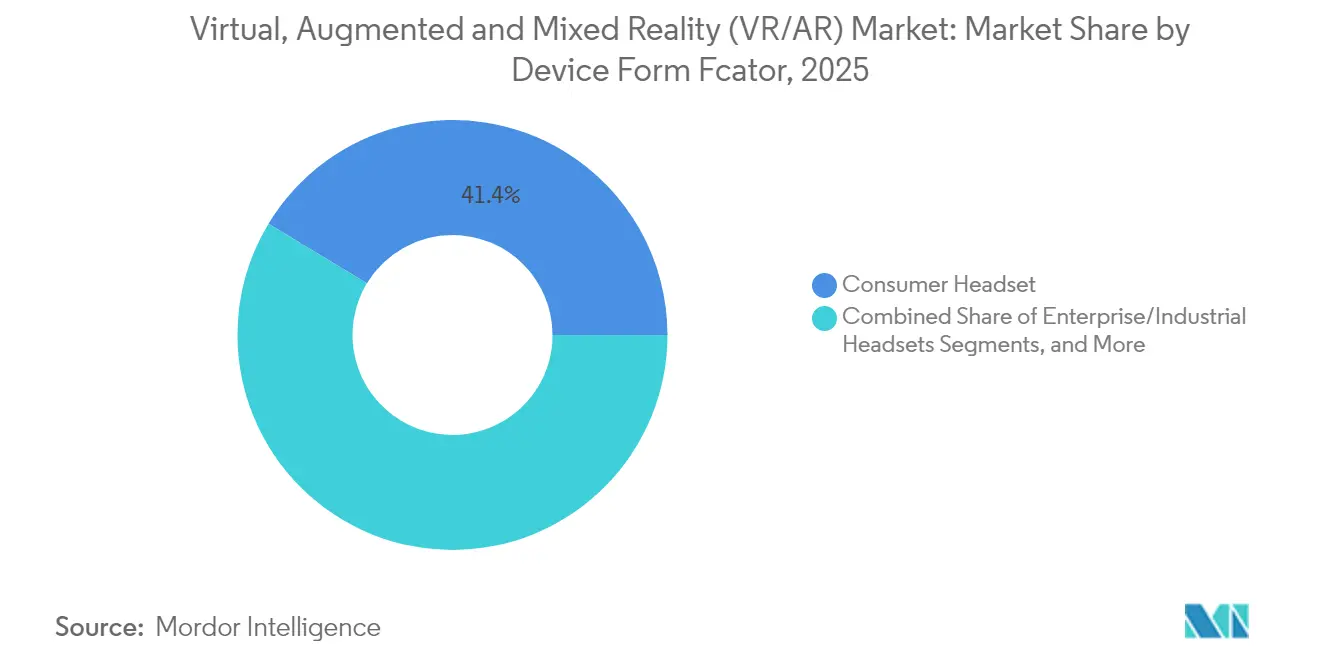
- By device form factor, consumer headsets commanded 41.35% of 2025 revenue, whereas smart glasses are set to grow at a 30.95% CAGR.
- By end-user industry, gaming and e-sports contributed 37.85% of 2025 revenue; healthcare is projected to rise at a 33.29% CAGR to 2031.
- By geography, North America retained 27.45% share in 2025, but Asia-Pacific is projected to register a 34.57% CAGR through 2031.
Note: Market size and forecast figures in this report are generated using Mordor Intelligence’s proprietary estimation framework, updated with the latest available data and insights as of 2026.
Global Virtual, Augmented and Mixed Reality (VR/AR) Market Trends and Insights
Drivers Impact Analysis*
| Driver | (~) % Impact on CAGR Forecast | Geographic Relevance | Impact Timeline |
|---|---|---|---|
| Explosive gaming and e-sports adoption | +8.2% | Global, with concentration in North America and Asia-Pacific | Medium term (2-4 years) |
| Enterprise training and remote-assist roll-outs | +7.5% | North America and EU, expanding to Asia-Pacific | Long term (≥ 4 years) |
| 5G/edge networks enabling low-latency XR streaming | +6.8% | Asia-Pacific core, spill-over to North America and EU | Medium term (2-4 years) |
| Open-source XR dev-kits cutting time-to-MVP | +4.1% | Global | Short term (≤ 2 years) |
| Industrial digital-twin maintenance workflows | +3.9% | North America and EU, emerging in Asia-Pacific | Long term (≥ 4 years) |
| Government metaverse RandD incentives (KR, CN) | +2.7% | Asia-Pacific, with policy spillover effects globally | Medium term (2-4 years) |
| Source: Mordor Intelligence | |||


Explosive Gaming and E-Sports Adoption
Gaming remains the anchor of the Virtual, Augmented and Mixed Reality market, yet the pivot toward e-sports and socially networked game worlds is broadening user bases and session lengths. Meta shipped record volumes of Quest-series headsets in 2024, validating demand for mid-priced all-in-one devices as content franchises scale on live-service models. AI-enabled coaching modules integrated into VR titles are delivering double-digit performance gains for professional teams, underlining a pathway from consumer leisure to high-performance training. Investor appetite is sustained, illustrated by multimillion-dollar studio financings aimed at cross-platform launches targeting North American audiences. The segment’s evolution is expected to lift average revenue per user as premium tournaments, in-game merchandising and ad-supported spectator modes mature.
Enterprise Training and Remote-Assist Roll-outs
Corporations in the Virtual Augmented And Mixed Reality (VR/AR) Market migrating from isolated pilots to fleet-scale XR deployments as measurable returns crystallize. Medical institutions report a two-thirds reduction in surgical training time after adopting simulators from vendors such as Osso VR . Industrial leaders including Siemens have recorded 13% higher certification pass rates after converting safety modules to immersive formats, while chemical producer BASF leverages digital simulators to address skills gaps on shop floors. Adoption is reinforced by tele-proctoring, allowing expert mentors to guide remote procedures, cutting travel overheads and extending specialist reach. Longer session retention—documented at 80% one-year knowledge recall when digital twins are deployed—positions XR as an asset for regulated industries where error tolerance is low and compliance auditing is strict.
5G / Edge Networks Enabling Low-Latency XR Streaming
Commercial 5G roll-outs and metro-edge data centers now support cloud-rendered XR streams with sub-20 millisecond latency, reducing headset weight and cost while unlocking compute-heavy visuals. In manufacturing, digital-twin models streamed over 5G are synchronizing remote design teams in real time, compressing iteration cycles.[1]Verizon,"Verizon develops new 5G edge technology that will revolutionize mobility for virtual reality (VR),: verizon.com Healthcare pilots demonstrate cross-border telesurgery guidance, stitching live holographic feeds into operating theaters. AI inference at the edge further tunes bit-rates and object fidelity based on session analytics, sustaining quality under variable bandwidth. The remaining constraint is uneven rural coverage, which continues to limit use cases outside dense urban corridors.
Open-Source XR Dev-Kits Cutting Time-to-MVP
In the Virtual Augmented and Mixed Reality market, community-driven frameworks and permissive engine licensing are shrinking development cycles and broadening contributor pools. Unity’s 2025 engine upgrade expands native support for Meta Quest and large Android screens while embedding generative-AI assistants that automate environment creation. Third-party hardware vendors, including ASUS and Lenovo, have adopted Meta’s Horizon OS, reducing fragmentation and encouraging multi-brand ecosystems. The deployment of mixed reality-capable processing units reaches mainstream adoption through Qualcomm's Snapdragon XR2+ Gen 2 platform, which delivers 4.3K resolution per eye and supports 12 concurrent cameras for spatial computing applications'.[2]Qualcomm ,"Qualcomm Accelerates New Wave of Mixed Reality Experiences with Snapdragon XR2+ Gen 2," qualcomm.com
Restraints Impact Analysis*
| Restraint | (~)% Impact on CAGR Forecast | Geographic Relevance | Impact Timeline |
|---|---|---|---|
| Health and ergonomic concerns | -4.3% | Global, heightened in EU and North America | Long term (≥ 4 years) |
| High device price-performance gap | -6.7% | Global, affecting consumer adoption in emerging economies | Medium term (2-4 years) |
| Cyber-security and data-privacy exposure | -2.8% | Global, with stricter regulations in EU | Medium term (2-4 years) |
| Critical-material supply-chain risk | -3.2% | Global, acute for hardware assemblers | Long term (≥ 4 years) |
| Source: Mordor Intelligence | |||
Health and Ergonomic Concerns
Extended headset wear still raises fatigue, vision strain and posture issues that discourage long sessions in professional settings. Academic trials in dental education underscore the need for session-length guidelines to guard against overexertion. Chip makers are patenting biometric monitoring to auto-throttle workloads when fatigue indicators arise, yet standard-setting bodies have not issued unified exposure limits. Premium devices offer superior optics but may weigh more than 600 grams, creating trade-offs between clarity and comfort. Liability considerations push enterprises to mandate shorter rotations, sometimes offsetting productivity gains promised by immersive training.[3]U.S Department of Health and Human Services ,"21 CFR 890.5800 -- Virtual reality behavioral therapy device for pain relief", ecfr.gov
High Device Price-Performance Gap
Premium mixed-reality headsets retail above USD 3,000 while entry-level models dip below USD 300, producing a bifurcated market that slows mainstream uptake. Public filings show Apple’s Vision Pro bill of materials near USD 1,590, highlighting thin margins for rivals lacking vertical integration. Consumer pushback forced some vendors to pause production runs when inventory outpaced demand. Conversely, value-priced SKUs demonstrate that price reduction alone is insufficient without compelling content portfolios that signal everyday utility. As services and cloud rendering absorb more processing, future bill of materials may fall, yet optics, battery chemistry and rare-earth magnets will keep costs above smartphone baselines for the foreseeable term.
*Our forecasts treat driver/restraint impacts as directional, not additive. The impact forecasts reflect baseline growth, mix effects, and variable interactions.
Segment Analysis
By Reality Type: Augmented Reality Dominance Faces Mixed Reality Disruption
Augmented Reality commanded 43.18% of 2025 revenue, reinforcing its role in overlaying contextual data onto physical workflows, from retail try-ons to assembly line guidance. The Virtual, Augmented and Mixed Reality market continues to favor AR for quick ROI in maintenance, navigation and remote inspection scenarios. Retailers deploying AR mirrors report reduced return rates and higher conversion. In parallel, Mixed Reality is forecast to expand at a 33.69% CAGR, qualifying as the fastest-growing modality. Hospitals are piloting MR surgical guidance that blends tactile view with holographic overlays, narrowing the gap between visualization and action. Developers see MR as bridging pure VR immersion and AR convenience, a middle path that broadens audience reach without deep hardware trade-offs.
Mixed Reality’s momentum rests on lighter pass-through cameras and spatial-mapping algorithms refined by AI co-processors. The Virtual, Augmented and Mixed Reality market size for MR applications is projected to quadruple by 2030, providing vendors with volume to amortize R&D spending. Virtual Reality maintains a loyal gaming base but faces slower unit growth as competitive devices promote hybrid features. Overall, reality-type diversification signals a shift from one-size-fits-all hardware toward situational form factors


By Component: Hardware Leadership Challenged by Services Acceleration
Hardware captured 56.05% of 2025 revenue, reflecting high ticket prices for headsets, sensors and optical modules. Despite this dominance, managed services, cloud rendering and analytics are predicted to rise at a 36.46% CAGR, the highest among components. Enterprises moving beyond proof-of-concepts are outsourcing device fleets, content updates and security patches to specialist providers. The Virtual, Augmented and Mixed Reality market size allocated to service contracts is set to overtake software licensing by 2028 as outcome-based pricing gains traction.
Software engines remain critical but are gradually abstracted behind no-code dashboards and AI-assisted creator tools. Hardware margins compress when generic chipsets meet commoditized optics, shifting profit pools to subscription dashboards that monitor utilization and training efficacy. Analytics platforms integrated by vendors such as ArborXR feed dashboards with session-level KPIs that link headset deployment to workforce productivity, sharpening CFO scrutiny and underpinning budget renewals.
By Device Form Factor: Consumer Headsets Lead While Smart Glasses Surge
Consumer headsets delivered 41.35% of 2025 revenue, a figure sustained by immersive gaming franchises and falling entry prices. However, smart glasses are forecast for a 30.95% CAGR, propelled by miniaturized waveguides, power-efficient micro-LEDs and partnerships with eyewear brands. Shipping more than 1 million pairs of camera-enabled glasses in 2024, Meta and Ray-Ban demonstrated latent demand for socially acceptable wearables. The Virtual, Augmented and Mixed Reality market share for head-mounted smart glasses is poised to widen as display-in-lens models debut in 2025.
Enterprise and industrial headsets continue to occupy a niche, valued for rugged casings, hot-swap batteries and compliance certifications. Future momentum lies in modular architectures where visor shells dock with compute packs, letting users shift from immersive design review to lightweight field service with a single core platform. Emerging neural interfaces showcased at recent industry expos hint at hands-free inputs that could make glasses the de-facto front-end for ambient computing.
By End-User Industry: Gaming Dominance Meets Healthcare Innovation
Gaming and e-sports retained 37.85% of revenue in 2025, underscoring entertainment’s historic role in market ignition. Yet healthcare is on course for a 33.29% CAGR, the fastest among verticals, as surgical simulators, phobia therapies and neuro-rehabilitation tools win reimbursement codes. The Virtual, Augmented and Mixed Reality market size devoted to medical applications is predicted to more than triple by 2030 as outcome studies validate lower complication rates and shorter hospital stays.
Manufacturing and industrial maintenance remain strong contributors, leveraging XR digital twins to shorten downtime and reduce safety incidents. Retail experiments with virtual showrooms achieve basket-size uplifts that outpace e-commerce averages. Education, real estate and public-sector pilots are entering scale-up phases as curricula, procurement and cloud infrastructure mature. Diversity across verticals acts as a hedge, smoothing revenue volatility linked to consumer upgrade cycles.
Geography Analysis
North America continues to lead the Virtual Augmented And Mixed Reality Market, capturing 27.45% of global revenue in 2025, supported by venture financing, defense contracts and a dense ecosystem of software studios. Public filings reveal that Meta alone invests close to USD 20 billion annually in XR, anchoring supply chains and attracting component makers. Regulatory clarity on data privacy and export controls bolsters enterprise confidence, while 5G mid-band coverage in major metros underpins cloud-rendered workflows.
Asia-Pacific is the fastest-growing region, projected to compound at 34.57% through 2031. Government initiatives drive domestic ecosystem build-outs: South Korea targets a top-five global metaverse ranking by 2026, while China designates XR among “future industries” and funds R&D through provincial grants. Component supply chains headquartered in Japan and Taiwan deliver optics, sensors and ASICs to global OEMs, reducing lead times and fostering co-development programs. The Virtual, Augmented and Mixed Reality market continues to attract greenfield investment in Singapore, India and Australia as telecom incumbents deploy standalone 5G cores.

Competitive Landscape
The Virtual, Augmented and Mixed Reality market presents moderate fragmentation with pronounced platform gravity. Meta combines proprietary silicon, Horizon OS and an in-house app ecosystem, creating stickiness despite cumulative operating losses disclosed in shareholder reports. Apple occupies the premium tier, leveraging an integrated silicon-to-services stack with Vision Pro. Alphabet revived its commitment via an acquisition of HTC’s XR assets worth USD 250 million, aligning with Android-based smart-glasses roadmaps.
Vertical specialists prosper where domain knowledge trumps generalist scale. Osso VR dominates surgical simulation, backed by peer-reviewed efficacy data that satisfies clinical governance boards. Industrial-focused vendors such as ArborXR extend device management to analytics that quantify return on training spend, essential for CAPEX-driven sectors. Patent filings reveal heightened activity in optics, low-power AI accelerators and context-aware rendering, signaling barriers to entry that favor incumbents with R&D depth.
Virtual, Augmented and Mixed Reality (VR/AR) Industry Leaders
-
Meta Platforms Inc. (Oculus)
-
Sony Group Corp.
-
HTC Corp. (Vive)
-
Microsoft Corp.
-
Apple Inc.
- *Disclaimer: Major Players sorted in no particular order

Recent Industry Developments
- June 2025: Niantic Spatial and Snap formed a location-based AR alliance to distribute immersive content across mobile social networks.
- May 2025: Google placed USD 150 million into an AI-powered smart-glasses program with Warby Parker, allocating USD 75 million to product co-development.
- May 2025: Meta partnered with Anduril on the EagleEye system for U.S. defense XR deployments valued up to USD 100 million.
- May 2025: ArborXR acquired InformXR and launched an analytics suite following its USD 12 million Series A.


Research Methodology Framework and Report Scope
Market Definitions and Key Coverage
Our study defines the virtual, augmented and mixed reality market as all revenue earned from purpose-built hardware, head-mounted displays, smart glasses, sensors, processors and controllers, together with the related software licenses and system integration services that power fully immersive (VR), digitally overlaid (AR) or blended (MR) experiences across consumer and enterprise settings. According to Mordor Intelligence, this market was worth roughly USD 20.43 billion in 2025.
Scope Exclusion: The sizing removes generic smartphones, standalone game consoles and metaverse platforms that do not rely on dedicated XR hardware.
Segmentation Overview
-
By Reality Type
- Virtual Reality (VR)
- Augmented Reality (AR)
- Mixed Reality (MR)
-
By Component
- Hardware
- Software
- Services
-
By Device Form Factor
- Consumer Headsets
- Enterprise/Industrial Headsets
- Smart Glasses
- Others
-
By End-Use Industry
- Gaming and E-Sports
- Media and Entertainment
- Healthcare and Life-Sciences
- Retail and E-Commerce
- Manufacturing and Industrial
- Others
-
By Geography
-
North America
- United States
- Canada
- Mexico
-
South America
- Brazil
- Argentina
- Rest of South America
-
Europe
- Germany
- United Kingdom
- France
- Italy
- Spain
- Rest of Europe
-
Asia-Pacific
- China
- India
- Japan
- South Korea
- Australia and New Zealand
- Rest of Asia-Pacific
-
Middle East and Africa
-
Middle East
- Saudi Arabia
- United Arab Emirates
- Turkey
- Rest of Middle East
-
Africa
- South Africa
- Egypt
- Rest of Africa
-
Middle East
-
North America
Detailed Research Methodology and Data Validation
Desk Research
We began with publicly available datasets from bodies such as the International Telecommunication Union for 5G roll-out metrics, the United States Patent and Trademark Office for headset patent filings, UN Comtrade for cross-border headset shipments and the World Semiconductor Trade Statistics database for mixed-signal processor output. These anchors defined physical supply ceilings and technology maturity curves.
The team then contrasted these figures with company 10-Ks, investor presentations, respected press coverage accessed through Dow Jones Factiva, and revenue splits for private suppliers sourced via D&B Hoovers. The sources named are illustrative; many additional references supported data collection, validation and clarification.
Primary Research
Mordor analysts interviewed chip designers, game-studio producers, hospital simulation managers and Asian contract manufacturers across North America, Europe and Asia Pacific. Insights on average selling prices, enterprise penetration rates and near-term supply constraints refined model assumptions and closed gaps left by desk work.
Market-Sizing & Forecasting
We rebuilt the base year through a top-down device shipment multiplied by average price construct that is cross-checked against sampled supplier roll-ups and retail channel checks. Key input variables include global VR headset units, AR smart-glass adoption in healthcare, cloud GPU pricing, 5G population coverage and corporate training hours shifted to XR. A multivariate regression links these drivers to historic spend, then projects five years forward. Missing bottom-up values are smoothed with median utilization factors obtained from expert calls.
Data Validation & Update Cycle
Outputs pass a three-layer review in which junior modelers, a senior domain lead and the quality team flag variances versus press releases, regulatory filings and prior editions.
Reports refresh annually, with interim updates when material events such as major product launches shift fundamentals.
Why Mordor's Virtual Augmented And Mixed Reality (VR/AR) Baseline Earns Trust
Published XR estimates often differ because firms choose dissimilar device mixes, price assumptions or update cadences. We make these variances explicit so buyers understand why our baseline stands firm.
Large gaps typically emerge when others bundle ancillary revenue like metaverse advertising or, at the opposite extreme, count only hardware. Some projections overlook silicon supply limits or rely on developer polls rather than shipment evidence. This is where Mordor's balanced scope, dual-source validation and yearly refresh cadence provide added dependability.
Benchmark comparison
| Market Size | Anonymized source | Primary gap driver |
|---|---|---|
| USD 20.43 B (2025) | Mordor Intelligence | |
| USD 193.98 B (2024) | Global Consultancy A | Bundles XR content, services and accessories; older base year |
| USD 253.50 B (2025) | Industry Association B | Adds broad metaverse platform revenue; relies on vendor self-reported sales |
| USD 24.42 B (2024) | Trade Journal C | Counts headset hardware only; omits software and integration spend |
The comparison shows figures swing widely when scope or evidence shifts. By tying every assumption to verifiable shipments and cross-checked prices, Mordor delivers a transparent, repeatable baseline that decision-makers can trust.


Key Questions Answered in the Report
What is the current value of the Virtual, Augmented and Mixed Reality market?
The Virtual, Augmented and Mixed Reality market is valued at USD 26.9 billion in 2026.
How fast is the market expected to grow?
Revenue is projected to rise to USD 106.42 billion by 2031, equating to a 31.67% CAGR.
Which reality type is expanding the quickest?
Mixed Reality leads growth with a forecast 33.69% CAGR, outpacing Augmented and Virtual Reality segments.
Which end-use sector will see the fastest expansion?
Healthcare is set for a 33.29% CAGR, driven by surgical simulation, therapy and remote assistance deployments.
Page last updated on:


