Virtual Reality (VR) Market Size and Share
Market Overview
| Study Period | 2020 - 2031 |
|---|---|
| Market Size (2026) | USD 15.64 Billion |
| Market Size (2031) | USD 40.71 Billion |
| Growth Rate (2026 - 2031) | 21.08% CAGR |
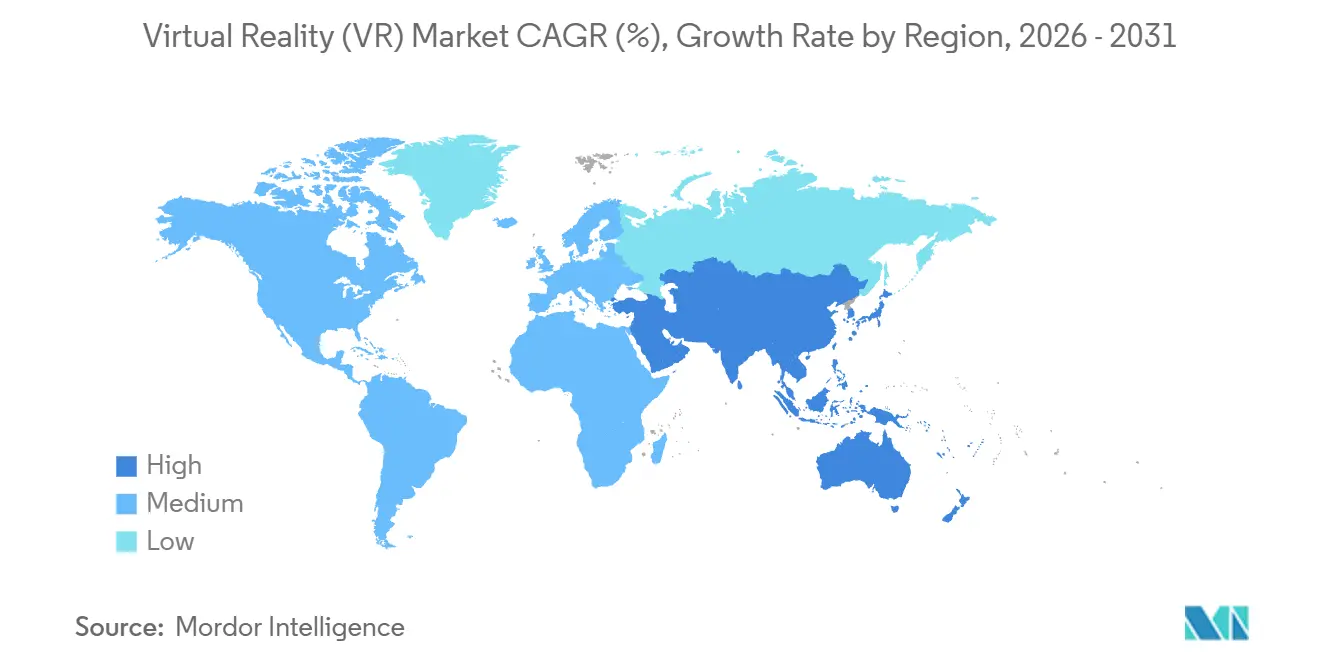
| Fastest Growing Market | Asia Pacific |
| Largest Market | North America |
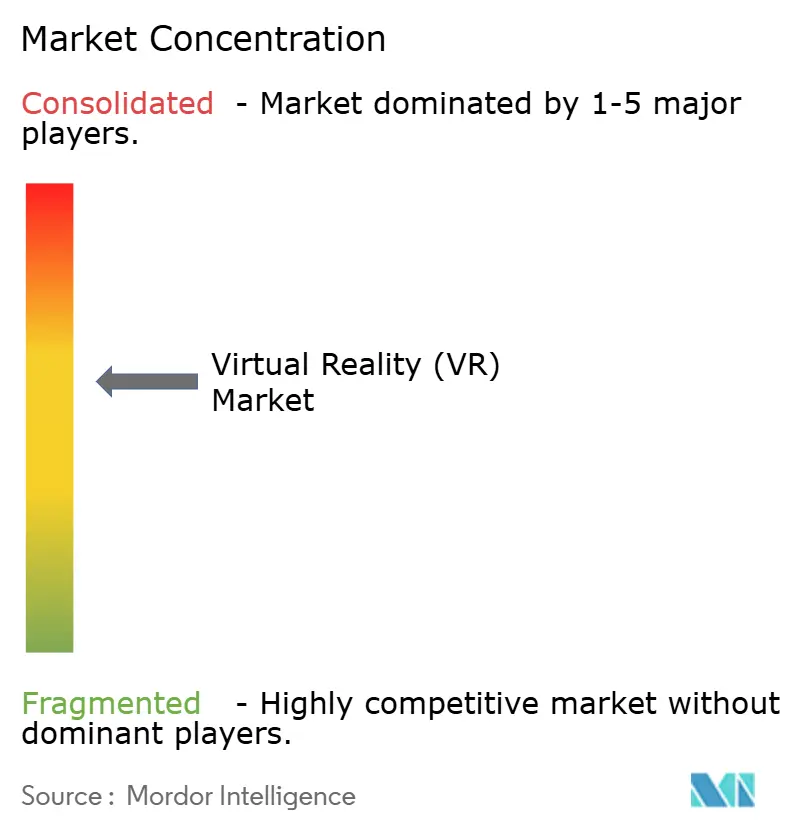
| Market Concentration | Medium |
Major Players *Disclaimer: Major Players sorted in no particular order Image © Mordor Intelligence. Reuse requires attribution under CC BY 4.0. | |
Virtual Reality (VR) Market Analysis by Mordor Intelligence
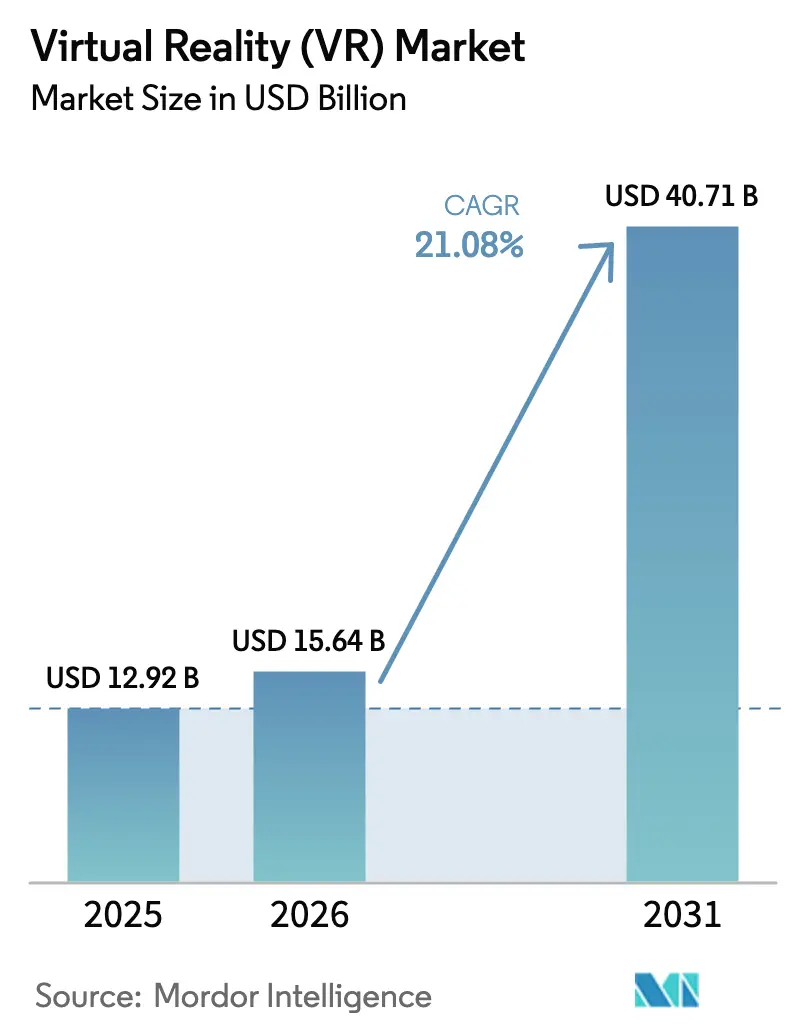
The Virtual Reality Market size is projected to be USD 12.92 billion in 2025, USD 15.64 billion in 2026, and reach USD 40.71 billion by 2031, growing at a CAGR of 21.08% from 2026 to 2031. Demand is shifting from consumer entertainment to enterprise productivity as corporations embed immersive simulations into workforce development programs, which shorten skills-acquisition time and reduce safety incidents. The shift is reshaping hardware design priorities, with stand-alone head-mounted displays (HMDs) gaining favor because untethered mobility matters more on factory floors and in field operations than raw tethered performance. Hardware still generates the majority of revenue, yet services encompassing content creation, integration, and managed experiences are scaling faster as outcome-based contracts replace device procurement. Regionally, North America leads in value due to an entrenched vendor base and favorable healthcare reimbursement, while the Asia Pacific posts the fastest growth as 5G and edge nodes enable cloud-rendered VR, which lowers per-seat costs for large manufacturing workforces.
Key Report Takeaways
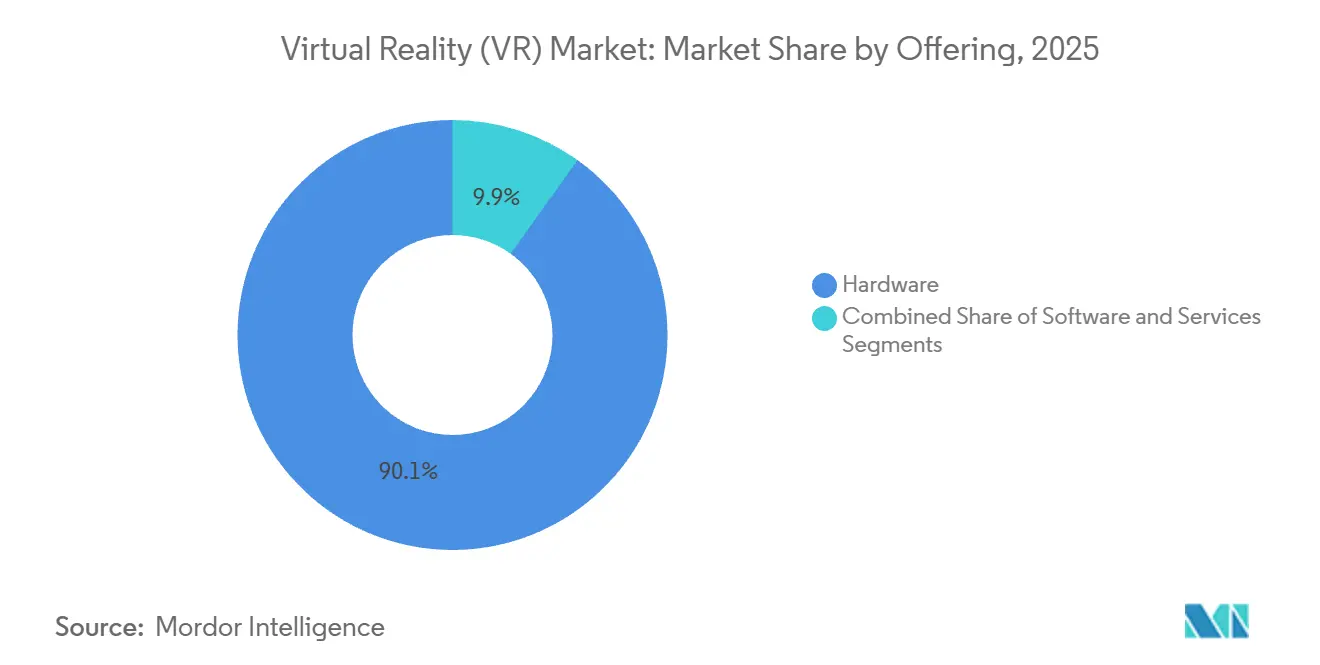
- By offering hardware captured 90.12% of the virtual reality market share in 2025, while services posted the highest projected growth at a 21.43% CAGR through 2031.
- By device form factor, stand-alone HMDs led with 46.23% revenue share in 2025 and are forecast to expand at a 22.12% CAGR to 2031.
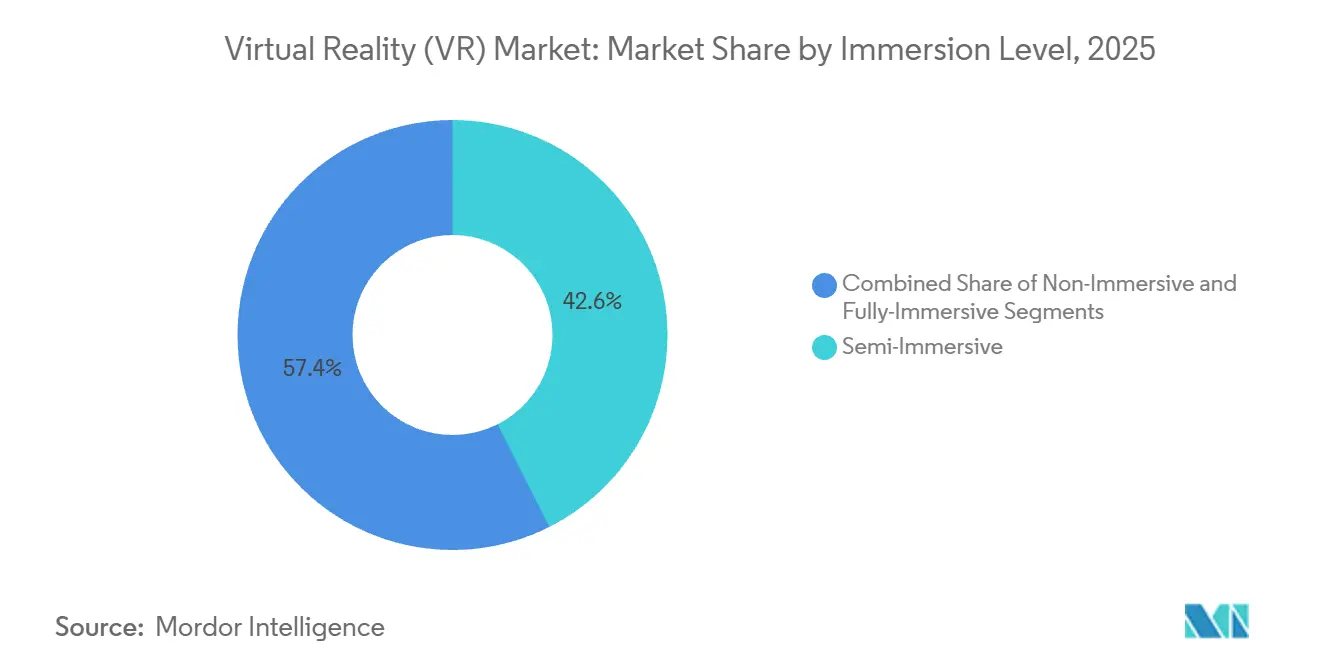
- By immersion level, semi-immersive systems accounted for 42.56% of the virtual reality market size in 2025; fully immersive platforms are expected to record the strongest outlook at a 23.12% CAGR from 2026 to 2031.
- By end-user industry, gaming retained a 63.43% share of the virtual reality market size in 2025, while healthcare is projected to advance at a 24.21% CAGR through 2031.
- By geography, North America commanded 37.36% of the virtual reality market share in 2025, whereas the Asia Pacific is set to grow fastest at a 23.49% CAGR to 2031.
Note: Market size and forecast figures in this report are generated using Mordor Intelligence’s proprietary estimation framework, updated with the latest available data and insights as of January 2026.
Global Virtual Reality (VR) Market Trends and Insights
Drivers Impact Analysis*
| Driver | (~) % Impact on CAGR Forecast | Geographic Relevance | Impact Timeline |
|---|---|---|---|
| Rising enterprise-wide VR training adoption | +5.2% | Global, concentrated in North America and Europe | Medium term (2-4 years) |
| Mainstreaming of mixed-reality-ready GPUs and SoCs | +4.8% | Global, led by North America and Asia Pacific | Short term (≤ 2 years) |
| 5G and edge-powered untethered VR streaming | +3.9% | Asia Pacific core, spill-over to Middle East and Europe | Medium term (2-4 years) |
| Corporate net-zero pledges driving virtual-first events | +2.1% | Europe and North America, expanding to Asia Pacific | Long term (≥ 4 years) |
| Regulatory approvals for VR-based mental-health therapies | +2.8% | North America and Europe, pilot programs in Asia Pacific | Medium term (2-4 years) |
| Ultrasound-haptics enabling controller-free interaction | +1.9% | Global, early adoption in North America and Japan | Long term (≥ 4 years) |
| Source: Mordor Intelligence | |||
Rising Enterprise-Wide VR Training Adoption
Simulation-based training compresses learning curves and reduces liability from on-the-job errors, motivating corporations to allocate larger budgets to immersive content. Multinationals in aviation, energy, and emergency response now deploy VR modules for tasks where a single mistake carries high human or financial cost. International quality standards such as ISO 9001 increasingly accept VR-documented competency as equivalent to physical demonstrations, streamlining compliance audits. However, many organizations still face a six-to-twelve-month lead time to create bespoke modules because skilled 3D developers remain in short supply. These content bottlenecks moderate the growth curve even as the business case strengthens.
Mainstreaming of Mixed-Reality-Ready GPUs and SoCs
Chipmakers have embedded dedicated VR processing blocks into their flagship processors, removing the price premium once associated with immersive-capable devices. Apple’s M5 chip features hardware-accelerated foveated rendering, delivering desktop-class visuals in a lightweight headset. Qualcomm’s Snapdragon XR2 Gen 2 platform now powers stand-alone units priced below USD 500, placing immersive hardware within reach of schools and small businesses. Lower entry costs decouple purchases from long IT refresh cycles, turning headsets into consumable peripherals. The main concern is thermal management; extended sessions still trigger eye-box heat buildup, which limits continuous use. Continuous engineering on heat dissipation and lens ventilation is therefore essential for broader workplace adoption.
5G and Edge-Powered Untethered VR Streaming
Sub-20 millisecond motion-to-photon latency achieved in South Korea and Japan proves that cloud-rendered VR can match on-device experiences. By shifting processing to edge nodes, enterprises reduce headset bill-of-materials by up to 60%, a critical factor when equipping thousands of shop-floor workers. Cloud delivery also eases content updates, letting administrators push new training modules network-wide overnight. Coverage remains an obstacle outside dense urban corridors, so rural manufacturing hubs continue to rely on traditional, stand-alone devices. Network resiliency becomes a new operational risk because lost connectivity instantly halts a training session.
Regulatory Approvals for VR-Based Mental-Health Therapies
The U.S. Food and Drug Administration and several European health authorities now recognize VR exposure therapy for anxiety and post-traumatic stress disorders as reimbursable treatments.[1]“FDA Authorizes VR Platforms for Mental Health Treatment,” U.S. Food and Drug Administration, fda.gov Reimbursement unlocks predictable revenue for vendors and assures hospitals of cost recovery. Clinics typically need 18–24 months to integrate new protocols, train staff, and establish billing codes. Compliance with HIPAA and GDPR for biometric data introduces extra cybersecurity steps, but the therapeutic benefits foster sustained acceptance. Early outcomes show shorter treatment cycles and improved patient adherence relative to talk therapy alone.
Restraints Impact Analysis*
| Restraint | (~) % Impact on CAGR Forecast | Geographic Relevance | Impact Timeline |
|---|---|---|---|
| Cybersickness and long-term vestibular concerns | -2.7% | Global | Short term (≤ 2 years) |
| Eye-box heat build-up limiting continuous usage | -1.8% | Global | Short term (≤ 2 years) |
| Scarcity of AAA-grade VR content outside gaming | -2.3% | Global, most acute in enterprise segments | Medium term (2-4 years) |
| Data-privacy compliance costs for eye-tracking analytics | -1.4% | Europe and North America, emerging in Asia Pacific | Medium term (2-4 years) |
| Source: Mordor Intelligence | |||
Cybersickness and Long-Term Vestibular Concerns
Visual-vestibular mismatch triggers nausea, dizziness, and eye strain in 25–40% of first-time users, with 15% of acclimated users still reporting discomfort during sessions longer than 30 minutes. Enterprises must maintain parallel non-VR pathways for sensitive employees, diluting return on investment. Hardware improvements in refresh rate and latency have reached diminishing returns, so further gains require motion-prediction algorithms or pharmacological aids not yet commercially viable. Liability questions about long-term vestibular health persist due to limited longitudinal research. These factors combine to temper aggressive rollout plans, especially in healthcare and education environments.
Data-Privacy Compliance Costs for Eye-Tracking Analytics
Advanced headsets collect gaze, blink, and facial-expression data to enable foveated rendering and behavioral analytics. In the European Union, biometric data receives heightened protection under GDPR, requiring explicit opt-in consent and robust anonymization measures.[2]“GDPR Compliance Requirements for Biometric Data,” European Union GDPR Portal, gdpr.eu North American firms with global operations must adopt the same safeguards to avoid data-transfer complications. Compliance tooling adds cost and complexity, forcing some enterprises to disable eye-tracking features entirely and forego associated performance benefits. Vendors must invest in secure-by-design architectures and third-party audits to reassure privacy officers, slowing rollouts.
*Our forecasts treat driver/restraint impacts as directional, not additive. The impact forecasts reflect baseline growth, mix effects, and variable interactions.
Segment Analysis
By Offering: Services Accelerate as Outcome-Based Models Emerge
Hardware dominated the virtual reality market in 2025, with a 90.12% revenue share; however, services are on track to grow at a 21.43% CAGR through 2031. The virtual reality market size for services reflects rising demand for turnkey integration, content licensing, and managed experiences as enterprises seek predictable costs and guaranteed outcomes. Large industrial clients now sign multi-year contracts priced per trained employee rather than purchasing headsets outright, a model reminiscent of software-as-a-service. Hardware revenue continues to climb as performance improvements compress refresh cycles to approximately 30 months, but volume growth shifts toward lower-margin corporate bundles. Platform vendors respond by launching device-management portals and analytics dashboards that monetize post-sale engagement. Content studios partner with integrators to deliver modular simulation libraries that reduce development times. Overall, service expansion signals the sector’s transition from experimental pilots to operational scale.
Advances in chipset efficiency and optics drive replacement demand because aging devices struggle to meet evolving fidelity requirements. Enterprises now schedule headset upgrades alongside workstation refreshes to maintain training accreditation. Leasing models gain popularity, bundling hardware, content updates, and warranty services into single invoices that finance departments can classify as operating expenditure. The virtual reality market continues to reward providers that combine device supply with measurable productivity metrics tracked through learning-management integrations.

By Device Form Factor: Stand-Alone HMDs Lead Mobility-First Adoption
Stand-alone HMDs captured 46.23% of virtual reality market share in 2025 thanks to cable-free operation, and they are forecast to expand at a 22.12% CAGR through 2031. Enterprises choose mobility over peak graphical output because factory floors, construction sites, and hospital theaters value freedom of movement. The virtual reality market size for standalone units benefits from falling component costs; Snapdragon XR2 Gen 2 boards are priced under USD 100, enabling sub-USD 500 retail headsets. Tethered rigs retreat to visualization suites where workstation-class GPUs still matter, such as automotive design. Screenless viewers, once attractive for budget-constrained classrooms, decline as integrated devices deliver better optics at similar price points. CAVE installations persist in military and academic research, but remain niche due to the high setup costs associated with them.
In industrial trials, untethered headsets cut average setup time by 40% because users skip PC installation and cable management. Battery life remains the primary trade-off; most units offer two hours of endurance, which is adequate for typical training modules but insufficient for extended maintenance procedures. Vendors experiment with hot-swap battery designs and belt-mounted power packs to close the gap. Accessory ecosystems protective visors, prescription lens adapters, and integrated biometric sensors further cement stand-alone leadership by tailoring devices to specific workplace needs.
By Immersion Level: Full Immersion Gains Regulatory Traction
Semi-immersive systems held 42.56% of revenue in 2025, yet fully immersive configurations are projected to grow at 23.12% CAGR as healthcare and heavy industry demand higher fidelity. The virtual reality market size for fully immersive platforms rises because regulatory agencies now require six-degrees-of-freedom tracking to certify clinical and safety outcomes. Hospitals use fully immersive therapy to distract burn patients during wound care, cutting opioid usage by double-digit percentages. Airlines and energy firms integrate full-body motion capture to document technician proficiency on critical equipment. Non-immersive 360-video applications fade because they cannot replicate tactile depth cues essential for psychomotor learning.
Pricing parity also propels the shift. Stand-alone headsets with inside-out tracking deliver complete positional awareness at costs previously associated with partial immersion. Content studios leverage advanced game engines to build lifelike digital twins, making full immersion the de-facto baseline for new projects. Semi-immersive setups survive in retail showrooms and museum exhibits where glance-based interaction suffices and budget constraints matter. Over the forecast period, the balance tilts decisively toward full immersion as buyers standardize on one platform to minimize support complexity.
By End-User Industry: Healthcare Surges on Reimbursement and Outcomes
Gaming maintained 63.43% of the virtual reality market size in 2025, yet healthcare is poised to climb fastest with a 24.21% CAGR to 2031. Insurance reimbursement for VR-guided physical therapy, pain management, and mental-health treatment creates predictable cash flows that consumer entertainment lacks. Leading U.S. hospitals report 30% shorter rehabilitation cycles when patients follow immersive exercise regimens, freeing bed capacity and reducing costs. Surgical residents log procedure repetitions in validated VR modules that count toward board certification, accelerating competency milestones. Outside the operating room, nursing programs utilize VR to simulate rare emergencies, enhancing readiness without compromising patient safety.
Entertainment’s large installed base still drives volume, and live-event producers stream concerts and sports in VR to monetize remote fans. The education and corporate training segments expand steadily as content libraries grow, although budget approvals remain longer than in reimbursed healthcare. Military and public-safety agencies are adopting VR for scenario-based drills, driving growth across public sector budgets. Diversification of revenue streams stabilizes the overall virtual reality market even if consumer gaming growth tapers.
Geography Analysis
North America generated 37.36% of the 2025 revenue, supported by a dense ecosystem comprising chipset designers, headset manufacturers, and specialized content studios. Fortune 500 manufacturers, healthcare systems, and defense contractors transitioned from pilots to full-scale rollouts in 2024–2025, integrating VR metrics into key performance dashboards. FDA approvals of therapeutic applications and the U.S. Department of Defense’s investment in immersive training infrastructure sustain institutional demand.[3]“Department of Defense VR Training Infrastructure Investment,” U.S. Department of Defense, defense.gov Growth moderates as early adopters saturate, shifting focus to small and mid-sized businesses that require simplified deployment and lower pricing.
The Asia Pacific is on course to register a 23.49% CAGR from 2026 to 2031, the fastest growth rate worldwide. China, Japan, South Korea, and India are leveraging VR to bridge skilled labor shortages in advanced manufacturing, deploying thousands of headsets for assembly-line instruction. South Korea’s ubiquitous 5G reduces headset costs by streaming workloads from edge servers. Japan’s aging population drives the uptake of elder-care rehabilitation, aided by subsidies from the Ministry of Health. India combines government skill-development grants with affordable Chinese hardware to scale training in electronics and automotive clusters. Australia and New Zealand contribute niche demand from mining and energy firms that value VR for remote-site safety drills.
Europe, South America, the Middle East, and Africa display heterogeneous trajectories. Europe wrestles with strict GDPR rules on biometric data that add compliance overhead for eye-tracking analytics, yet automotive and aerospace leaders in Germany and France still push adoption within controlled facilities. South American uptake concentrates in Brazilian and Argentine urban centers where broadband coverage supports VR labs for education and retail showrooms. The United Arab Emirates and Saudi Arabia invest heavily in VR tourism experiences linked to national economic diversification plans. African markets remain nascent, focusing on donor-funded telemedicine pilots that circumvent hospital shortages. Infrastructure quality and regulatory clarity dictate pace more than inherent interest, ensuring regional growth curves diverge widely through 2031.
Competitive Landscape
Competition hinges on ecosystem stickiness rather than unit margins. Meta Platforms, Sony, and Apple each bundle hardware, proprietary app stores, and developer tools, using exclusive content and subsidized pricing to lock in users. Meta’s Reality Labs has invested over USD 100 billion since its inception, allowing for aggressive Quest pricing that undercuts the bill of materials to build an installed base. Apple positions Vision Pro as a premium productivity device with tight integration to macOS and iOS workflows. Sony scales PlayStation VR2 production for enterprise simulations, leveraging its console graphics pedigree to attract training developers.
Open standards temper these walled-garden strategies. The Khronos Group’s OpenXR API enables developers to maintain a single codebase across multiple headsets, reducing switching costs and fostering price competition. Chinese brands Pico and DPVR win market share in the Asia Pacific and cost-sensitive European segments by offering hardware at 20–30% discounts to Western rivals, while supporting enterprise device-management suites. Niche specialists carve defensible positions by combining domain expertise with platform-agnostic software; surgical-planning vendors integrate DICOM imaging, while hazardous-materials trainers embed real-world sensor data for realistic cues.
Strategic partnerships proliferate as cloud, software, and network providers vie for platform relevance. Meta and Microsoft integrate Microsoft 365 into Quest headsets to attract corporate productivity users. Samsung and Google co-develop Android XR to counter Apple’s visionOS dominance, promising an open ecosystem for handset-based headsets. Chip suppliers such as Qualcomm push reference designs that accelerate new entrants, expanding hardware diversity. Overall, competitive intensity remains moderate; barriers to entry rise in content and services where domain knowledge trumps scale, while hardware margins compress under standardization pressure.
Virtual Reality (VR) Industry Leaders
Meta Platforms (Meta Quest)
Sony Corporation
HTC Corporation
Samsung Electronics Co. Ltd
Apple Inc.
- *Disclaimer: Major Players sorted in no particular order


Recent Industry Developments
- January 2026: Qualcomm began sampling the Snapdragon XR3 reference design for select OEM partners, targeting sub-USD 400 professional headsets with advanced AI inference acceleration.
- October 2025: Apple launched the Vision Pro with the M5 chip, pairing hardware-accelerated foveated rendering and real-time environment mapping at USD 3,499.
- October 2025: Samsung and Google unveiled Android XR, an open operating system for extended-reality devices, with the first Samsung hardware scheduled for release in mid-2026.
- September 2025: Meta and Microsoft announced native Microsoft 365 integration for Quest headsets to streamline VR productivity workflows.


Research Methodology Framework and Report Scope
Market Definitions and Key Coverage
Our study defines the global virtual reality (VR) market as revenue generated by vendors from the sale of dedicated VR hardware, enabling software licenses, and related support services that deliver fully or partially immersive, computer-generated environments to consumer and enterprise users.
Scope exclusion: Content subscriptions, augmented or mixed-reality devices, and developer tool royalties do not feature in this valuation.
Segmentation Overview
- By Offering
- Hardware
- Software
- Services
- By Device Form Factor
- Tethered HMD
- Stand-Alone HMD
- Screenless Viewer
- CAVE / Immersive Rooms
- By Immersion Level
- Non-Immersive
- Semi-Immersive
- Fully-Immersive
- By End-User Industry
- Gaming
- Media and Entertainment
- Healthcare
- Education and Training
- Military and Defense
- Retail and eCommerce
- Real Estate and Architecture
- By Geography
- North America
- United States
- Canada
- Mexico
- South America
- Brazil
- Argentina
- Rest of South America
- Europe
- Germany
- United Kingdom
- France
- Italy
- Spain
- Russia
- Rest of Europe
- Asia Pacific
- China
- Japan
- South Korea
- India
- Australia
- New Zealand
- Rest of Asia Pacific
- Middle East
- United Arab Emirates
- Saudi Arabia
- Turkey
- Rest of Middle East
- Africa
- South Africa
- Nigeria
- Kenya
- Rest of Africa
- North America
Detailed Research Methodology and Data Validation
Primary Research
To refine assumptions, Mordor analysts hold structured interviews with headset OEM finance managers, AAA-studio production leads, hospital simulation directors, and telecom edge-compute planners across North America, Europe, and Asia-Pacific. These conversations test price-volume correlations, procurement cycles, and upgrade intent, letting us close gaps that desk work alone cannot.
Desk Research
We begin by mining tier-1 public datasets, such as IDC's quarterly headset tracker, WTO customs statistics for HS 950450 shipments, International Telecommunication Union 5G-coverage maps, and U.S. Bureau of Labor Statistics training-budget series, to anchor unit volumes, connectivity readiness, and enterprise spending patterns. Company 10-Ks, investor decks, and association portals (IEEE VR, VRARA) further clarify adoption curves, while paid resources like D&B Hoovers and Dow Jones Factiva help us size vendor revenue streams by region. Patent landscapes from Questel, alongside peer-reviewed journals on latency thresholds, enable us to benchmark technology inflection points that sway device pricing. This list is illustrative; many other secondary sources support data capture, verification, and context building.
Market-Sizing & Forecasting
A top-down reconstruction starts with 2024 global shipments and average selling prices of tethered, standalone, and screenless viewers, which are then aligned with trade data and enterprise penetration rates. Bottom-up roll-ups of sampled supplier revenue and channel checks validate totals before adjustments. Key variables in our multivariate regression forecast include 5G population coverage, GPU attach rates in gaming PCs, corporate safety-training mandates, headset bill-of-materials trends, and developer platform subscriber counts. Where bottom-up inputs are patchy, we interpolate using median ASP progressions observed in primary interviews.
Data Validation & Update Cycle
Every model passes a two-step analyst review, anomaly screens against independent metrics, and variance checks versus prior editions. Reports refresh annually; material events, large platform launches or component price shocks, trigger interim updates, ensuring clients always receive the latest calibrated view.
Why Our Virtual Reality Baseline Commands Reliability
Published VR estimates diverge because firms choose dissimilar device sets, bundle content revenues, or apply aggressive refresh cadences. We flag these levers so buyers see why totals shift.
Key gap drivers include: some publishers fold AR wearables and XR developer tools into their headline figure; others escalate 2030 demand via untested price-elasticity assumptions or convert currencies at constant 2020 rates, whereas Mordor updates FX quarterly.
Benchmark comparison
| Market Size | Anonymized source | Primary gap driver |
|---|---|---|
| USD 12.88 B (2025) | Mordor Intelligence | - |
| USD 16.32 B (2024) | Global Consultancy A | Includes VR content and early AR glasses revenue not counted by us |
| USD 15.90 B (2024) | Industry Journal B | Uses factory shipments only, omits service contracts, applies static ASPs |
| USD 79.36 B (2023) | Regional Consultancy C | Combines VR with broader XR hardware and software, limited primary validation |
In sum, Mordor's disciplined scope selection, annually refreshed variables, and dual-route validation mean decision-makers gain a balanced, transparent baseline they can trace back to clear drivers and repeatable steps.


Key Questions Answered in the Report
What is the current value of the virtual reality market?
The virtual reality market size stands at USD 15.64 billion in 2026.
How fast is the virtual reality market expected to grow?
It is projected to register a 21.08% CAGR and reach USD 40.71 billion by 2031.
Which segment is growing fastest within virtual reality offerings?
Services, including content creation and managed experiences, are forecast to expand at a 21.43% CAGR through 2031.
Why are stand-alone headsets leading device adoption?
Enterprises favor untethered mobility for safety and convenience, enabling stand-alone units to capture 46.23% market share in 2025 and grow at a 22.12% CAGR.
What makes healthcare a high-growth end-user segment?
Insurance reimbursement for VR-based therapy and measurable patient outcomes drive a 24.21% CAGR for healthcare applications.
Which region will see the fastest rise in virtual reality deployments?
Asia Pacific is set to grow at a 23.49% CAGR due to 5G-enabled cloud streaming and large-scale manufacturing training programs.
Page last updated on:


