United States Cloud Gaming Market Size and Share
Market Overview
| Study Period | 2019 - 2030 |
|---|---|
| Forecast Data Period | 2025 - 2030 |
| Historical Data Period | 2019 - 2023 |
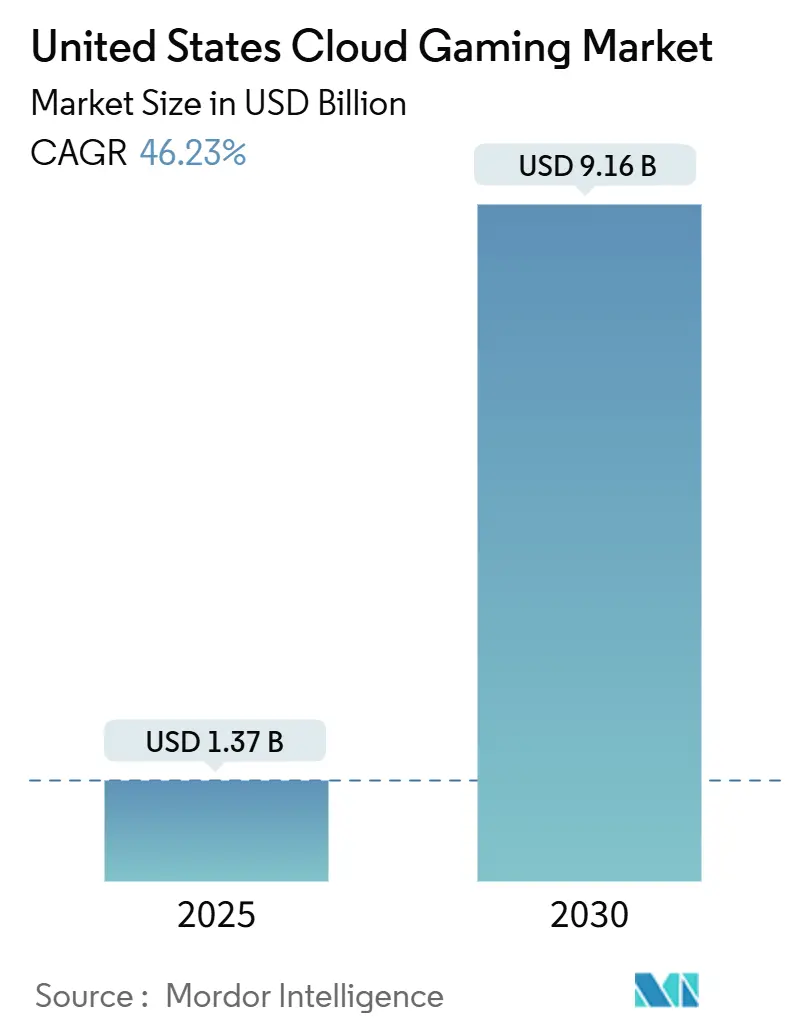
| Market Size (2025) | USD 1.37 Billion |
| Market Size (2030) | USD 9.16 Billion |
| Growth Rate (2025 - 2030) | 46.23% CAGR |
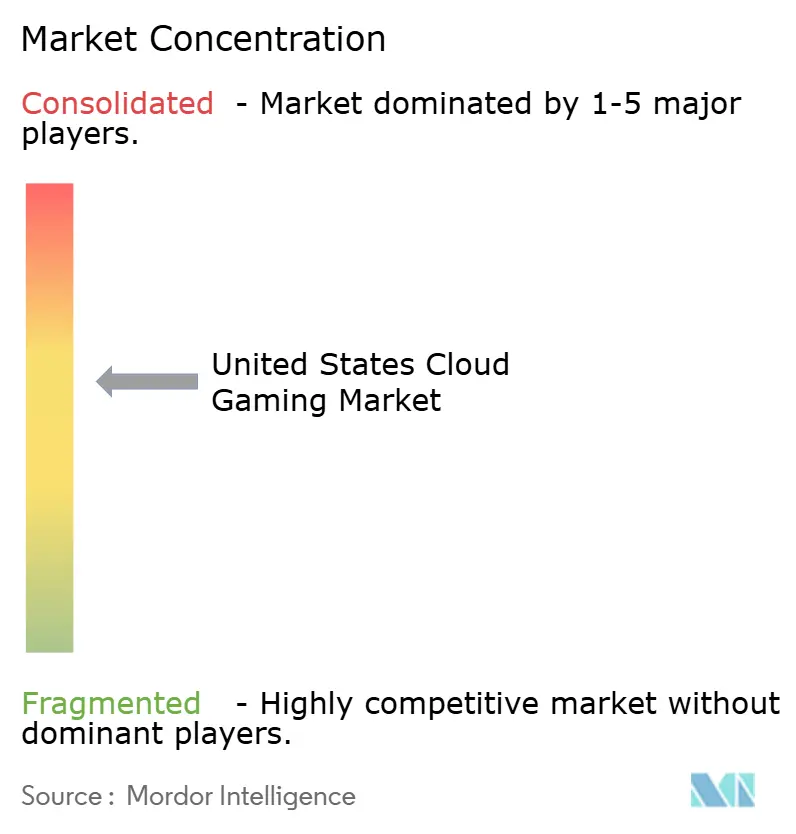
| Market Concentration | Medium |
Major Players *Disclaimer: Major Players sorted in no particular order Image © Mordor Intelligence. Reuse requires attribution under CC BY 4.0. | |
United States Cloud Gaming Market Analysis by Mordor Intelligence
The United States cloud gaming market size is projected to reach USD 9.16 billion by 2030, representing a 46.23% CAGR from USD 1.37 billion in 2025. This trajectory confirms how 5G densification, maturing edge infrastructures, and a swift shift toward subscription ecosystems are reshaping interactive entertainment. Nationwide rollouts of 5G and edge nodes are steadily lowering round-trip latency, while cloud platforms bundle extensive content libraries to shorten time-to-play. Investments from Comcast, Verizon, and other carriers funnel GPU capacity closer to end-users, reducing network hops and enhancing real-time responsiveness. Simultaneously, device makers and app-store operators now frame cloud play as a premium feature, expanding reach to smart TVs and iOS handsets. Regulatory discussions around data caps and net neutrality inject uncertainty, but they also spotlight the sector’s strategic importance.[1]Federal Communications Commission, “FCC seeks comment on data caps,” FCC Document, fcc.gov Altogether, the United States cloud gaming market is advancing from early adopter status toward mainstream entertainment.
Key Report Takeaways
- By device, smartphones led with 38.21% of the United States cloud gaming market share in 2024, while tablets are forecast to post a 48.96% CAGR through 2030.
- By gamer type, casual gamers captured 46.51% share of the United States cloud gaming market size in 2024; lifestyle gamers are projected to expand at a 47.98% CAGR to 2030.
- By business model, subscription services held 71.42% of the United States cloud gaming market in 2024, whereas free-to-play and ad-supported models are set to grow at a 52.46% CAGR.
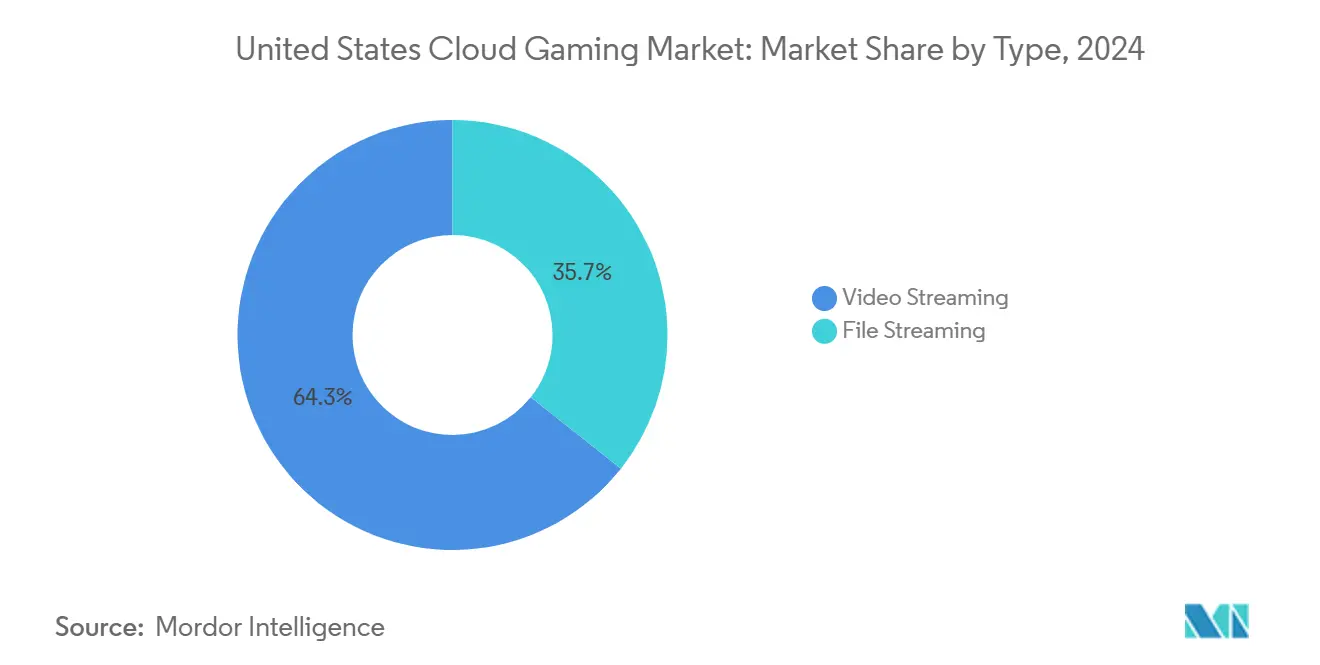
- By content delivery type, video streaming accounted for 64.32% share of the United States cloud gaming market size in 2024, and file streaming is on track for a 49.36% CAGR through 2030.
Worldwide, activity is shaped by contributions from multiple countries and regions, with United states representing one among them. The global report on cloud gaming market by Mordor Intelligence reflects how these countries and regional layers combine into a single system.
United States Cloud Gaming Market Trends and Insights
Drivers Impact Analysis*
| Driver | (~) % Impact on CAGR Forecast | Geographic Relevance | Impact Timeline |
|---|---|---|---|
| Expansion of 5G Networks Enhancing Latency Performance | +8.2% | National, with early gains in major metropolitan areas | Medium term (2-4 years) |
| Rising Adoption of Subscription Gaming Services Among Gen Z | +7.8% | National, concentrated in urban and suburban markets | Short term (≤ 2 years) |
| Integration of Cloud Gaming Into Smart TV Ecosystems | +6.4% | National, with premium household penetration | Medium term (2-4 years) |
| Growth in Cross-Platform Multiplayer Demand | +5.9% | National, with gaming community concentration | Short term (≤ 2 years) |
| Advancements in Edge Computing Infrastructure | +7.1% | National, with carrier network coverage areas | Long term (≥ 4 years) |
| Emergence of Flexible GPU Cloud Pricing Models | +4.8% | National, affecting enterprise and consumer segments | Medium term (2-4 years) |
| Source: Mordor Intelligence | |||
Expansion of 5G Networks Enhancing Latency Performance
Nationwide 5G rollouts are reducing average gaming latency to sub-20 millisecond levels, which match the requirements of competitive play. T-Mobile leads mobile gaming experience scores, highlighting the differentiation that superior 5G coverage confers. Verizon pairs its 500,000-plus route miles of fiber with GPU-as-a-Service nodes so rendered frames originate near users, bypassing distant data centers. The FCC’s USD 9 billion 5G Fund for Rural America extends these benefits beyond big cities, although deployments are expected to continue through 2028. Comcast’s Low Latency Low Loss Scalable Throughput trials already cut working latency by 78% in Atlanta, Chicago, and Philadelphia, validating measurable performance gains. As low-latency coverage expands, the United States cloud gaming market gains a broader performance baseline that supports higher-resolution streams and competitive titles.
Rising Adoption of Subscription Gaming Services Among Gen Z
Generation Z gravitates to access-over-ownership models, fueling a decisive shift toward recurring-fee libraries. Microsoft expanded Xbox Game Pass by streaming over 50 owned titles, aligning with survey findings that 73% of Gen Z gamers prefer subscriptions over individual purchases. Social gameplay drives the appeal: Unity reports 68% of studios now build multiplayer titles and sees 40.2% higher monthly active users for such games. Cross-device progression aligns with Gen Z mobile habits, with 87% of that cohort playing on phones according to YouGov polling. Together, these usage signals underpin a sustainable recurring-revenue backbone for the United States cloud gaming market.
Integration of Cloud Gaming Into Smart TV Ecosystems
Smart TV and streaming box makers add native gaming hubs to justify premium models. LG partnered with Microsoft to integrate Xbox Game Pass directly into webOS, while Samsung’s Gaming Hub aggregates multiple services, including NVIDIA GeForce Now and Amazon Luna.[2]Samsung Newsroom, “Samsung Gaming Hub brings Xbox and GeForce Now to 2022 Smart TVs,” Samsung, samsung.com Eliminating dedicated hardware lowers the cost of entry for consumers and grants platforms immediate access to the living room’s largest screen. AMD’s FidelityFX Super Resolution now ships in TV chipsets, enhancing stream sharpness without heavier bandwidth. For manufacturers, cloud gaming enhances usage time and premium subscription attach rates, thereby increasing average selling prices in an otherwise commoditized panel market.
Growth in Cross-Platform Multiplayer Demand
Cross-play eliminates device silos and creates powerful network effects that favor device-agnostic cloud services. Unity notes that 91% of multiplatform games already offer cross-play, allowing PC, console, and mobile communities to compete inside a unified match queue. Epic’s Fortnite generated USD 4 billion in 2024 by sustaining parity across all endpoints, proving the revenue upside when players move freely. Cloud hosts with large data center footprints can manage diverse device capabilities and network conditions, giving them an operational advantage over local hardware models. A seamless cross-play fabric, therefore, lifts user acquisition and retention across the United States cloud gaming market.
Restraints Impact Analysis*
| Restraint | (~) % Impact on CAGR Forecast | Geographic Relevance | Impact Timeline |
|---|---|---|---|
| Inconsistent Broadband Coverage in Rural Areas | -6.3% | Rural and remote areas, particularly in Mountain West and Great Plains | Long term (≥ 4 years) |
| High Data Caps and ISP Throttling Policies | -5.7% | National, with regional ISP policy variations | Medium term (2-4 years) |
| Limited Availability of AAA Titles in Cloud Libraries | -4.2% | National, affecting premium gaming segments | Short term (≤ 2 years) |
| Concerns Over Digital Ownership and Rights Management | -3.8% | National, concentrated among traditional gaming enthusiasts | Medium term (2-4 years) |
| Source: Mordor Intelligence | |||
Inconsistent Broadband Coverage in Rural Areas
Rural connectivity gaps keep millions from achieving the sustained 25-35 Mbps required for 4K streams. The FCC identifies 21.3 million Americans without fixed broadband meeting those thresholds. Although the USD 42.45 billion Broadband Equity Access and Deployment Program runs through 2030, providers still face USD 20,000 to USD 60,000 per passing in remote builds. Until fiber or fixed-wireless reaches sparsely populated zones, adoption ceilings remain for the United States cloud gaming market.
High Data Caps and ISP Throttling Policies
Monthly caps of 1.2 TB or less cause usage anxiety, especially because a single enthusiast can consume 150-200 GB per month in game streams. The FCC’s active inquiry into data caps has yet to clarify whether overage fees violate the principles of net neutrality. Comcast charges USD 10 for every 50 GB above its cap in select markets, adding unpredictable costs that discourage heavy play. Throttling during prime hours introduces further variability, undermining the seamless experience cloud services require for retention. Until clear policy guardrails emerge, data management uncertainty restrains the United States' cloud gaming market.
*Our forecasts treat driver/restraint impacts as directional, not additive. The impact forecasts reflect baseline growth, mix effects, and variable interactions.
Segment Analysis
By Type: Video Streaming Dominates Infrastructure Demands
Video streaming generated a 64.32% share of the United States cloud gaming market in 2024, leveraging mature video compression pipelines and global content delivery networks. This format leverages the United States cloud gaming market's advantage of proven scalability, although it requires large GPU rendering farms and robust backbone bandwidth. File streaming is expected to follow with a 49.36% CAGR forecast through 2030, as delta compression, predictive caching, and 5G edge nodes reduce round-trip payloads.
Many early adopters favor video streaming because service catalogs expand rapidly, eliminating the need for local download steps. However, competitive e-sports titles are increasingly relying on file streaming or hybrid approaches to achieve sub-20 millisecond latency. NVIDIA’s GeForce Now demonstrates video scalability at 2,000 titles even as annual GPU outlays eclipse USD 10 billion. As edge hardware matures, providers diversify across both methods, striking a balance between cost per user and gameplay responsiveness.


By Device: Mobile Gaming Drives Market Expansion
Smartphones accounted for 38.21% of the United States' cloud gaming market share in 2024, reflecting deep mobile penetration and the prevalence of always-on connectivity. The United States cloud gaming market size associated with tablets is growing the fastest at a 48.96% CAGR, thanks to large displays and high refresh rates that enhance visual quality.
Policy changes at Apple now permit native cloud apps, removing a key barrier to iPhone and iPad adoption. Meanwhile, smart TVs and streaming dongles bundle cloud services into living-room screens, enabling session migration from pocket to couch without hardware investments. Cross-device progression mechanics tighten platform stickiness, bolstering lifetime value as users shift seamlessly from mobile to laptop or TV.
By Gamer Type: Casual Segment Leads Market Penetration
Casual players accounted for 46.51% of 2024 revenue, valuing convenience and variety more than ultra-high fidelity. Their willingness to explore multiple titles each month makes broad subscription libraries compelling, strengthening the United States cloud gaming market. Lifestyle gamers, whose play overlaps with social media creation and cross-play communities, will accelerate at a 47.98% CAGR.
Avid gamers generate the highest average revenue per user through premium tiers and microtransactions, but they demand low latency and expansive AAA catalogs. Regulatory focus on loot boxes could reshape monetization mechanics, yet engagement remains high where social competition thrives. Platforms that integrate esports events and creator tools can unlock outsized wallet share among lifestyle and avid cohorts.


By Business Model: Subscription Services Establish Market Foundation
Subscriptions captured 71.42% of spending in 2024 as predictable pricing aligns with consumer budgeting and platform retention goals. Microsoft integrates Game Pass into its console and PC ecosystems, demonstrating how bundled value drives adoption. Free-to-play and ad-supported offerings are expected to record a 52.46% CAGR, trading with lower barriers to entry for heightened ad-tech and micro-transaction complexity.
Pay-as-you-play approaches persist for occasional users and premium day-pass events; however, the limited breadth of the library limits stickiness. California’s AB 2426 mandate to clarify licensing versus ownership may influence messaging around perpetual access rights, nudging marketers to highlight service reliability over individual purchases.[3]Max Cherney, “Microsoft offers AMD alternative to Nvidia,” Reuters, reuters.com Source: California Legislature, “Assembly Bill 2426,” leginfo.legislature.ca.gov Balancing recurring revenue against flexible entry points remains central to the United States cloud gaming industry.
Geography Analysis
Major metropolitan areas, such as New York, Los Angeles, Chicago, and San Francisco, account for roughly 35% of the United States' cloud gaming market revenue, despite holding only one-fifth of the population. High fiber density, multi-gigabit plans, and early 5G rollouts enable premium 4K streams and competitive multiplayer experiences. Comcast’s Janus core virtualization now touches 63 million homes, while Verizon’s AI Connect extends GPU resources across 500,000 route-miles of fiber.
Suburban zones display rising adoption once multi-gigabit tiers drop below USD 70 per month and latency-optimized profiles become mainstream. Municipal fiber in markets such as Chattanooga and Cedar Falls seeds local play communities, proving that infrastructure competition boosts service quality and price dynamism. States such as Texas and Florida are seeing rapid edge node construction from AWS Wavelength and Microsoft Azure, further reducing latency for mid-tier cities.
Rural America remains constrained by last-mile limitations. The Broadband Equity Access and Deployment fund aims to close gaps, but construction timelines are expected to extend into 2030. Fixed-wireless access and low-Earth-orbit satellite plans provide interim relief yet struggle to sustain 35 Mbps at low jitter. Consequently, rural expansion will trail urban demand, capping aggregate user counts until scalable backhaul solutions emerge.
Competitive Landscape
The United States cloud gaming market shows moderate concentration. Microsoft, NVIDIA, and Amazon leverage hyperscale footprints and deep content catalogs, erecting high capital and licensing barriers. Microsoft alone deploys 500,000 NVIDIA GPUs across Azure, demonstrating the scale required for consistent 1080p and 4K streams. Amazon blends Luna with Twitch discovery funnels, tapping creator audiences that accelerate user acquisition.
Apple’s revised App Store policy opens iOS to third-party catalogs yet retains a 30% commission, shaping negotiations around channel economics. Samsung, LG, and Roku compete through embedded hubs, vying for a premium display share by emphasizing latency and controller compatibility.
Hardware suppliers diversify. AMD’s MI300X accelerators enter Azure to offset tight NVIDIA supply, offering 192 GB of HBM3e for graphics-intensive workloads. Start-ups exploit white-space niches, specializing in AI-aided encoding or per-minute billing engines suited for esports arenas. Antitrust scrutiny from the FTC and DOJ tempers large-scale acquisitions, preserving a field where mid-tier challengers can still secure venture funding.[4]Federal Trade Commission, “FTC challenges Microsoft’s acquisition of Activision Blizzard,” ftc.gov
United States Cloud Gaming Industry Leaders
Microsoft Corporation
NVIDIA Corporation
Amazon.com, Inc.
Sony Group Corporation
Alphabet Inc.
- *Disclaimer: Major Players sorted in no particular order

Recent Industry Developments
- March 2025: Comcast launched Ultra Low-Lag internet in Atlanta, Chicago, Philadelphia, and San Francisco, cutting working latency by 78% via L4S technology.
- February 2025: Verizon Business unveiled AI Connect, pairing private 5G with NVIDIA GPU-as-a-service resources across its fiber backbone.
- January 2025: Apple allowed native cloud gaming apps on the App Store, enabling in-app purchases and catalog browsing for services such as Xbox Game Pass and GeForce Now.
- December 2024: Comcast migrated its 5G mobile packet core to AWS, gaining autoscaling and network automation for Xfinity Mobile and Comcast Business Mobile subscribers.


United States Cloud Gaming Market Report Scope
| Video Streaming |
| File Streaming |
| Smartphones |
| Tablets |
| PCs and Laptops |
| Other Devices |
| Casual Gamers |
| Avid Gamers |
| Lifestyle Gamers |
| Subscription-Based |
| Pay-As-You-Play |
| Free-to-Play and Ad-Supported |
| By Type | Video Streaming |
| File Streaming | |
| By Device | Smartphones |
| Tablets | |
| PCs and Laptops | |
| Other Devices | |
| By Gamer Type | Casual Gamers |
| Avid Gamers | |
| Lifestyle Gamers | |
| By Business Model | Subscription-Based |
| Pay-As-You-Play | |
| Free-to-Play and Ad-Supported |


Key Questions Answered in the Report
How large is the United States cloud gaming market in 2025?
The market stands at USD 1.37 billion in 2025 with a projected CAGR of 46.23% through 2030.
Which device class contributes the most revenue?
Smartphones hold 38.21% share, driven by deep mobile penetration and recently relaxed app-store policies.
What business model dominates spending?
Subscription services supply 71.42% of revenue thanks to predictable pricing and expansive game catalogs.
How are 5G deployments influencing growth?
Sub-20 millisecond latency from 5G and edge nodes improves responsiveness, adding an estimated +8.2% to the market’s CAGR.
What inhibits adoption in rural regions?
Limited broadband access below 25 Mbps restricts 4K streams, exerting a -6.3% drag on long-term growth.
Who are the leading infrastructure suppliers?
Microsoft Azure, Amazon Web Services and NVIDIA remain pivotal, with AMD ascending via its MI300X accelerator line.
Page last updated on:


