
Immersive Virtual Reality Market Size and Share
Market Overview
| Study Period | 2020 - 2031 |
|---|---|
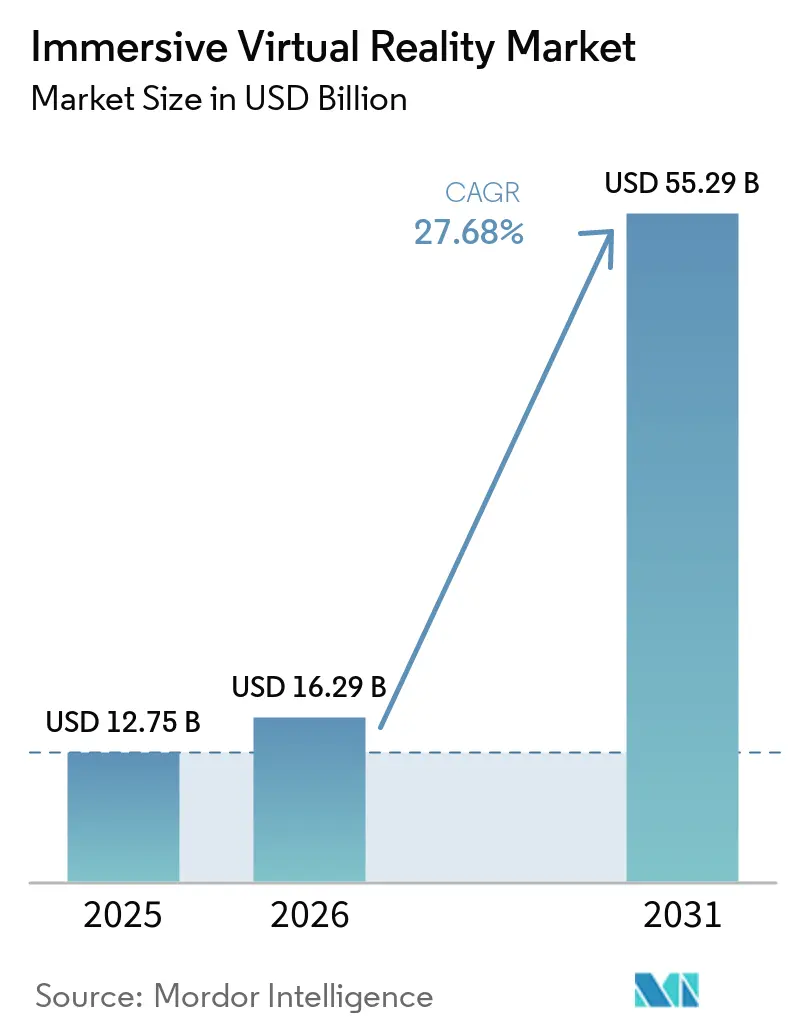
| Market Size (2026) | USD 16.29 Billion |
| Market Size (2031) | USD 55.29 Billion |
| Growth Rate (2026 - 2031) | 27.68 % |
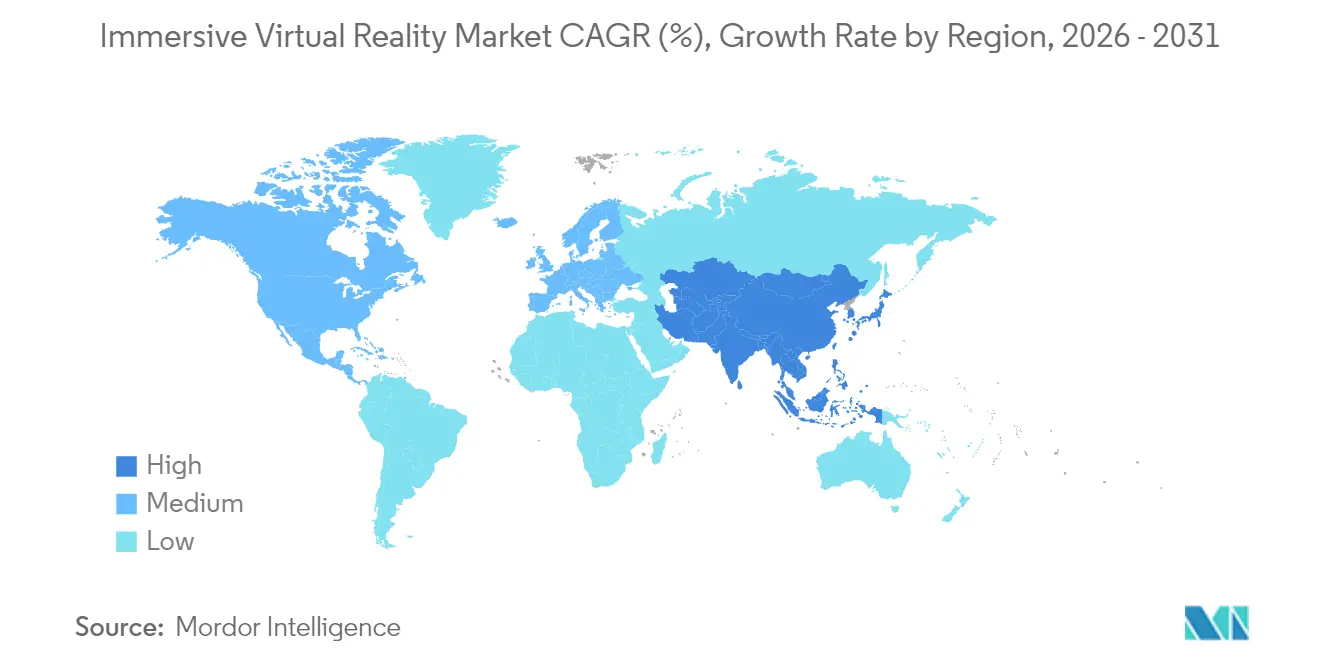
| Fastest Growing Market | Asia-Pacific |
| Largest Market | North America |
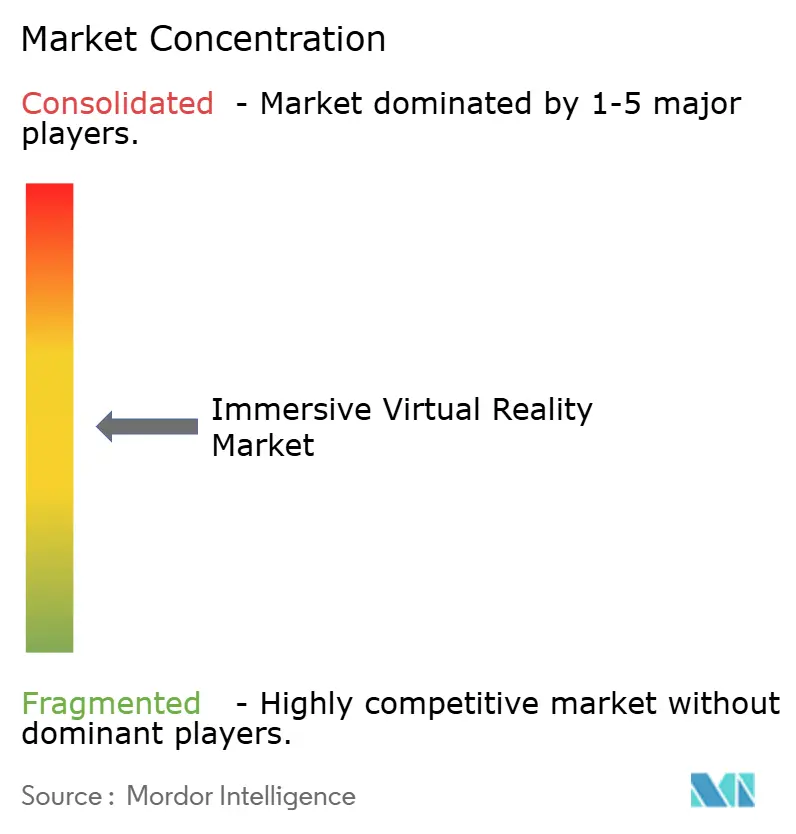
| Market Concentration | Medium |
Major Players *Disclaimer: Major Players sorted in no particular order Image © Mordor Intelligence. Reuse requires attribution under CC BY 4.0. | |
Immersive Virtual Reality Market Analysis by Mordor Intelligence
The Immersive Virtual Reality Market size is expected to grow from USD 12.75 billion in 2025 to USD 16.29 billion in 2026 and is forecast to reach USD 55.29 billion by 2031 at 27.68% CAGR over 2026-2031.
Commercial demand is expanding as enterprises shift from pilot programs to scaled roll-outs, particularly in aerospace flight simulation, defense pilot training, and regulated healthcare therapies. Head-mounted displays remain the dominant device form factor, yet stand-alone models are accelerating fastest as buyers value untethered set-ups that remove PC or console requirements. North America retains spending leadership, but Asia Pacific is growing more quickly on the back of Chinese government standardization initiatives and more than 100 large-scale VR installations launched in 2024. Momentum is also evident in enterprise ROI metrics, Walmart compressed training times by 96% and Boeing trimmed wiring-process instruction by 75% confirming cost savings that extend well beyond entertainment. Supply-side turbulence in semiconductors and high-purity quartz is lifting component costs, though software-delivered advances such as cloud streaming and AI-driven adaptive content help mitigate hardware price friction.
Key Report Takeaways
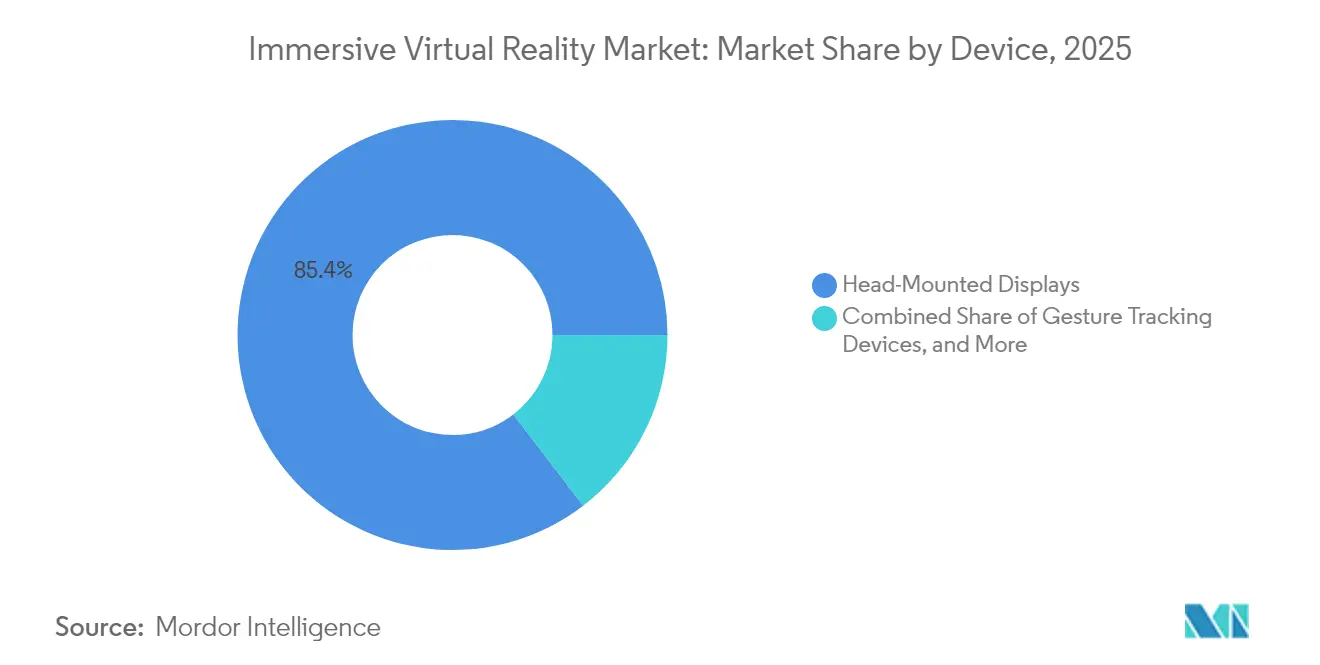
- By device, head-mounted displays captured 85.40% of immersive virtual reality market share in 2025, while stand-alone HMDs are forecast to grow at 32.20% CAGR to 2031.
- By end-user industry, entertainment and gaming held 45.55% revenue share in 2025; healthcare applications are positioned to expand at a 28.65% CAGR through 2031.
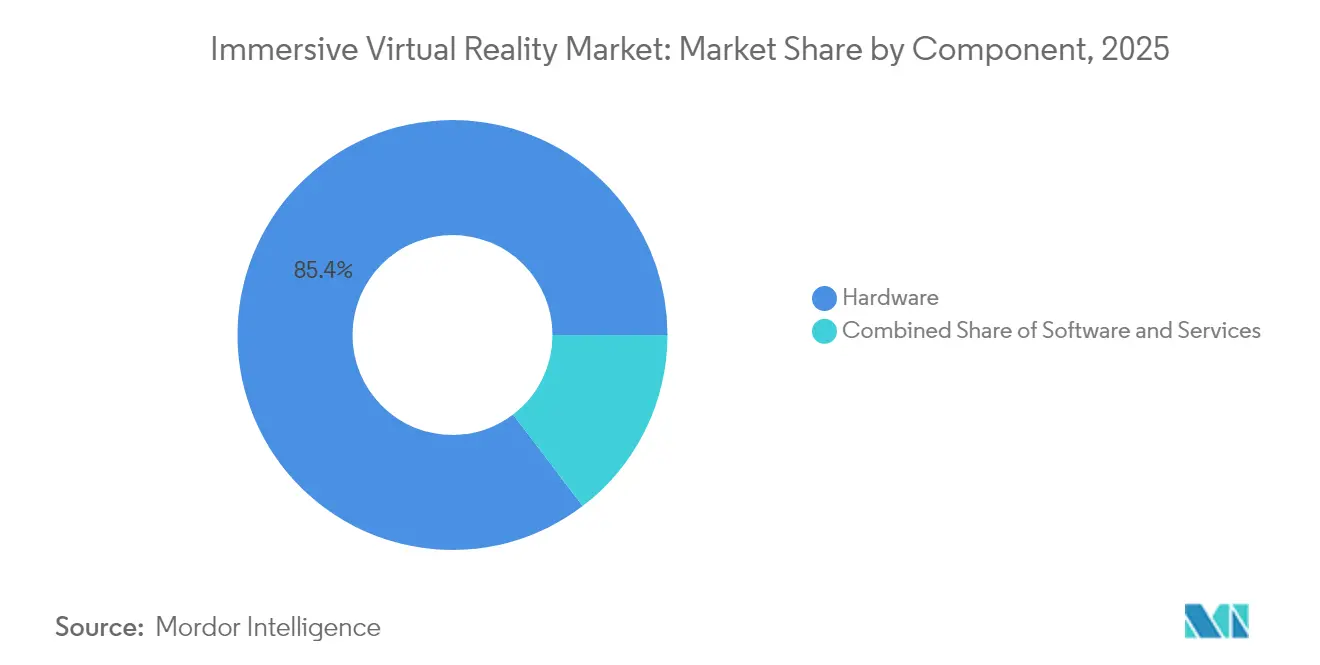
- By component, hardware held 85.35% revenue share in 2025; the software component is positioned to expand at a 28.22% CAGR through 2031.
- By immersion type, fully-immersive systems commanded a 61.40% share in 2025 and are projected to rise at a 30.55% CAGR to 2031.
- By geography, North America accounted for 37.60% of the immersive virtual reality market size in 2025, whereas Asia Pacific is set to advance at 31.85% CAGR over the same period.
Note: Market size and forecast figures in this report are generated using Mordor Intelligence’s proprietary estimation framework, updated with the latest available data and insights as of 2026.
Market Trends and Insights
Drivers Impact Analysis of Immersive Virtual Reality Market*
| Driver | (~) % Impact on CAGR Forecast | Geographic Relevance | Impact Timeline |
|---|---|---|---|
| Use of VR in aerospace and defence training | +4.80% | Global, concentrated in North America and Europe | Medium term (2-4 years) |
| Consumer adoption via gaming HMDs | +6.20% | Global, led by North America and Asia Pacific | Short term (≤ 2 years) |
| Government-funded VR healthcare therapy pilots | +3.50% | North America and Europe, expanding to Asia Pacific | Long term (≥ 4 years) |
| Enterprise metaverse platforms for remote collaboration | +5.10% | Global, enterprise-focused regions | Medium term (2-4 years) |
| Source: Mordor Intelligence | |||
Use of VR in Aerospace and Defence Training
Defense agencies are embedding immersive technologies, including simulators, into core training curricula. The U.S. Air Force deployed 225 VR devices under its Pilot Training Transformation initiative, while Mass Virtual secured USD 67 million in related contracts. Lockheed Martin and Red 6 integrated augmented overlays for the TF-50 trainer, and Vrgineers joined a Czech agreement to extend F-35 simulation capability. Regulatory alignment is advancing as the Federal Aviation Administration collaborates with Vertex Solutions and Varjo to update standards for civilian flight simulators. These moves shorten skill-acquisition cycles, reduce live-flight fuel spending, and underpin sustained growth for the immersive virtual reality market. Continued procurement pipelines in Europe and Asia reinforce the medium-term outlook.
Consumer Adoption via Gaming HMDs
Global VR headset shipments rose to 9.6 million units in 2024, with Meta holding 73% share and Apple’s Vision Pro securing a 5% premium niche despite a USD 3,499 price tag. Stand-alone HMDs are expanding at 33.20% CAGR as buyers favor cable-free use, yet lower-priced launches such as the Quest 3S did not fully offset holiday-season softness, suggesting that content breadth is as vital as price. China’s 105% tariffs on overseas hardware and regional GPU shortages risk lifting retail prices, but large-scale location-based VR experiences funded by local authorities continue to attract first-time users, supporting near-term unit growth. Accelerated 5G roll-out and cloud rendering will further lower performance barriers, sustaining momentum for the immersive virtual reality market.
Government-Funded VR Healthcare Therapy Pilots
Regulators are endorsing clinical efficacy claims. FDA authorization for RelieVRx analgesic therapy and DeepWell DTx biofeedback software validated immersive treatments for pain, stress, and hypertension. Click Therapeutics obtained clearance for a depression digital therapeutic, and the UK National Health Service approved gameChange for psychosis respite, opening reimbursement channels that de-risk hospital adoption[3]U.K. National Health Service, “gameChange VR Therapy Guidance,” nhs.uk. U.S. surgeons at UC San Diego and Cedars-Sinai introduced Vision Pro support to enhance intra-operative visualization, while insurers evaluate outcome-based payment models. These milestones extend addressable use cases, reinforcing long-term upside for the immersive virtual reality market.
Enterprise Metaverse Platforms for Remote Collaboration
Microsoft Mesh integration with Meta Quest headsets provides lifelike avatars and spatial audio that close gaps in remote teamwork. Walmart scaled VR instruction to 2.2 million associates, shrinking training time from eight hours to fifteen minutes and freeing instructors for higher-value tasks. Boeing’s wiring-process modules cut engineer onboarding by 75% and reduced rework costs, while Lufthansa employed mixed reality in cabin-crew instruction, saving 80% compared with conventional simulator sessions. Virtual reality remains an important technology in the immersive simulator market, while mixed-reality solutions are increasingly being used to combine digital instructions with physical assets. Immersive analytics tools such as ArborXR Insights integrate performance data into learning-management systems, improving ROI measurement and strengthening enterprise appetite for immersive solutions.
Restraints Impact Analysis of Immersive Virtual Reality Market*
| Restraint | (~) % Impact on CAGR Forecast | Geographic Relevance | Impact Timeline |
|---|---|---|---|
| High total cost of ownership of multi-sensory rigs | -3.20% | Global, particularly price-sensitive markets | Short term (≤ 2 years) |
| Content scarcity and ecosystem fragmentation | -2.80% | Global, more pronounced in emerging markets | Medium term (2-4 years) |
| Source: Mordor Intelligence | |||
High Total Cost of Ownership of Multi-Sensory Rigs
Apple Vision Pro’s bill of materials stands at USD 1,542, with micro-OLED displays alone forming 35% of the cost, underscoring how sophisticated optics inflate retail pricing. Hurricane Helene damaged North Carolina quartz mines that supply up to 90% of global high-purity quartz, vital for semiconductor photolithography, pushing component prices higher. Tariffs exceeding 100% on China-built headsets, plus GPU shortages after TSMC earthquake disruptions, elevate consumer and enterprise acquisition expenses. U.S. fabs operate at operating costs 35% above Asian peers, curbing domestic price relief. Enterprises respond with bulk pre-purchase contracts to lock in supply, yet near-term sticker shock trims adoption in price-sensitive regions and tempers the immersive virtual reality market trajectory.
Content Scarcity and Ecosystem Fragmentation
A thin library of enterprise-grade and regulatory-compliant applications limits daily use frequency. Meta Quest’s holiday app downloads slipped 27% year on year despite lower hardware prices, illustrating that price cannot compensate for content gaps. Healthcare developers navigate 18- to 24-month FDA trials, slowing roll-outs and constraining therapy catalog breadth[2]Frontiers in Virtual Reality, “Regulatory Pathways for Medical VR Content,” frontiersin.org. Enterprises face cross-platform trade-offs among Unity, Unreal Engine, and proprietary SDKs that inflate development budgets and fragment user bases. China’s state-funded cultural IP projects partially address shortages but often yield homogeneous experiences that hamper differentiation. Monetization remains largely one-time purchase, challenging sustainable studio economics and limiting medium-term growth for the immersive virtual reality market.
*Our forecasts treat driver/restraint impacts as directional, not additive. The impact forecasts reflect baseline growth, mix effects, and variable interactions.
Immersive Virtual Reality Market Segment Analysis
By Device:
Stand-Alone HMDs Widen Untethered AppealThe immersive virtual reality market size for head-mounted displays stood dominant in 2025 as the form factor secured 85.40% revenue share. Stand-alone variants are poised for the fastest climb, advancing at a projected 32.20% CAGR to 2031 as buyers gravitate toward wire-free operation that speeds initial set-up. Meta’s Quest line continues to hold 73% share of shipments, yet the USD 299 Quest 3S failed to ignite holiday demand, underscoring content rather than price as the limiting factor. Tethered rigs are losing favor as wireless streaming narrows latency, while smartphone-shell viewers retreat because dedicated hardware is more affordable and performant.
Gesture-tracking accessories and haptic gloves are gaining traction within enterprise training programs that need precise hand articulation. Patent filings from Meta, Sony, and Microsoft around tactile feedback elevate user immersion, though full-body suits remain niche given higher cost and cleaning complexity. VR cameras are selling into China’s location-based entertainment operators that launched over 100 venues in 2024, enriching local content capture. Component shortages tied to quartz mine disruptions can raise the bill of materials across all device classes yet advances in display yield and battery density are expected to moderate cost escalation after 2026, supporting broader device penetration into the immersive virtual reality market.



By End-User Industry:
Healthcare Surges on Regulatory TailwindsEntertainment and gaming retained a 45.55% share of the immersive virtual reality market size during 2025 as blockbuster titles and esports events anchored consumer spend. Healthcare, however, is tracking the steepest ascent, estimated to deliver a 28.65% CAGR through 2031 on the back of FDA and CE approvals that open reimbursement lanes. RelieVRx and DeepWell DTx clearances usher therapeutic content into pain management and mental health, shifting the segment from experimental to prescription territory.
Defense and aerospace continue to procure large simulator fleets, evidenced by 225 USAF training units already fielded, while education providers join the vanguard as Walmart, Boeing, and Bank of America quantify double-digit productivity lifts. Automotive firms like Lufthansa and CAE apply mixed reality to crew guidance and cockpit familiarization, and architecture studios leverage holographic walkthroughs to identify design flaws early. Retail engagement remains exploratory, held back by content costs and headset hygiene concerns. Manufacturing and energy majors such as BP roll out safety modules, demonstrating how healthcare’s validation effect is permeating adjacent sectors, which amplifies growth momentum for the immersive virtual reality market.
By Component:
Software Outpaces Hardware MaturityHardware still commands 85.35% revenue in 2025, yet software is expanding at a 28.22% CAGR as enterprises redirect budgets toward custom applications and analytics dashboards. Apple Vision Pro’s USD 1,542 component tally highlights the capital intensity required for micro-OLED and sensor stacks, explaining why vendors are racing to reduce optics prices. Samsung entered the fray in late 2024 with a Snapdragon XR2+ Gen 2-powered device but capped first-run volumes at 300,000 units due to supply constraints.
Software suppliers benefit from recurring license fees and faster release cycles unhampered by physical inventory. Device-management platforms such as ArborXR oversee more than 3,000 enterprise deployments, simplifying fleet updates and compliance reporting. Cloud-rendered streaming builds a thin-client paradigm that shifts compute overhead to the edge, helping buyers defer headset upgrades. AI accelerates content production through procedural world-building and adaptive learning scripts. Services revenues scale in tandem, covering systems integration and regulatory validation. As hardware shortages ease post-2026, balanced growth across components is expected to reinforce the immersive virtual reality market.
By Immersion Type:
Fully-Immersive Formats Sustain LeadFully-immersive environments accounted for 61.40% of 2025 revenue and are slated to climb at 30.55% CAGR as organizations favor total sensory isolation for high-risk simulation and therapeutic focus. Military pilots rely on panoramic displays and motion platforms that mirror G-force cues, while FDA-approved pain therapy depends on uninterrupted visual immersion to modulate neural pathways.
Semi-immersive solutions appeal to industrial training where some real-world awareness is required for safety, yet their share is flattening as hardware costs fall, and full immersion becomes affordable. Non-immersive desktop VR is declining as users migrate to head-mounted options with richer presence cues. Chinese culture parks showcase fully immersive story arcs blending scent, haptics, and volumetric capture, encouraging prolonged engagement. AI-enhanced motion prediction curbs cybersickness, addressing a lingering adoption hurdle. Cost inflation still affects fully-immersive systems more heavily due to multi-display rigs, but modular designs and cloud offloading are expected to narrow the gap, sustaining leadership for the immersive virtual reality market.
Geography Analysis
North America Immersive Virtual Reality Market
North America continued to lead the immersive virtual reality market with 37.60% revenue share in 2025, buoyed by substantial defense spending and early enterprise adoption. U.S. companies benefit from large pilot training budgets and healthcare reimbursement pipelines, although higher semiconductor fabrication costs raise hardware prices relative to Asian competitors. The region is leveraging cloud infrastructure and 5G roll-out to pilot remote rendering solutions that could offset device cost barriers. Corporate training programs at Walmart, Boeing, and Bank of America supply domestic proof points, reinforcing vendor focus on North American clients.
APAC Immersive Virtual Reality Market
Asia Pacific registered the highest regional CAGR at 31.85%, propelled by China’s structured metaverse policy framework and more than 100 large-scale VR installations commissioned in 2024. The Ministry of Industry and Information Technology formed a standards committee that aligns device protocols, while the National Film Administration encouraged VR cinema roll-outs. IDC projects regional AR/VR spending to surpass USD 10.5 billion by 2029, equal to 26.5% of global outlays. Japan and South Korea add momentum through government grants for education and smart-manufacturing pilots, and India’s cost-efficient developer pool accelerates localized content creation. Proximity to component supply chains helps mitigate freight delays, though natural disaster risks such as TSMC’s earthquake and typhoon-driven quartz disruptions remain operational concerns.
Europe Immersive Virtual Reality Market
Europe holds a strategic middle position, supported by the European Commission’s virtual worlds roadmap and Germany’s XR-Interaction network of 60 firms receiving multi-year state funding. The Virtual and Augmented Reality Industrial Coalition forecasts 860,000 new European jobs by 2025, signaling political will to compete with U.S. and Chinese ecosystems. The London School of Economics champions an “Airbus for the metaverse” to pool industrial expertise, while companies such as BMW, IKEA, and Bosch experiment with interoperable digital twins. Currency fluctuations and stricter privacy rules can slow consumer uptake, yet cross-border collaboration on standards and ethics enhances long-term regional competitiveness, sustaining European contribution to the immersive virtual reality market.

Regulatory Landscape
The regulatory environment for immersive VR is increasingly shaped by formal standards and AI governance rather than voluntary guidance. In 2024, ISO/IEC 5927:2024 added safety guidance for AR/VR usage (including vection and safe immersion), while ISO 9241-820:2024 reinforced ergonomics and human-systems interaction requirements for immersive environments, which affects procurement and risk controls for enterprise deployments.
National and regional rules are also tightening around immersive content creation and transparency. China published GB/T 44465-2024 on 2024-08-23 to specify VR/AR content production processes (effective 2025-03-01) and issued DY/Z 14.1-2026 (effective 2026-01-29) for technical requirements and safety management of virtual reality films. In Europe, the EU AI Act (Regulation (EU) 2024/1689) adds transparency obligations under Article 50 for certain AI systems used to generate or manipulate content in immersive contexts, with full application effective 2026-08-02, increasing compliance needs for VR platforms that use AI-driven content generation and avatar systems.
Value Chain Analysis
The immersive VR value chain spans component supply (optics, displays, sensors, chipsets), device OEM assembly (HMDs and peripherals), and content and software tooling (game engines, SDKs, device management, analytics). It also includes distribution (consumer retail, enterprise direct, integrators) and services (systems integration, training content creation, and regulatory validation in healthcare). Hardware costs remain concentrated in advanced optics and compute, while software and services capture more value through recurring licensing, fleet management, and workflow integration in regulated and safety-critical environments.
Partnerships increasingly connect adjacent links to reduce friction and scale faster. In January 2025, KION partnered with NVIDIA and Accenture to apply digital twins and physical AI-enabled robots to warehouse operations, positioning simulation and digital twins as upstream inputs that feed downstream XR training and operational workflows. In March 2025, Innoactive demonstrated XR streaming on Apple Vision Pro and Meta Quest 3 using NVIDIA Omniverse and OpenUSD, which underscores the growing role of cloud and streaming pipelines in decoupling experience quality from local device constraints. In April 2026, Unity extended a multi-year partnership with Meta, reinforcing engine-to-platform alignment for developer tooling and distribution, and in February 2026, Virtuix joined the Made for Meta program to certify peripheral compatibility, reflecting how platform programs shape accessory ecosystems and go-to-market routes.
Competitive Landscape
Market concentration is moderate as global technology leaders hold meaningful share, while specialized firms carve out vertical niches. Meta commands roughly 73% of head-set shipments through its Quest family, but Reality Labs continues to post heavy operating losses, surpassing USD 58 billion cumulatively since 2020. Apple’s Vision Pro captured 5% share within months, validating a premium productivity-and-healthcare orientation despite its elevated retail price[1]Apple Inc., “Introducing Vision Pro,” apple.com. Sony maintains a 9% presence through PlayStation VR2; however, shipment volume softened 25% in 2024 as consumers sought broader use cases beyond gaming.
Strategic partnerships underscore enterprise value. Microsoft and Meta co-develop workplace avatars via Mesh, while defense integrators Lockheed Martin and Red 6 incorporate AR overlays into trainer jets for the U.S. Air Force and Navy. Vrgineers collaborates on F-35 simulators, and Vertex Solutions supports FAA standard updates, cementing defense and aviation influence over feature roadmaps. RelieVRx and DeepWell DTx exemplify medical verticalization, obtaining regulatory clearance for pain and mental-health therapies that few broad-platform vendors pursue.
Mergers and acquisitions hint at consolidation: Google purchased part of HTC’s XR unit for USD 250 million to strengthen Android XR, and Infinite Reality acquired Landvault and The Drone Racing League in deals totalling USD 700 million to scale metaverse entertainment. Samsung, Qualcomm, and Qualcomm’s foundry partners are pushing chipset roadmaps that optimize AI inference on-device, reducing dependence on discrete GPUs and lowering bill of materials. Supply chain fragility remains a shared pain point, as quartz mine outages and tariff escalations pose price-eco-system risks but also encourage regional diversification. Overall, competitive positioning is fluid, yet sustained R&D and policy backing are likely to preserve a balanced landscape for the immersive virtual reality market.
Immersive Virtual Reality Industry Leaders
Carl Zeiss AG
Sony Corporation
EON Reality
Avegant Corporation
Samsung Electronics Co., Ltd.
- *Disclaimer: Major Players sorted in no particular order
Immersive Virtual Reality Market Companies Covered in this Report
- Meta Platforms Inc. (Oculus)
- Sony Corporation
- HTC Corporation
- Apple Inc.
- Samsung Electronics Co., Ltd.
- Microsoft Corporation
- Pico Interactive (ByteDance Ltd.)
- Valve Corporation
- Varjo Technologies Oy
- HP Inc.
- Carl Zeiss AG
- Avegant Corporation
- Varjo Technologies
- Vrgineers
- Magic Leap, Inc.
- Google LLC
- Eon Reality, Inc.
- CyberGlove Systems LLC
- Ultraleap Ltd. (Leap Motion)
- Sixense Enterprises Inc.
- Vuzix Corporation
- Lenovo Group Ltd.
- Ultraleap Ltd.

Market Opportunities and Future Outlook
Enterprise training and field enablement are a major whitespace area where immersive VR shifts from fixed simulator rooms to portable, headset-based programs across job sites and distributed workforces. In March 2026, John Deere unveiled an Extended Reality Training System for operator, dealer, and customer training on heavy machinery, which shows expansion beyond aviation, defense, and retail into industrial equipment workflows that benefit from repeatable, low-risk practice and standardized instruction.
Location-based immersive experiences and branded installations continue to broaden the addressable audience while creating additional content monetization pathways and local partnership opportunities. In March 2026, VIVERSE (HTC) launched a free-roam VR experience inside Osaka Castle, pointing to continued investment in high-footfall, venue-based formats. Large-scale public installations also support longer dwell times and new marketing and tourism channels, including Alibaba opening an AI and cloud-powered interactive installation in Milan in February 2026 tied to the Milano Cortina 2026 Winter Games. On the governance side, the proposed United States Leadership in Immersive Technology Act of 2025 (H.R. 2321/S. 1106) highlights policy attention to interagency coordination and competitiveness, pointing toward clearer frameworks that can reduce uncertainty around standards, safety, and responsible deployment.
Recent Industry Developments in Immersive Virtual Reality Market
- June 2026: Carl Zeiss Meditec AG announced a strategic collaboration with Envision Health Technologies to advance glaucoma care using gamified virtual reality for visual function testing. The collaboration expands VR use in regulated clinical workflows, linking immersive experiences to diagnostic pathways and specialized care delivery.
- December 2025: EON Reality introduced a National Spatial AI Infrastructure framework that connects Spatial AI Centers with technologies such as Sony Spatial Displays, VR labs, and hologram beacons. The initiative outlines multi-site rollout models that can accelerate enterprise and public-sector procurement by bundling hardware, software, and training content into an integrated infrastructure approach.
- April 2025: Sony Electronics released SDK version 2.5.0 for its Spatial Reality Displays (ELF-SR1 and ELF-SR2), adding enhancements such as stronger OpenXR support to improve compatibility for application developers. Standards-aligned tooling reduces development friction and supports cross-platform content pipelines that can extend immersive use cases beyond gaming.


Immersive Virtual Reality Market Report Scope and Research Methodology
Market Definition and Coverage
For this study, the immersive virtual reality market is defined as revenue generated from VR experiences that place the user inside a simulated environment through VR hardware, supporting software, and related services, across consumer and enterprise use cases.
Scope exclusions: We do not count augmented reality or mixed reality solutions, and we also remove non-VR display technologies that do not create a head tracked immersive experience.
Segments Covered in This Report
- By Device
- Head-Mounted Displays (HMDs)
- Stand-alone HMDs
- Tethered HMDs
- Smartphone-based HMDs
- Gesture Tracking Devices
- Haptic Gloves
- Motion Controllers
- Full-Body Suits
- Haptic Feedback Devices
- VR Cameras
- Head-Mounted Displays (HMDs)
- By End-user Industry
- Entertainment and Gaming
- Aerospace and Defence
- Healthcare
- Surgery and Medical Training
- Rehabilitation Therapy
- Mental Health and Pain Management
- Education and Training
- Automotive and Transportation
- Architecture, Engineering and Construction (AEC)
- Retail and E-commerce
- Other Industries
- By Component
- Hardware
- Software
- Services
- By Immersion Type
- Fully-Immersive
- Semi-Immersive
- Non-Immersive
- By Geography
- North America
- United States
- Canada
- Mexico
- South America
- Brazil
- Argentina
- Rest of South America
- Europe
- United Kingdom
- Germany
- France
- Italy
- Spain
- Rest of Europe
- Asia-Pacific
- China
- Japan
- South Korea
- India
- Rest of Asia-Pacific
- Middle East
- United Arab Emirates
- Saudi Arabia
- Turkey
- Rest of Middle East
- Africa
- South Africa
- Nigeria
- Kenya
- Rest of Africa
- North America
Data Sources, Market Sizing, and Validation
Desk Research
Desk research was used to set the fact base for demand signals, supply signals, and pricing direction, before modeling totals. We mainly referenced public sources such as the International Telecommunication Union (connectivity and device readiness), the World Bank (macro indicators), OECD datasets (digital economy indicators), and national statistical agencies including the US Bureau of Labor Statistics (wage and cost context). We also reviewed standards and safety publications available on open regulator portals.
To keep the model grounded in industry reality, we reviewed company filings and investor presentations, developer and standards body documentation, and reputable press coverage of headset launches and content ecosystem shifts. When needed, paid subscriptions that focus on company financials and intelligence, news and financials, and patent databases were used to cross-check timelines, product roadmaps, and commercialization pace. These examples are not exhaustive, and many other public sources were also used during data collection, validation, and clarification.
Primary Interviews and Surveys
Primary work focused on validating what desk research cannot show cleanly, such as adoption timing, average selling price direction, and how revenue is split between hardware, software, and services across real buying cycles. We spoke with a mix of device ecosystem participants, software and content stakeholders, and enterprise buyers, then checked consistency across APAC, EMEA, and the Americas to reduce single region bias.
Distribution of primary research fieldwork respondents
| Company type | Respondent position | Region |
|---|---|---|
| Top tier: 28% | CXOs: 13% | APAC: 48% |
| Mid tier: 56% | Functional/Unit leaders: 32% | EMEA: 32% |
| Smaller Players: 16% | Managers: 55% | Americas: 20% |
Market-Sizing & Forecasting
The core model uses a top-down approach where device shipment and installed base signals are reconstructed by region, and then translated into market value using adoption rates by use case and blended ASPs across headsets and supporting software and services. To keep the totals realistic, we used selective bottom-up checks as cross-references, including sampling average headset prices, mapping typical enterprise seat counts for training deployments, and testing a supplier and channel roll-up in a few high visibility countries.
Inputs were selected because they are measurable and can be refreshed regularly. These include headset shipment momentum, installed base replacement cycles, content and app monetization trends, enterprise training spend intensity, and connectivity readiness, since connectivity affects usable VR hours and content quality. Forecasts were built using scenario analysis, where key drivers such as ASP erosion, enterprise penetration, and consumer upgrade cycles are flexed, then aligned to what interviewees expect over the next few years. When a country level data point was missing, we used proxy indicators like smartphone and PC penetration, gaming spend, and enterprise digital training adoption, then adjusted them after regional validation calls.
Data Validation & Update Cycle
Outputs are checked against independent signals such as major device launch timing, pricing moves in key headset tiers, and macro demand shifts reflected in consumer electronics and enterprise IT spending. If there are variances, we investigate them through back checks on assumptions, then review the calculations again by another analyst so calculation errors and overly optimistic adoption curves can be caught before sign-off.
The model is refreshed on an annual cycle, and interim updates are triggered when a material event changes the market math, such as a sharp ASP reset, supply disruption, or a step change in enterprise deployment. Right before delivery, a final review pass is completed so clients receive the most current view possible.
Mordor Intelligence's Immersive Virtual Reality Market Sizing Compared With Other Published Estimates
Published market values for immersive virtual reality can look far apart because each publisher draws the line differently on what counts as immersive, and they also vary on which revenue streams are treated as part of the market. Differences also come from the base year used, the way currency conversion is handled, and whether estimates are refreshed after major headset and platform changes.
A common gap driver in this market is whether non-immersive VR, adjacent AR spending, and broad immersive tech categories are rolled into the same number, which can inflate totals without a clear link to headset led usage. Another driver is ASP logic, where some models keep prices flat or apply aggressive price drops without checking channel reality, and then forecasts diverge further when adoption is assumed to accelerate uniformly across regions.
Benchmark comparison
| Source | Market Size | Gaps in Research Methodology |
|---|---|---|
| Mordor Intelligence | USD 16.29 B (2026) | |
| Industry Publisher A | USD 20.20 B (2024) | Uses an earlier base year and may blend broader device and use case revenue pools, where the immersive definition can include non-immersive technology buckets and a wider set of end uses, thereby lifting the starting value. |
| Research Portal B | USD 15.72 B (2025) | Long horizon forecasts can dilute near term cycle effects, and the model typically relies on slower growth assumptions with limited visibility into headset replacement cycles and software monetization checks across regions. |
The spread is mainly explained by what gets counted as immersive VR and how pricing and adoption are updated after product cycles, which is why the model stays tied to headset installed base, replacement timing, and blended ASP checks before totals are finalized by Mordor Intelligence.


Key Questions Answered in the Report
What is the current size of the immersive virtual reality market?
The market is valued at USD 16.29 billion in 2026 and is projected to reach USD 55.29 billion by 2031, growing at a 27.68% CAGR.
Which device category leads the immersive virtual reality market?
Head-mounted displays remain dominant, holding 85.40% revenue share in 2025, while stand-alone models are growing at 32.20% CAGR.
Why is healthcare considered the fastest-growing end-user segment?
FDA and CE approvals for therapies such as RelieVRx and DeepWell DTx have unlocked reimbursement pathways, accelerating a 28.65% CAGR for healthcare applications through 2031.
Which region is expanding fastest in immersive virtual reality adoption?
Asia Pacific is advancing at a 31.85% CAGR due to Chinese government support and extensive location-based VR installations.
What are the main restraints hindering market growth?
High ownership costs for advanced rigs and a limited content ecosystem slow near-term adoption, trimming CAGR by an estimated 3.2% and 2.8%, respectively.
How are enterprises measuring ROI from immersive virtual reality deployments?
Savings include a 96%-time reduction in Walmart retail training and 75% efficiency gains in Boeing engineering programs, demonstrating rapid payback periods for large-scale roll-outs.
Page last updated on:


 Your data is secure and never sold or shared.


