Location-Based VR Market Size and Share
Market Overview
| Study Period | 2020 - 2031 |
|---|---|
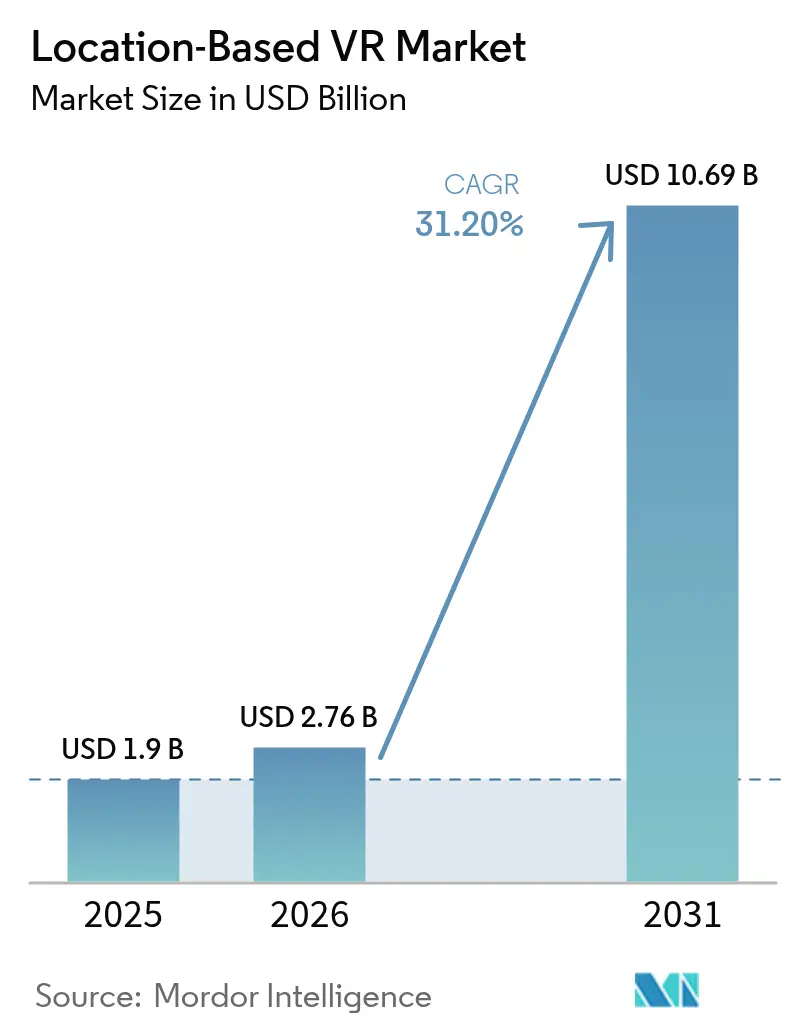
| Market Size (2026) | USD 2.76 Billion |
| Market Size (2031) | USD 10.69 Billion |
| Growth Rate (2026 - 2031) | 31.20% CAGR |
| Fastest Growing Market | Middle East and Africa |
| Largest Market | Asia Pacific |
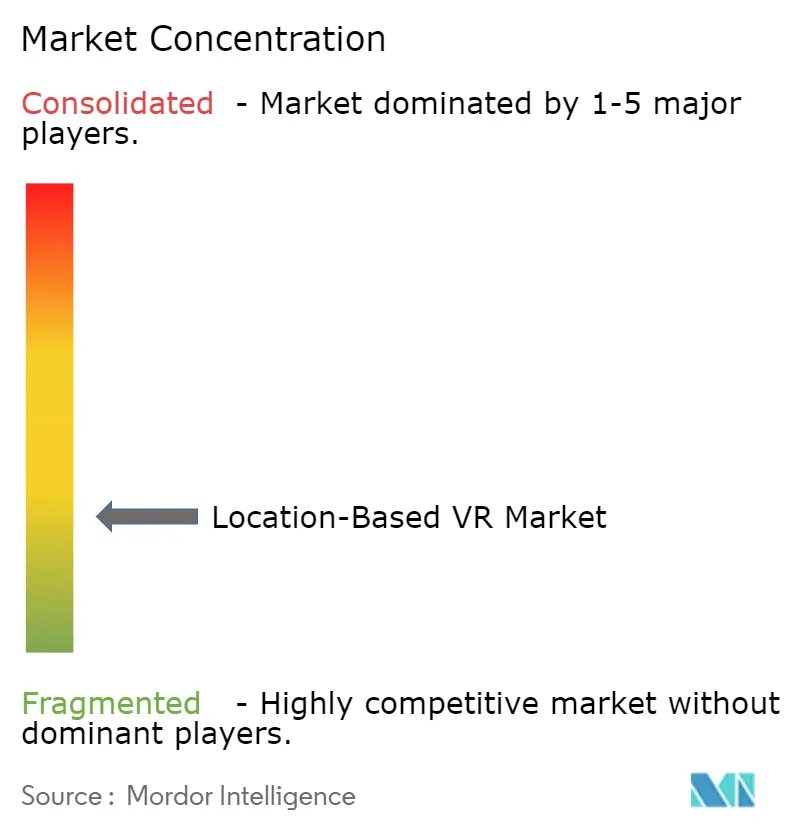
| Market Concentration | Low |
Major Players *Disclaimer: Major Players sorted in no particular order Image © Mordor Intelligence. Reuse requires attribution under CC BY 4.0. | |
Location-Based VR Market Analysis by Mordor Intelligence
The location-based VR market size was valued at USD 1.90 billion in 2025, is estimated at USD 2.76 billion in 2026, and is forecast to reach USD 10.69 billion by 2031, expanding at a CAGR of 31.1% from 2026 to 2031. Operators benefit from rapid headset price declines, carrier-grade edge streaming, and the global licensing of blockbuster intellectual property. Lower hardware costs shorten payback periods, while 5G-based rendering services cut local server expense and ease multi-site expansion. Franchises built on familiar film and game brands raise ticket prices and boost repeat visits, intensifying competition among venue owners. Independent franchisees now challenge venture-backed chains for prime retail space, encouraged by standard turnkey licensing packages and bank-friendly cost structures. Growing consumer demand for immersive out-of-home experiences, rising tourism investments in mixed-use mega projects, and municipal grants aimed at urban revitalization create multi-year growth avenues. Yet elevated lease rates in tier-one cities, premium insurance requirements, and the lingering 20% tariff on Chinese optical components still strain operator margins. Content differentiation, cloud-rendering adoption, and strategic geographic placement remain vital levers for defending profitability in the crowded location-based VR market.
Key Report Takeaways
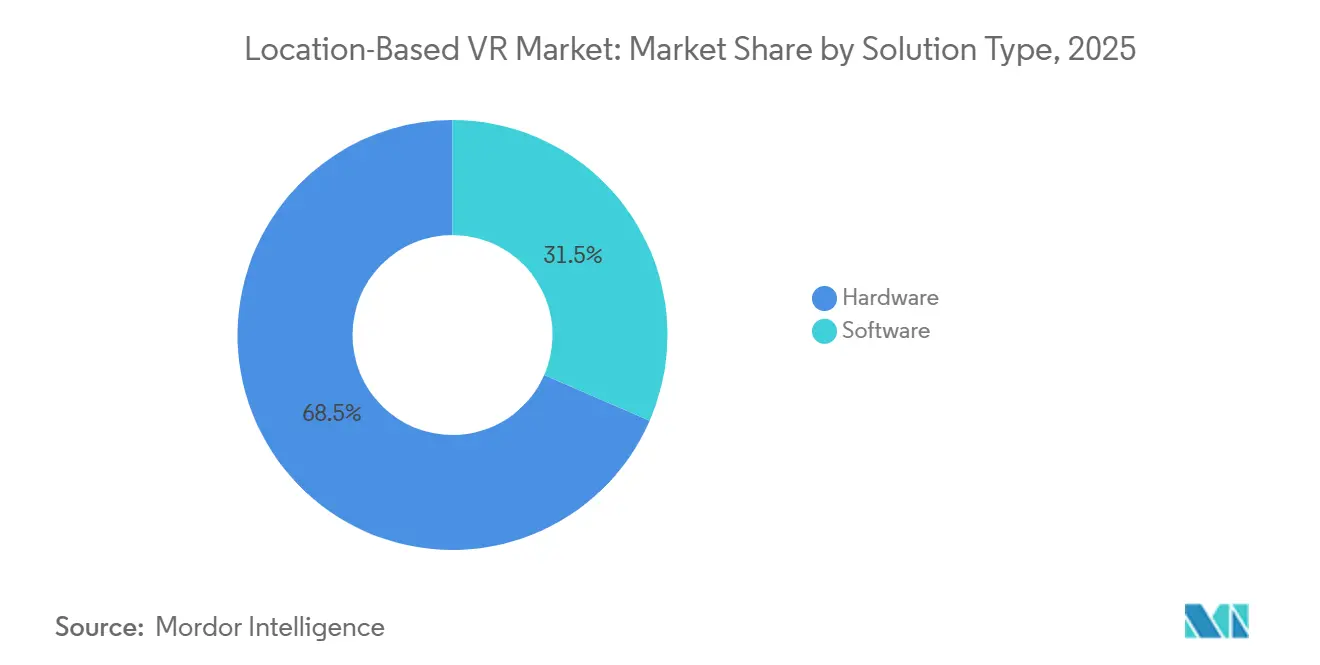
- By solution type, hardware captured 68.47% of 2025 revenue, while software is advancing at a 31.98% CAGR through 2031.
- By application, VR arcades led with 45.21% revenue share in 2025, whereas free-roam arenas are forecast to expand at 31.54% CAGR over 2026-2031.
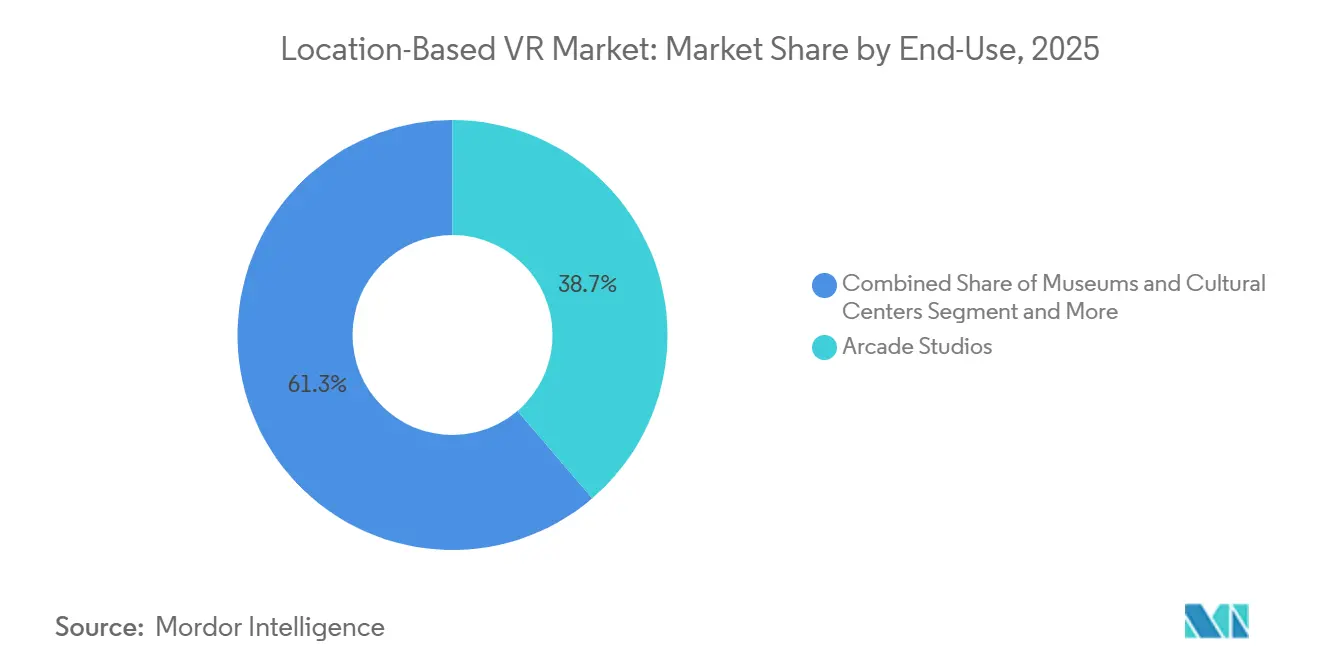
- By end-use, arcade studios commanded 38.73% of 2025 installations, and museums and cultural centers are projected to grow at 31.63% CAGR to 2031.
- By technology, three-dimensional rendering held 57.54% of 2025 revenue, yet cloud-merged reality is poised to climb at 31.74% CAGR during the forecast period.
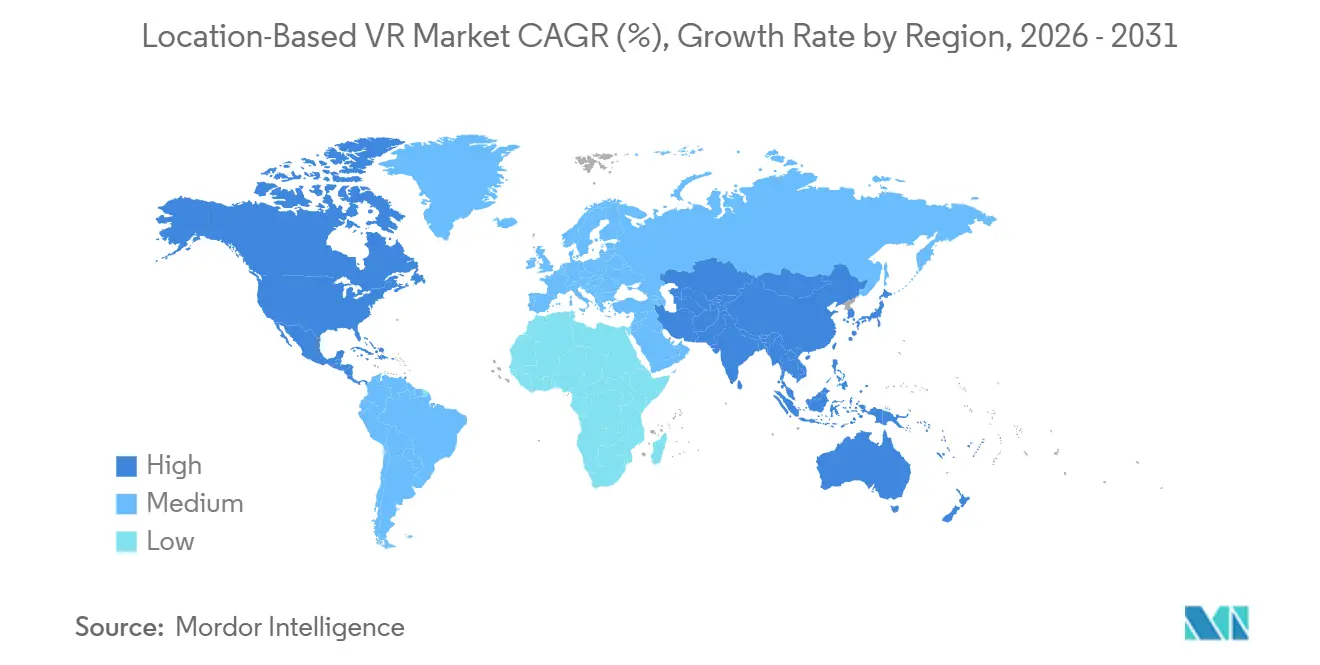
- By geography, Asia-Pacific accounted for 42.11% of global revenue in 2025, while the Middle East and Africa region is expected to post the fastest 31.84% CAGR through 2031.
Note: Market size and forecast figures in this report are generated using Mordor Intelligence’s proprietary estimation framework, updated with the latest available data and insights as of 2026.
Global Location-Based VR Market Trends and Insights
Drivers Impact Analysis*
| Driver | (~) % Impact on CAGR Forecast | Geographic Relevance | Impact Timeline |
|---|---|---|---|
| Rapid Hardware Cost Decline Improving ROI for Operators | +8.20% | Global, with pronounced effects in North America and Asia-Pacific | Short term (≤ 2 years) |
| Growing Consumer Appetite for Immersive Out-of-Home Experiences | +7.50% | Global, particularly urban centers in Europe, North America, and Asia-Pacific | Medium term (2-4 years) |
| Content Partnerships with Blockbuster IP | +6.80% | North America and Europe, expanding to Asia-Pacific | Medium term (2-4 years) |
| 5G Edge Streaming Lowers In-Venue Compute Costs | +5.90% | Asia-Pacific core, spill-over to Middle East and North America | Long term (≥ 4 years) |
| Urban Revitalization Grants for Experiential Venues | +2.10% | North America, selective European municipalities | Short term (≤ 2 years) |
| Syndicated Licensing Models Enabling Independent Operators | +1.80% | Global, with early traction in North America and Australia | Medium term (2-4 years) |
| Source: Mordor Intelligence | |||
Rapid Hardware Cost Decline Improving ROI for Operators
Headset prices fell from more than USD 1,500 in 2024 to USD 249 for Meta Quest 3S door-buster sales in late 2025, shrinking break-even times from 18 to 12 months in high-footfall malls.[1]ANVIO, “How Much Does It Cost to Open a VR Arcade?,” anvio.com Pancake-lens economies of scale and Snapdragon XR2 chipset commoditization explain much of the deflation. Pico’s Project Swan, arriving in 2026 at a projected USD 1,500–2,000, targets the premium tier yet still prices far below legacy enterprise gear. Venue owners now redirect capital to premium content licenses and thematic buildouts, cementing a virtuous cycle of faster payback, franchise expansion, and vendor competition. Banks respond by extending conventional small-business loans, replacing earlier reliance on venture equity. The location-based VR market benefits as lower start-up hurdles invite a wider pool of entrepreneurs.
Growing Consumer Appetite for Immersive Out-of-Home Experiences
Universal’s Epic Universe theme park, which opened in May 2025, features VR zones that lengthen visitor dwell time and lift per-capita spending. Sandbox VR leveraged Netflix franchises such as Stranger Things to raise repeat visitation 30% above generic shooter titles, converting streaming fandom into arcade footfall.[2]Sandbox VR, “Netflix Partnerships,” sandboxvr.com Louvre Abu Dhabi’s Quantum Dome and the Prado’s mixed-reality tours show cultural institutions adopting VR to attract younger demographics. Session prices of USD 40–60 remain palatable when paired with recognized brands, keeping discretionary spending resilient despite macro uncertainties. The shift toward experience-over-ownership spending underpins multi-year demand for premium out-of-home VR venues.
Content Partnerships with Blockbuster IP
Sandbox VR, Dreamscape Immersive, and Universal Studios all anchor attractions around established cinematic storylines. Session fees rise 25–40% over generic titles, and operators capture organic social marketing as guests share recognizable scenes online. Multi-year agreements with rights holders offer cost certainty and seasonal refresh windows that align with streaming or theatrical release calendars. Operators lacking branded content risk price wars and shorter customer lifecycles. As license availability tightens, pre-emptive deals become a strategic barrier to entry in the location-based VR market.
5G Edge Streaming Lowers In-Venue Compute Costs
ZTE and China Telecom proved sub-20 ms multi-user latency in a 2025 field trial, confirming that carrier-side rendering can match fiber backhauls.[3]IEEE Xplore, “5G-Advanced Multi-User VR Demonstrations,” ieeexplore.ieee.org NVIDIA CloudXR and Varjo Reality Cloud extend the service globally, trimming per-play-zone workstation costs of USD 5,000+ and converting capex into scalable opex. India’s August 2025 release of 6 GHz Wi-Fi 6E removed cable management headaches in free-roam arenas. Lower technical friction helps franchisees open in secondary city malls that lacked enterprise networking budgets. Over time, operators gain geographic reach while maintaining synchronized content updates.
Restraints Impact Analysis*
| Restraint | (~) % Impact on CAGR Forecast | Geographic Relevance | Impact Timeline |
|---|---|---|---|
| High Up-Front Capex and Maintenance | -3.40% | Global, acute in emerging markets with limited financing | Medium term (2-4 years) |
| Limited Premium Multiplayer Content | -2.70% | Global, most visible in Asia-Pacific and Europe | Short term (≤ 2 years) |
| Rising Insurance and Liability Premiums | -1.60% | North America and Europe | Short term (≤ 2 years) |
| Semiconductor Export Tariffs on Optical Components | -1.20% | Global, concentrated impact on operators sourcing Chinese head-mounted displays | Short term (≤ 2 years) |
| Source: Mordor Intelligence | |||
High Up-Front Capex and Maintenance
Total launch budgets of USD 100,000–300,000 still deter many first-time entrants. Ongoing upkeep, from lens swaps to motion-camera calibration, adds labour overhead and unplanned downtime. Franchise models ease some pain by bundling support, yet monthly royalties dilute margin when utilization dips below 60%. Credit access remains tight in markets where VR arcades lack collateralizable assets. Until headset life cycles lengthen and turnkey packages lower royalty cuts, capex hurdles will cap the absolute number of new venues in the location-based VR market.
### Limited Premium Multiplayer Content
Smaller operators rely on Viveport Arcade’s 700-title catalogue, where generic shooters dominate and revenue splits favour the platform. AAA studios hesitate to build location-based exclusives because hardware specs, play-area sizes, and tracking systems vary widely. Shallow content pools weaken novelty, pushing frequent guests toward competing attractions such as karaoke boxes or escape rooms. Without steady inflow of new licensed titles, repeat revenue growth slows, and customer acquisition costs climb.
*Our forecasts treat driver/restraint impacts as directional, not additive. The impact forecasts reflect baseline growth, mix effects, and variable interactions.
Segment Analysis
By Solution Type: Software Monetization Outpaces Hardware Sales
Hardware held 68.47% revenue share in 2025, anchored by head-mounted displays that averaged USD 300 per unit. Software, however, is projected to climb at 31.98% CAGR, highlighting the pivot toward recurring subscription and licensing income. Content libraries, platform access, and cloud-rendering fees together reshape top-line composition, moving the location-based VR market size away from one-time kit sales. Operators embrace diversified software stacks to keep venues fresh, while headset suppliers squeeze margins to protect shipment scale. Competitive intensity in the headset subsegment remains high, yet value pools migrate toward content aggregation and rendering-as-a-service agreements that deepen client lock-in.
The shift favours aggregators such as Viveport Arcade and turnkey franchisors like Zero Latency. Their scalable royalty frameworks limit up-front risk for entrepreneurs and improve forecast precision for lenders. As cloud-merged reality offloads compute, software vendors can price by concurrent user rather than by seat license, smoothing revenue recognition. Continued headset commoditization will keep hardware share sliding, and the location-based VR market share commanded by software providers will rise accordingly.


By Application: Free-Roam Arenas Challenge Arcade Incumbents
Traditional VR arcades generated 45.21% of 2025 application revenue, supported by low start-up costs and mall foot traffic. Free-roam arenas, forecast to grow at 31.54% CAGR, offer warehouse-scale play zones that fetch USD 50–70 session fees and deliver longer dwell times. Flexible 10 × 10 m or 14 × 7 m configurations raise throughput per square meter, enabling franchise owners to meet rising rent. The “walk-anywhere” freedom differentiates these venues from sit-down booths and commands social media buzz, drawing new demographics into the location-based VR market.
Theme-park integrations such as Saudi Arabia’s Six Flags Qiddiya and Universal’s Epic Universe show a blended future: free-roam arenas complement roller coasters and esports zones, flattening seasonal demand swings. VR cinemas and esports lounges remain niche but present additive revenue when bundled in mixed-entertainment districts. Over time, application diversification stabilizes cash flow and cushions shocks from single-format obsolescence.
By End-Use: Museums Accelerate Adoption for Cultural Engagement
Arcade studios represented 38.73% of installations in 2025 thanks to franchise packages and favourable mall leases. Yet museums and cultural centers are tracked to grow at a 31.63% CAGR, using VR to modernize exhibits and justify premium admission tiers. High-resolution headsets overlay context onto artworks, extending visit duration and improving educational value. Military and corporate training buyers provide steady, off-peak utilization that insulates venues from consumer seasonality.
Amusement parks deploy VR overlays on roller coasters or as stand-alone dark-ride attractions, boosting attendance metrics without major civil construction. Cinemas could re-enter the scene by converting auditoriums into synchronized group VR environments once headset hygiene protocols mature. Long term, cultural and institutional contracts give operators baseline revenue, while entertainment venues supply high-margin peak traffic, balancing the overall location-based VR industry portfolio.

By Technology: Cloud-Merged Reality Redefines Infrastructure Economics
Three-dimensional rendering still accounts for 57.54% of 2025 technology revenue, reflecting the legacy pipeline of stereoscopic engines. Cloud-merged reality, growing at 31.74% CAGR, leverages edge render farms to stream photorealistic scenes without local GPU clusters. This architecture lowers capex and supports frequent content refreshes, reducing guest fatigue. Wi-Fi 6E adoption after India's 6 GHz approval in August 2025 eliminates tethering, smoothing user flow inside arenas. Technology suppliers now package headsets, tracking cameras, and subscription access into unified bundles, lowering procurement friction for franchisees and driving broader penetration of cloud-first workflows within the location-based VR market.
Two-dimensional VR persists in documentary and educational content where depth cues offer minimal value, allowing operators with budget limits to run on entry-level GPUs. Yet, as cloud-merged pipelines improve both fidelity and operational economics, the medium is expected to overtake stand-alone stereoscopic rigs in new venue rollouts by the late 2020s.
Geography Analysis
Asia-Pacific contributed 42.11% of global 2025 revenue, fuelled by dense Chinese arcade networks, Japan’s tech-savvy gamer base, and India’s Wi-Fi 6E rollout that unlocked cable-free arenas. Chinese semiconductor policies create supply uncertainty, yet low lease costs in tier-three cities attract budget operators. Australia’s franchise-friendly regulations and South Korea’s esports culture further extend regional momentum. The location-based VR market size in Asia-Pacific benefits from strong youth demographics and smartphone penetration that primes consumers for immersive spending.
The Middle East and Africa region is forecast to post a 31.84% CAGR, anchored by Saudi Arabia’s 360 km² Qiddiya City and UAE mall partnerships that insert VR into luxury retail tourism. Morocco’s 2025 venue launch validated appetite in North Africa, while South African telecom-sponsored tournaments hint at future carrier-managed growth. Currency volatility in Nigeria and Egypt slows imports, yet headset prices below USD 200 could unlock pent-up demand over time.
North America remains a franchise magnet thanks to accessible bank debt and consistent USD 40–60 session pricing. Urban revitalization grants, such as New Jersey’s USD 4.2 million Atlantic City award, incentivize experiential tenants that act as anchor draws in aging malls. Europe mirrors the U.S. in maturity but faces higher insurance costs and stricter safety codes. South America trails as import duties and currency swings hinder component flow, though affluent enclaves in São Paulo and Buenos Aires sustain boutique operators that test concepts for future scale.

Competitive Landscape
The location-based VR market remains fragmented, with no player exceeding a 15% global installation share. Sandbox VR reported USD 200 million lifetime sales and lists 127 additional locations in its pipeline, relying on franchise agreements that transfer build-out risk to local investors. Zero Latency VR Pty Ltd operates 116 venues and 35 more in development across 30 countries, using a USD 165,000 upfront plus 16% revenue-share model to scale without ballooning corporate capex. Hologate GmbH touts 500+ turnkey pods in 70 countries, bundling hardware and content as a monthly subscription to smooth revenue and attract family-entertainment-center owners.
Emerging disruptors include ACCIONA S.A., which digitizes museum collections for immersive tours, and EVA (Esports Virtual Arenas), which targets competitive gamers in 5,000 ft² lounges. Technology partnerships figure prominently: Zero Latency’s Generation 3 wireless tracking eliminates cables, while NVIDIA’s CloudXR and Varjo Reality Cloud deliver leased GPU horsepower. Insurers such as K&K Insurance adapt products to the sector’s unique liability profile, enabling operators to scale within clearer risk frameworks.
Overall, growth hinges on exclusive content pipelines, cloud-rendering agility, and the franchisor’s ability to secure well-located real estate before rivals saturate prime corridors. The top five groups collectively hold well below 30% of global installations, underscoring ample white space for consolidation or niche specialization.
Location-Based VR Industry Leaders
EXIT VR
Springboard VR (Vertigo Games)
Zero Latency Pty. Ltd.
Survios, Inc.
Tyffon Inc.
- *Disclaimer: Major Players sorted in no particular order

Recent Industry Developments
- April 2025: Sandbox VR surpassed USD 200 million in lifetime revenue with 127 locations in the pipeline, underscoring sustained consumer interest in premium VR outings.
- March 2025: Sandbox VR and JLG Ventures revealed plans for a flagship Manhattan site that integrates hospitality know-how for high-rent urban markets.
- January 2025: Sandbox VR raised USD 6.8 million through a convertible note led by Gobi Partners to accelerate franchise growth toward 200 projected venues by 2027.
- November 2025: The Park Playground opened Player One VR World in Hollywood, featuring twin free-roam fields and an e-sports oriented Nanoclash Focus arena.


Global Location-Based VR Market Report Scope
The Location-Based VR Market Report is Segmented by Solution Type (Hardware, Software), Application (VR Arcades, VR Theme Parks, VR Cinemas, Free-Roam Arenas, VR Esports Lounges, Educational and Training Centers), End-Use (Amusement Parks, Arcade Studios, Cinemas, Museums and Cultural Centers, Commercial and Retail Venues, Military and Training Facilities), Technology (2D, 3D, Cloud-Merged Reality), and Geography (North America, South America, Europe, Asia-Pacific, Middle East, Africa). The Market Forecasts are Provided in Terms of Value (USD).
| Hardware | Head-Mounted Displays |
| Head-Up Displays | |
| Glasses | |
| Sensors | |
| Cameras | |
| Software |
| VR Arcades |
| VR Theme Parks |
| VR Cinemas |
| Free-Roam Arenas |
| VR Esports Lounges |
| Educational and Training Centers |
| Amusement Parks |
| Arcade Studios |
| Cinemas |
| Museums and Cultural Centers |
| Commercial and Retail Venues |
| Military and Training Facilities |
| 2D |
| 3D |
| Cloud-Merged Reality |
| North America | United States |
| Canada | |
| Mexico | |
| South America | Brazil |
| Argentina | |
| Rest of South America | |
| Europe | Germany |
| France | |
| United Kingdom | |
| Italy | |
| Spain | |
| Russia | |
| Rest of Europe | |
| Asia-Pacific | China |
| Japan | |
| South Korea | |
| India | |
| Australia | |
| Rest of Asia-Pacific | |
| Middle East | United Arab Emirates |
| Saudi Arabia | |
| Turkey | |
| Rest of Middle East | |
| Africa | South Africa |
| Nigeria | |
| Egypt | |
| Rest of Africa |
| By Solution Type | Hardware | Head-Mounted Displays |
| Head-Up Displays | ||
| Glasses | ||
| Sensors | ||
| Cameras | ||
| Software | ||
| By Application | VR Arcades | |
| VR Theme Parks | ||
| VR Cinemas | ||
| Free-Roam Arenas | ||
| VR Esports Lounges | ||
| Educational and Training Centers | ||
| By End-Use | Amusement Parks | |
| Arcade Studios | ||
| Cinemas | ||
| Museums and Cultural Centers | ||
| Commercial and Retail Venues | ||
| Military and Training Facilities | ||
| By Technology | 2D | |
| 3D | ||
| Cloud-Merged Reality | ||
| By Geography | North America | United States |
| Canada | ||
| Mexico | ||
| South America | Brazil | |
| Argentina | ||
| Rest of South America | ||
| Europe | Germany | |
| France | ||
| United Kingdom | ||
| Italy | ||
| Spain | ||
| Russia | ||
| Rest of Europe | ||
| Asia-Pacific | China | |
| Japan | ||
| South Korea | ||
| India | ||
| Australia | ||
| Rest of Asia-Pacific | ||
| Middle East | United Arab Emirates | |
| Saudi Arabia | ||
| Turkey | ||
| Rest of Middle East | ||
| Africa | South Africa | |
| Nigeria | ||
| Egypt | ||
| Rest of Africa | ||


Key Questions Answered in the Report
What is the projected revenue for location-based VR by 2031?
The location-based VR market size is forecast to reach USD 10.69 billion by 2031, growing at a 31.1% CAGR over 2026-2031.
Which region grows fastest between 2026 and 2031?
The Middle East and Africa are expected to record the highest 31.84% CAGR, led by mega-projects such as Saudi Arabias Qiddiya City.
Which application will outpace others in growth?
Free-roam arenas are poised to expand at a 31.54% CAGR, challenging traditional VR arcades for share.
Why are museums adopting VR installations quickly?
Museums view immersive content as a tool to attract younger audiences and justify premium ticket tiers, driving a forecast 31.63% CAGR for the segment.
How are 5G networks changing venue economics?
Edge rendering over 5G removes the need for on-site GPU racks, cutting capex 30-50% and enabling more flexible site layouts.
What is the primary challenge for new entrants?
High start-up capital requirements of USD 100,000300,000 and rising insurance premiums continue to limit first-time operator entry.
Page last updated on:


