Geospatial Analytics Market Size and Share
Market Overview
| Study Period | 2020 - 2031 |
|---|---|
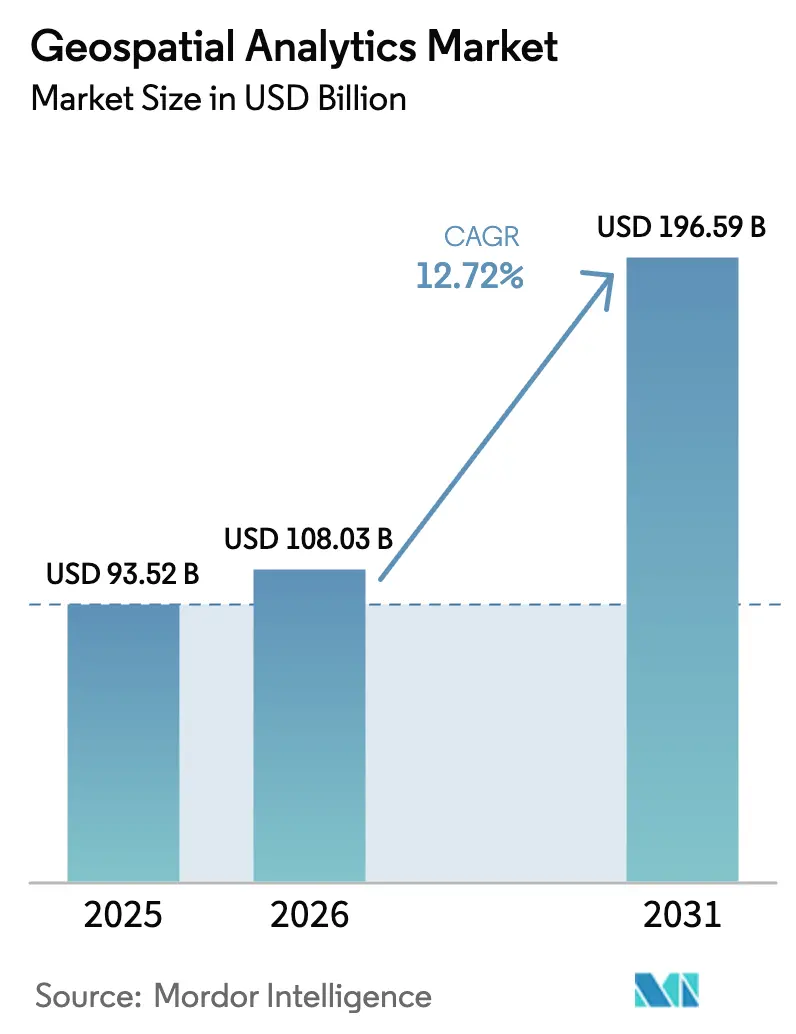
| Market Size (2026) | USD 108.03 Billion |
| Market Size (2031) | USD 196.59 Billion |
| Growth Rate (2026 - 2031) | 12.72% CAGR |
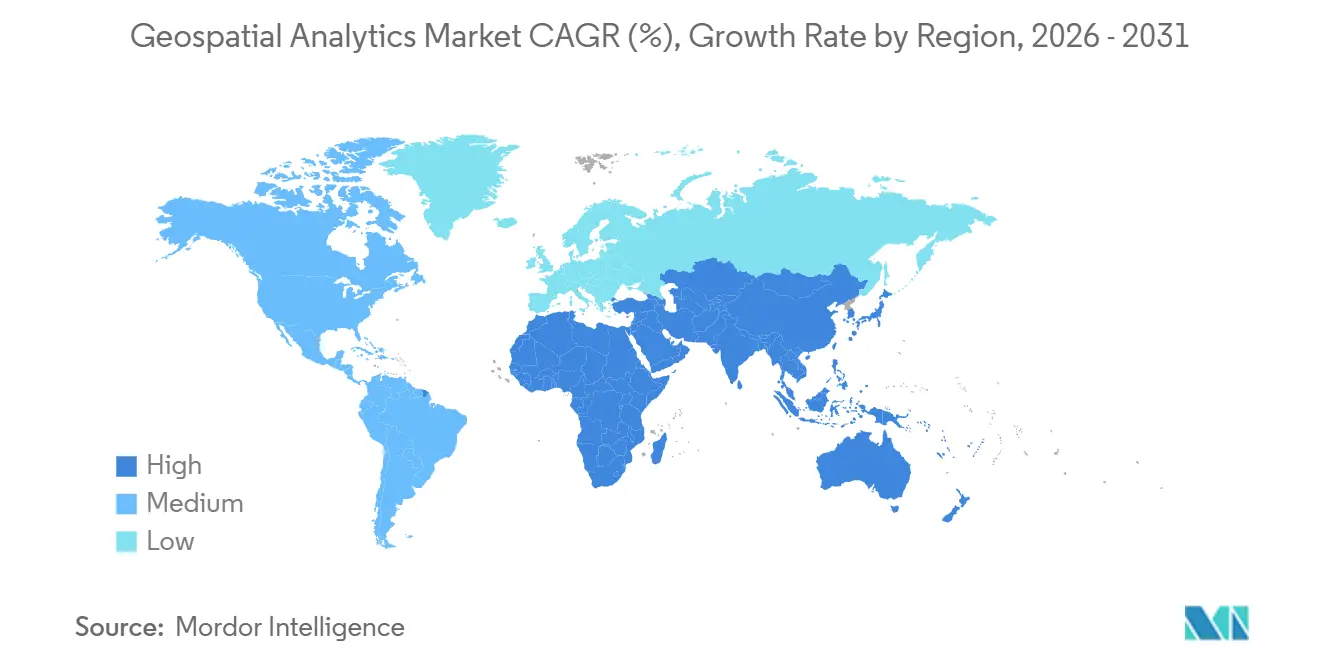
| Fastest Growing Market | Asia Pacific |
| Largest Market | North America |
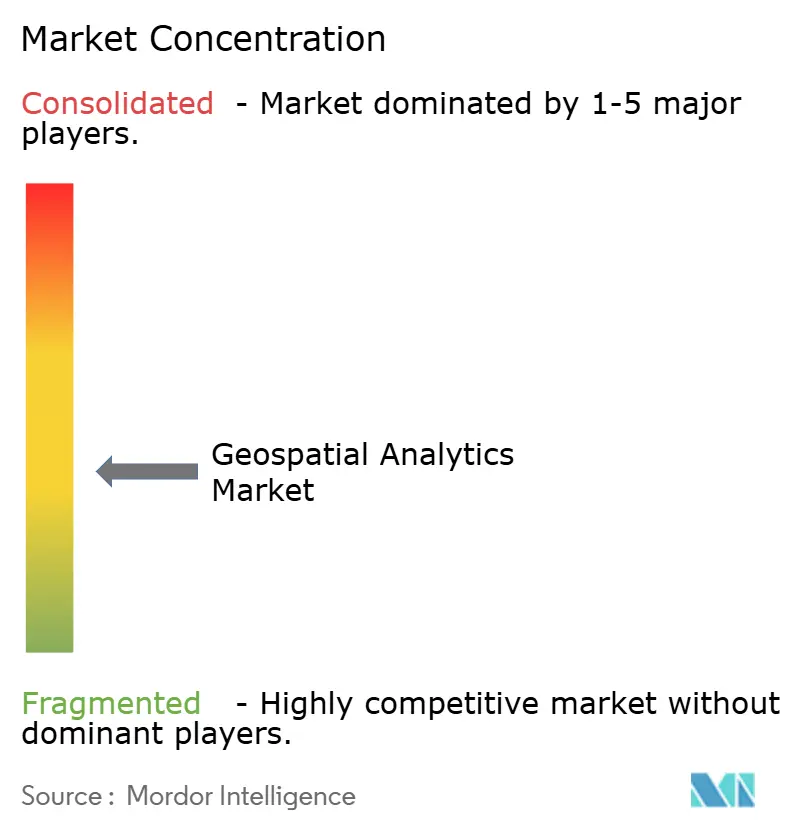
| Market Concentration | Medium |
Major Players *Disclaimer: Major Players sorted in no particular order Image © Mordor Intelligence. Reuse requires attribution under CC BY 4.0. | |
Geospatial Analytics Market Analysis by Mordor Intelligence
The geospatial analytics market size is projected to expand from USD 93.52 billion in 2025 and USD 108.03 billion in 2026 to USD 196.59 billion by 2031, registering a CAGR of 12.72% between 2026 to 2031. Strong demand for real-time location intelligence, falling satellite launch costs, and rapid 5G rollouts are reshaping how enterprises ingest, process, and act on spatial data. Nations now treat geospatial infrastructure as a strategic asset, evidenced by China’s BeiDou global coverage and India’s open-data mandate under the National Geospatial Policy. Cloud-native platforms dominate new deployments because they elastically process petabyte-scale imagery, while daily-revisit smallsat constellations compress insight latency from days to minutes. Despite momentum, interoperability gaps and privacy regulation elevate compliance costs, especially for cross-border projects covered by the European Union’s Artificial Intelligence Act.
Key Report Takeaways
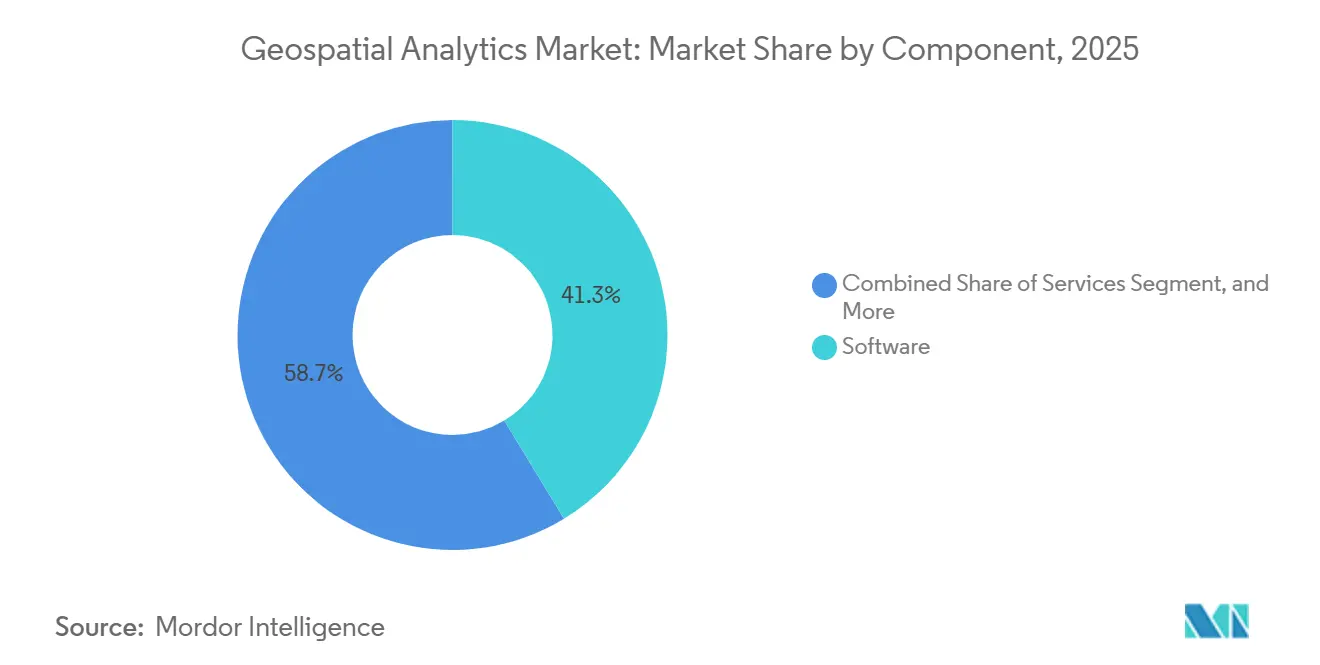
- By component, software led with 41.32% of the geospatial analytics market share in 2025, whereas services will expand the fastest at a 13.37% CAGR through 2031.
- By analysis type, surface analysis accounted for 35.78% of 2025 revenue, while network analysis is forecast to post a 13.54% CAGR through 2031.
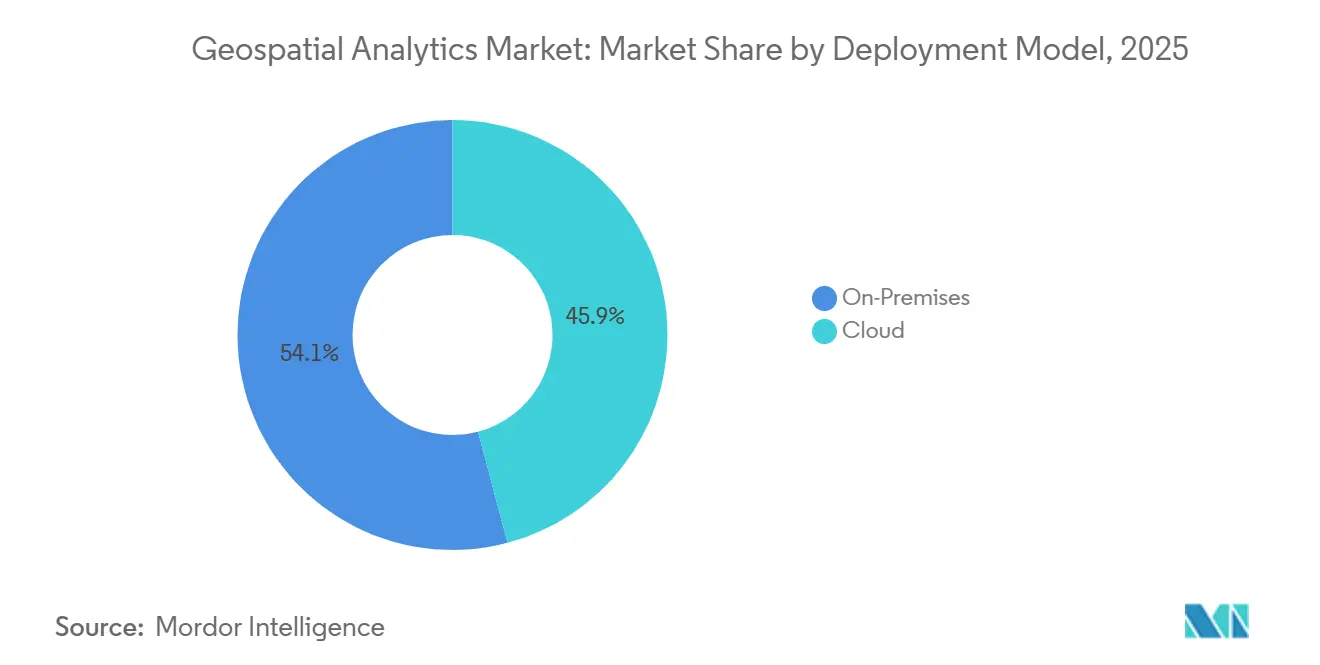
- By deployment model, the cloud segment commanded 45.89% of the geospatial analytics market share in 2025 and should grow at a 13.11% CAGR, outpacing on-premises alternatives.
- By end-user vertical, transportation and logistics is projected to record the highest CAGR of 14.36%, surpassing government, which accounted for 23.76% of 2025 spending.
- By geography, North America retained 35.92% of the geospatial analytics market share in 2025, yet Asia-Pacific is on track for the fastest 13.76% CAGR through 2031.
Note: Market size and forecast figures in this report are generated using Mordor Intelligence’s proprietary estimation framework, updated with the latest available data and insights as of January 2026.
Global Geospatial Analytics Market Trends and Insights
Drivers Impact Analysis*
| Driver | (~) % Impact on CAGR Forecast | Geographic Relevance | Impact Timeline |
|---|---|---|---|
| Adoption of Smart-City Programs | +2.3% | Global, with concentration in Asia-Pacific, Middle East, and select North American metros | Medium term (2-4 years) |
| Integration of 5G-Enabled Location Services | +2.1% | North America, Europe, Asia-Pacific core markets (China, South Korea, Japan) | Short term (≤ 2 years) |
| Proliferation of IoT-Derived Spatial Data | +1.9% | Global, with early adoption in industrial and agriculture verticals | Medium term (2-4 years) |
| Smallsat Constellations Enabling High-Revisit Imagery | +1.7% | Global, with defense and agriculture applications leading in North America and Europe | Long term (≥ 4 years) |
| Hyper-Local ESG and Climate-Risk Analytics Demand | +1.5% | Europe, North America, with spillover to Asia-Pacific financial centers | Medium term (2-4 years) |
| Real-Time Geofencing for Autonomous Operations | +1.4% | North America, Europe, China, with pilot deployments in Middle East | Long term (≥ 4 years) |
| Source: Mordor Intelligence | |||
Smart-City Program Adoption
Municipal agencies integrate spatial platforms into traffic control centers, energy grids, and emergency command rooms, making the geospatial analytics market central to urban resilience strategies. New York City’s 2024 IoT Strategy requires every new infrastructure project to stream spatial metadata into a digital twin, enabling predictive maintenance of roads, bridges, and water pipes.[1]NYC Mayor’s Office, “NYC IoT Strategy,” nyc.gov The United Kingdom earmarked GBP 40 million (USD 51 million) for the National Underground Asset Register in 2025 to curb utility strikes, signaling a shift from pilot projects to city-wide rollouts. Subscription-based software is preferred over capital-intensive on-premises hardware because consumption-based pricing aligns with growth in sensor density. As a result, cloud vendors bundle mapping, routing, and real-time data streams, lowering entry barriers for mid-size cities. The geospatial analytics market, therefore, benefits from predictable municipal contracts that provide long-term revenue visibility.
Integration of 5G-Enabled Location Services
Sub-meter positioning derived from 5G carrier-phase measurements eliminates satellite dropouts in urban canyons. The 3GPP Release 17 specification introduced integrity metrics that unlock safety-critical autonomous-vehicle applications.[2]3GPP, “Release 17,” 3gpp.org Cisco expects 1.9 billion 5G devices to support location-based services by 2027. TomTom integrated 5G data into its HD Live Map, achieving lane-level accuracy without the need for roadside beacons. Lower battery drain and lower hardware costs are widening adoption beyond premium smartphones to wearables and industrial sensors. Consequently, the geospatial analytics market sees rising demand for APIs that fuse 5G positioning with satellite and inertial data to ensure ubiquitous coverage.
Proliferation of IoT-Derived Spatial Data
Industrial sensors will produce 79.4 Zettabytes of spatial data annually by 2025, turning stream processing into a core capability for every geospatial analytics market vendor. In agriculture, John Deere’s Operations Center managed data from 280 million acres in 2024, cutting nitrogen use by 15% while sustaining yield. Utilities embed GPS modules in smart meters to map consumption anomalies and preempt outages. However, mixing coordinate systems and time stamps from disparate sensors requires middleware that reprojects data on the fly. Vendors that respond with schema-agnostic ingestion pipelines gain an edge, driving consolidation in the geospatial analytics market.
Smallsat Constellations Enabling High-Revisit Imagery
Planet Labs’ Pelican constellation offers 30-centimeter imagery and same-day tasking, allowing insurers to trigger automated damage assessments within hours of a hurricane.[3]Planet Labs, “Pelican Constellation,” planet.com Maxar’s WorldView Legion boosted daily collection to 6.8 million km² in 2024, meeting military change-detection needs. The European Space Agency will contribute global 4-meter digital elevation models by 2027 through the CO3D mission. Miniaturized payloads and declining launch prices democratize access to imagery, letting startups build agricultural or energy applications without owning satellites. This development increases addressable demand and intensifies competition in the geospatial analytics market.
Restraints Impact Analysis*
| Restraint | (~) % Impact on CAGR Forecast | Geographic Relevance | Impact Timeline |
|---|---|---|---|
| High Costs and Operational Complexity | -1.8% | Global, with acute impact in small and medium enterprises and emerging markets | Short term (≤ 2 years) |
| Legal and Privacy Hurdles | -1.6% | Europe, North America, with emerging regulations in Asia-Pacific | Medium term (2-4 years) |
| Data-Bias in AI-Driven Spatial Models | -0.9% | Global, with heightened scrutiny in regulated sectors (finance, healthcare, government) | Long term (≥ 4 years) |
| Interoperability Across Heterogeneous Standards | -1.2% | Global, with fragmentation most severe in cross-border and multi-vendor deployments | Medium term (2-4 years) |
| Source: Mordor Intelligence | |||
High Costs and Operational Complexity
Spatial data infrastructures often start at USD 50,000 per year for multi-user licenses, excluding consulting and data-acquisition fees. Skilled cartographers and remote-sensing engineers command premium salaries, which are scarce outside major metros. Raw satellite imagery requires radiometric calibration, atmospheric correction, and orthorectification. Each step consumes GPUs and storage that smaller firms struggle to afford. Budget overruns postpone returns on investment, slowing the diffusion of geospatial analytics market platforms among mid-tier enterprises.
Legal and Privacy Hurdles
Under the GDPR and the California Consumer Privacy Act, location data counts as personal information, requiring explicit consent and minimizing storage. The EU AI Act classifies real-time biometric ID tools using spatial data as high-risk, mandating human oversight and conformity audits. Data-localization rules in China, Russia, and India require in-country storage, which fragments cloud architectures. In the absence of a harmonized anonymization standard, legal uncertainty deters investment. Compliance teams now sit at the procurement table, extending sales cycles across the geospatial analytics market.
*Our forecasts treat driver/restraint impacts as directional, not additive. The impact forecasts reflect baseline growth, mix effects, and variable interactions.
Segment Analysis
By Component: Services Outpace Software on Integration Demand
Services revenue is projected to grow at a 13.37% CAGR between 2026 and 2031, even though software accounted for 41.32% of the geospatial analytics market share in 2025. Deloitte’s consulting arm recorded 22% year-over-year growth in 2025 as clients sought turnkey climate-risk dashboards. Esri’s containerized ArcGIS Enterprise 11.4 reduced infrastructure costs by 30% and extended software longevity. Managed platforms that fuse licensed algorithms with outsourced data engineering blur the boundary between software and services. Hardware lags because cloud GPU instances replace specialized on-premise workstations. The geospatial analytics market sees integrators bundling imagery subscriptions, machine-learning models, and data-pipeline maintenance, which accelerates adoption among organizations lacking in-house spatial expertise. Services, therefore, remain the catalyst that unlocks downstream software revenue, nurturing a virtuous cycle for vendors.
A growing share of contracts specifies outcome-based payments tied to yield improvement or fuel savings. This shift aligns vendor incentives with customer success, boosting retention rates. Open-source libraries such as GDAL and PostGIS lower entry barriers, yet clients still pay for customization and support. As integration complexity increases, advisory partners bundle change management workshops to ensure new analytics workflows are embedded in daily operations. Consequently, the geospatial analytics market will likely see deeper partnerships rather than one-off license deals through 2031.


By Analysis Type: Network Analysis Gains on Routing Optimization
In 2025, surface analysis accounted for 35.78% of the market, while network analysis is projected to grow at a CAGR of 13.54% through 2031. Last-mile logistics exploits dynamic routing to trim idle time; UPS saved 10 million gallons of fuel annually by minimizing left turns. Utilities simulate grid resilience to prioritize upgrades, while public-safety agencies test evacuation scenarios. Surface analysis dominates agriculture and mining, where slope and watersheds drive planting and blasting plans. The rise of augmented reality underpins steady growth in geovisualization, and Bentley’s iTwin makes immersive 3D reviews mainstream in niche fields, while spatial statistics and geocoding power epidemiology and site-selection tasks. The geospatial analytics market thus diversifies across analysis types, but network algorithms tied to real-time data streams remain the fastest driver of return on investment.
Demand for multimodal logistics is driving vendors to merge road, rail, sea, and air networks into a unified graph. Combining edge constraints, such as bridge heights or hazardous-cargo rules, with historical travel times improves ETA accuracy. Developers increasingly call microservices over RESTful OGC API interfaces that abstract complex spatial joins. This approach accelerates deployment and keeps compute close to data, improving latency. As a result, organizations view network analysis as a business-critical capability rather than an optional add-on, propelling further share gains inside the geospatial analytics market.
By Deployment Model: Cloud Dominates in Scalability
Cloud accounted for 45.89% of the 2025 install base and will advance at a 13.11% CAGR, reflecting its elastic processing of petabyte-scale imagery. Azure Maps now spans 60 regions, delivering sub-50-millisecond latency for geofence checks. AWS integrated Location Service into Bedrock, letting analysts ask natural-language spatial queries. Hybrid patterns surface where defense agencies process confidential data on-premises, yet cloud-burst compute kicks in for high-resolution change detection. Consumption-based pricing aligns costs with usage, making spatial analytics accessible to mid-size firms. Nonetheless, sovereignty rules push some European utilities to deploy private clouds in localized data centers. Vendors counter by offering container images deployable across any infrastructure, bridging gaps and solidifying the geospatial analytics market’s pivot to software-as-a-service.
Edge processing becomes important when drones stream video to nearby field gateways for first-line object detection. Cloud vendors, therefore, extend runtimes to ruggedized hardware, reducing backhaul and enabling immediate action. Tooling unifies DevOps workflows between cloud and edge, tightening feedback loops. This flexibility cements cloud leadership while keeping a role for specialized edge appliances. Consequently, the geospatial analytics market reflects a continuum, not a binary choice, with cloud resources orchestrated across the data-processing chain.
By End-User Vertical: Transportation and Logistics Lead Growth
Transportation and logistics will post a 14.36% CAGR, the fastest among all verticals, fueled by e-commerce, same-day delivery, and autonomous fleets. DHL’s Resilience360 combines supply-chain risk dashboards with live vessel and flight tracking to reroute shipments around disruptions. The government contributed 23.76% of 2025 outlays through defense imagery buys and smart-city spending. The National Reconnaissance Office awarded Maxar a USD 3.2 billion electro-optical contract in 2024, signaling sustained public-sector demand. Agriculture adopts precision-farming tools like Climate Corporation’s FieldView, which covered 180 million acres in 2025. Healthcare uses spatial data for facility siting and disease mapping, while utilities deploy predictive maintenance on power lines. Cross-industry uptake diversifies revenue, yet higher per-project values in logistics drive the geospatial analytics market’s overall acceleration.
Integration with warehouse management systems enables carriers to quote accurate delivery windows, enhancing customer satisfaction. Dock-door allocation improves yard throughput, and geofencing enforces driver breaks, cutting fuel use. Regulators permit limited autonomous-truck corridors, heightening the need for dynamic geofencing analytics. As carbon accounting rules tighten, carriers integrate emissions data, offering greener route options. These converging trends lock transportation players into multi-year contracts, stabilizing cash flows for vendors across the geospatial analytics market.
Geography Analysis
North America held 35.92% of the geospatial analytics market share in 2025, anchored by defense procurement and mature smart-city deployments. The United States Joint All-Domain Command and Control program embeds location intelligence across services, while L3Harris supplied WESCAM MX-25 sensors for reconnaissance aircraft in 2024. Canada’s federal open-data portal released topographic and cadastral layers in 2025, inviting commercial reuse. Mexico equips coastal states with digital twins for flood monitoring to accelerate disaster response. Growth slows as replacement cycles, not first-time deployments, dominate, yet artificial intelligence add-ons sustain incremental spending.
Asia-Pacific is forecast to register a 13.76% CAGR, the fastest regional pace, propelled by massive public-sector investments. China’s BeiDou counted 1.5 billion active devices by 2025, permeating agriculture, ride-hailing, and emergency services. India operationalized its National Geospatial Policy in 2024, liberalizing access to high-resolution imagery and mandating spatial metadata across ministries, sparking private innovation. Japan allocated JPY 50 billion (USD 340 million) to 3D city models for disaster readiness. South Korea and Australia roll out smart-city pilots, while Southeast Asian nations modernize land registries and forestry monitoring. Cheaper imagery and wider smartphone penetration expand consumer location-based services, enlarging the geospatial analytics market base.
Europe’s trajectory hinges on regulatory harmonization. The INSPIRE Directive drives cross-border data sharing, reducing friction for logistics and environmental apps. Germany’s nationwide digital twin integrates infrastructure data for climate adaptation. The United Kingdom extends subsurface mapping to cut utility-strike incidents, while France funds military earth-observation satellites. Middle Eastern countries, led by Saudi Arabia’s Vision 2030, embed geospatial layers across all public service portals. Africa sees progress in South Africa’s land-tenure reforms and Egypt’s irrigation planning. South America leverages Brazil’s INPE satellites to police Amazon deforestation, and Argentina deploys precision-farming programs. These initiatives collectively expand the geospatial analytics market beyond its traditional Western core.
Mordor Intelligence provides coverage of the geospatial analytics market across other key regional markets, including Africa and Middle East, each with their regulatory frameworks and demand patterns. Detailed country-level analysis extends to Nigeria, Saudi Arabia, Canada, United Arab Emirates, South Korea, India, Brazil, and Italy incorporating local coverage and market participation, as required.

Regulatory Landscape
Location and earth-observation analytics face a tightening mix of privacy, AI governance, and national geospatial data rules that shape data access and cross-border delivery. GDPR and the California Consumer Privacy Act treat precise location data as personal information, while the European Union AI Act raises compliance requirements for high-risk uses such as real-time biometric identification that can rely on spatial inputs. In the United States, the Federal Geographic Data Committee (FGDC) approved the National Spatial Data Infrastructure (NSDI) Strategic Plan 2025-2035 on October 18, 2024, reinforcing interoperability and open standards as procurement anchors for public-sector geospatial programs.
Standards and national data laws are moving in parallel to reduce fragmentation across multi-vendor stacks. In March 2026, the UN Statistical Commission endorsed the second edition of the Global Statistical Geospatial Framework (GSGF), strengthening the mandate to integrate geospatial layers into official statistics. Oman issued Royal Decree 43/2026 (published April 5, 2026) establishing a National Geospatial Data and Information Law, while the Open Geospatial Consortium (OGC) released the JSON-FG standard in May 2026 and opened public comment in July 2026 for proposed 3D Tiles 2.0, both of which support more consistent API-first, cloud-native exchange of vector and 3D data.
Value Chain Analysis
The value chain begins with multi-source data creation and capture, including satellite and aerial imagery, drones, LiDAR, and ground-based IoT and telematics. It then moves through data preparation steps such as calibration, orthorectification, georeferencing, and quality control to produce analytic-ready layers. The processing and analytics layer is increasingly cloud-led, with hyperscalers (AWS, Microsoft Azure, Google Cloud) supplying scalable compute and managed location services, and specialist platforms (Esri, Hexagon, Trimble, Bentley) providing GIS, digital twin, routing, and GeoAI toolchains. Distribution typically occurs through APIs, SaaS subscriptions, and embedded modules within enterprise applications for logistics, utilities, construction, agriculture, and public-sector operations.
Systems integrators and domain partners are pivotal in translating spatial tooling into outcomes, particularly when workflows need to fuse live operational data with maps and models. An example is Esri work highlighted in June 2025 around a digital twin application for Waterfront Logistics, aimed at unifying fragmented supply chain data and moving toward prescriptive decisioning. Key bottlenecks include interoperability across heterogeneous standards, explainability of deep-learning models used in safety-critical decisions, and the operational burden of maintaining spatially connected data foundations, which keeps services, managed delivery, and co-selling partnerships prominent alongside core software platforms.
Competitive Landscape
The geospatial analytics market shows moderate concentration, with the top five vendors controlling roughly 40% of revenue. Esri, Hexagon, and Trimble add artificial intelligence plugins and subscription models to defend installed bases. Hyperscalers Amazon Web Services, Microsoft Azure, and Google Cloud embed location services into broader platforms, reducing switching costs and lowering technical barriers. Cartographic specialists like TomTom focus on automotive navigation, whereas CARTO targets retail site selection with cloud-native spatial analytics.
Strategic moves emphasize vertical integration. Hexagon’s USD 2.3 billion acquisition of Verizon Connect in January 2024 brought together geospatial software and telematics, forming a single fleet-management stack. Esri partnered with all three major cloud providers to offer ArcGIS as a managed service, reducing deployment friction. Open Geospatial Consortium standards bring consistency to RESTful APIs, making multi-vendor stacks workable.
Startups leverage generative AI to translate natural language into map layers, democratizing spatial insight for non-technical users. Venture capital funds back niche players that specialize in ESG analytics or drone flight planning. Meanwhile, established satellite operators such as Maxar bundle analytic-ready imagery with cloud APIs, encroaching on software territory. Competitive intensity will keep prices in check while accelerating innovation, shaping the future cadence of the geospatial analytics market.
Geospatial Analytics Industry Leaders
ESRI Inc.
Hexagon AB
Trimble Inc.
Bentley Systems Inc.
Fugro NV
- *Disclaimer: Major Players sorted in no particular order

Market Opportunities and Future Outlook
API-first modernization programs and standards-led interoperability create whitespace for vendors that can embed geospatial analytics into mainstream enterprise and public-sector workflows. The FGDC NSDI Strategic Plan 2025-2035 (approved October 18, 2024) and related SDI modernization activities offer a specific pathway for standards-aligned platforms and services that simplify data sharing and reuse, especially where procurement favors endorsed standards and repeatable governance. On the standards side, the OGC JSON-FG release (May 2026) and the 3D Tiles 2.0 public-comment work item (July 2026) support more consistent delivery of vector and 3D content via web and cloud APIs, expanding opportunities in digital twins, infrastructure, and mobility applications that depend on portable formats.
A second opportunity is faster, lower-cost creation of 3D and analytics-ready products using AI, paired with richer base datasets that shorten time-to-insight for end users. NASA demonstrated in May 2026 an in-orbit deployment of a geospatial AI foundation model (Prithvi) on the Kanyini satellite and the ISS, pointing to a model-centric approach to push more intelligence closer to collection and reduce downlink-to-decision latency for change detection and disaster response. Commercial platforms also advanced 3D and foundational layers, including Amap launching ABot-Earth0.5 (June 2026) for city-scale 3D scene generation and Esri releasing HydroSHEDS v2 for the Americas (July 2026) using TanDEM-X elevation inputs, supporting climate resilience, hydrology, and infrastructure risk analytics where organizations want consistent, high-resolution basemaps without building data pipelines from scratch.
Recent Industry Developments
- June 2026: Hexagon acquired ITRES Research Limited, adding airborne hyperspectral and thermal imaging capabilities to its geospatial and remote sensing stack. The deal strengthens Hexagon's ability to deliver analytics-ready data products for mapping and environmental monitoring workflows, and supports more vertically integrated offerings alongside its software platforms.
- November 2025: Bentley Systems and EARTHBRAIN formed a strategic partnership to advance smart construction, linking digital construction workflows with infrastructure data management. The collaboration reinforces the role of digital twins and geospatial context in project delivery, creating additional pull-through for analytics platforms in construction and infrastructure owner-operator use cases.
- July 2024: Trimble and Esri elevated their long-standing partnership to drive innovation in construction and infrastructure management, aligning positioning, field operations, and GIS workflows. The move supports deeper integration between design-to-build processes and location intelligence, helping standardize how geospatial analytics gets embedded into day-to-day infrastructure execution.


Research Methodology Framework and Report Scope
Market Definition and Coverage
For this study, the geospatial analytics market includes paid software, cloud platforms, and managed services that take spatial data, run location-based analytics, and deliver decision-ready outputs used by organizations.
Scope exclusions: Hardware sensors, raw imagery sales, and standalone GIS consulting hours that are not bundled with analytics outputs are excluded.
Segmentation Overview
- By Component
- Software
- Services
- Hardware
- By Analysis Type
- Surface Analysis
- Network Analysis
- Geovisualization
- Other Analysis Types
- By Deployment Model
- On-Premises
- Cloud
- By End-User Vertical
- Government
- Defense and Intelligence
- Agriculture
- Natural Resources
- Utility and Communication
- Transportation and Logistics
- Healthcare and Life Sciences
- Other End-User Verticals
- By Geography
- North America
- United States
- Canada
- Mexico
- Europe
- Germany
- United Kingdom
- France
- Russia
- Rest of Europe
- Asia-Pacific
- China
- Japan
- India
- South Korea
- Australia
- Rest of Asia-Pacific
- Middle East and Africa
- Middle East
- Saudi Arabia
- United Arab Emirates
- Rest of Middle East
- Africa
- South Africa
- Egypt
- Rest of Africa
- Middle East
- South America
- Brazil
- Argentina
- Rest of South America
- North America
Data Sources, Market Sizing, and Validation
Desk Research
Desk research helped us set the base structure of the market and put guardrails around what gets counted as geospatial analytics revenue. We referenced public sources such as USGS and NASA open earth-observation materials, ESA program releases, US Census and Bureau of Labor Statistics datasets for macro checks, and standards or guidance from bodies such as ISO and NIST where relevant.
To translate the market definition into a working model, we also reviewed company annual reports, investor decks, product documentation, procurement releases, and credible press coverage to understand pricing models and how offerings are packaged. In addition, a paid subscription for company financials and news intelligence was used to speed up screening and cross-check reported revenue mixes, and a paid patent database was used to identify where analytics capabilities were being developed. The sources listed here are illustrative, and many other public and secondary references were used for data collection, validation, and research clarification.
Primary Interviews and Surveys
Primary interviews and surveys were used to pressure-test the desk view and make sure the model reflects how buyers actually purchase and deploy geospatial analytics. We spoke with a mix of platform providers, service partners, and end users across major regions, and the discussions focused on typical contract structures, cloud versus on-premise mixes, and how analytics is separated from imagery or data licensing in real budgets.
Distribution of primary research fieldwork respondents
| Company type | Respondent position | Region |
|---|---|---|
| Top tier: 34% | CXOs: 12% | APAC: 39% |
| Mid tier: 45% | Functional/Unit leaders: 35% | EMEA: 35% |
| Smaller Players: 21% | Managers: 53% | Americas: 26% |
Market-Sizing & Forecasting
Sizing starts with a top-down build where overall digital and analytics spending is reconstructed into a geospatial slice using adoption and usage signals (by industry and region), and then narrowed to only offerings that run location-aware algorithms and create analytics outputs. To keep the totals realistic, we corroborated them with selective bottom-up approximations such as sampled vendor pricing, typical seat or usage bands, and project volumes observed through channel checks, which are then adjusted when overlaps are found.
Inputs used in the model include cloud deployment share, average contract duration, pricing structure (subscription versus usage-based), refresh cycles for spatial datasets, and demand indicators such as remote sensing adoption and growth in location-enabled mobile and IoT data streams. Forecasts were built using scenario analysis supported by expert views on how fast regulated industries adopt analytics, how quickly cloud capacity scales, and how procurement cycles move across regions. Where bottom-up signals were missing for smaller geographies or niche use cases, we used proxy penetration rates and then rechecked them during primary follow-ups so the gaps do not inflate totals.
Data Validation & Update Cycle
Outputs were checked through triangulation across multiple angles, including spend intensity by end-use, cloud adoption trends, and consistency with reported revenue mixes from public filings. Any unusual jumps were flagged, the assumptions were revisited, and targeted re-contacts were triggered when the variance could not be explained by a known market event.
Before sign-off, the model and the narrative go through a multi-step analyst review so definitions, math, and growth logic line up. Reports are refreshed annually, and interim updates are made when major policy changes, large contracts, or technology shifts materially affect demand. Right before delivery, a fresh pass is performed to ensure clients receive the latest updated view.
Mordor Intelligence's Geospatial Analytics Market Size Compared With Other Published Estimates
Different publications can show different geospatial analytics market sizes because they do not always count the same revenue streams, and the base year and currency timing can also vary. In this market, the biggest swings usually come from whether raw data and imagery are included, how services are treated, and how quickly cloud usage-based revenue is assumed to ramp.
Raw imagery sales sit outside Mordor Intelligence's scope, so the estimate stays focused on analytics software, platforms, and managed services revenue, which reduces double counting between data supply and analytics consumption.
Benchmark comparison
| Source | Market Size | Gaps in Research Methodology |
|---|---|---|
| Mordor Intelligence | USD 93.52 B (2025) | |
| Global Consultancy A | USD 114.32 B (2024) | Uses a different base year and commonly counts a wider component set, where services and adjacent geospatial data items can be bundled into the total, and this changes the starting value before forecasting. |
| Industry Research Desk B | USD 92.19 B (2024) | Anchors the market in a 2024 base and applies broader segmentation coverage, and the revenue line can include items beyond analytics outputs, which shifts totals even if the growth rate looks similar. |
The table shows that year selection and what gets counted as revenue are the two practical drivers behind the spread. By keeping the market tied to a clear paid analytics output definition and then cross-checking it with pricing and adoption signals, the final number stays traceable and repeatable for planning use.


Key Questions Answered in the Report
What is the global geospatial analytics value in 2026?
The total stood at USD 108.03 billion in 2026 and is projected to hit USD 196.59 billion by 2031, reflecting a 12.72% CAGR.
Which region will expand the fastest through 2031?
Asia-Pacific leads with an expected 13.76% CAGR, outpacing all other regions.
Which deployment model holds the top revenue share?
Cloud deployments already capture 45.89% of 2025 revenue and are advancing at a 13.11% CAGR.
Who are the main end users fueling future demand?
Transportation and logistics operators are on track for a 14.36% CAGR, making them the most dynamic adopters.
What factor drives the sharpest CAGR uplift?
Smart-city programs contribute an estimated +2.3 percentage-point lift to overall growth.
What is the top hurdle organizations face when deploying geospatial analytics?
High upfront costs and scarce spatial-data talent suppress uptake, trimming roughly 1.8 percentage points from potential growth.
Page last updated on:


