Market Overview
| Study Period | 2020 - 2031 |
|---|---|
| Forecast Data Period | 2026 - 2031 |
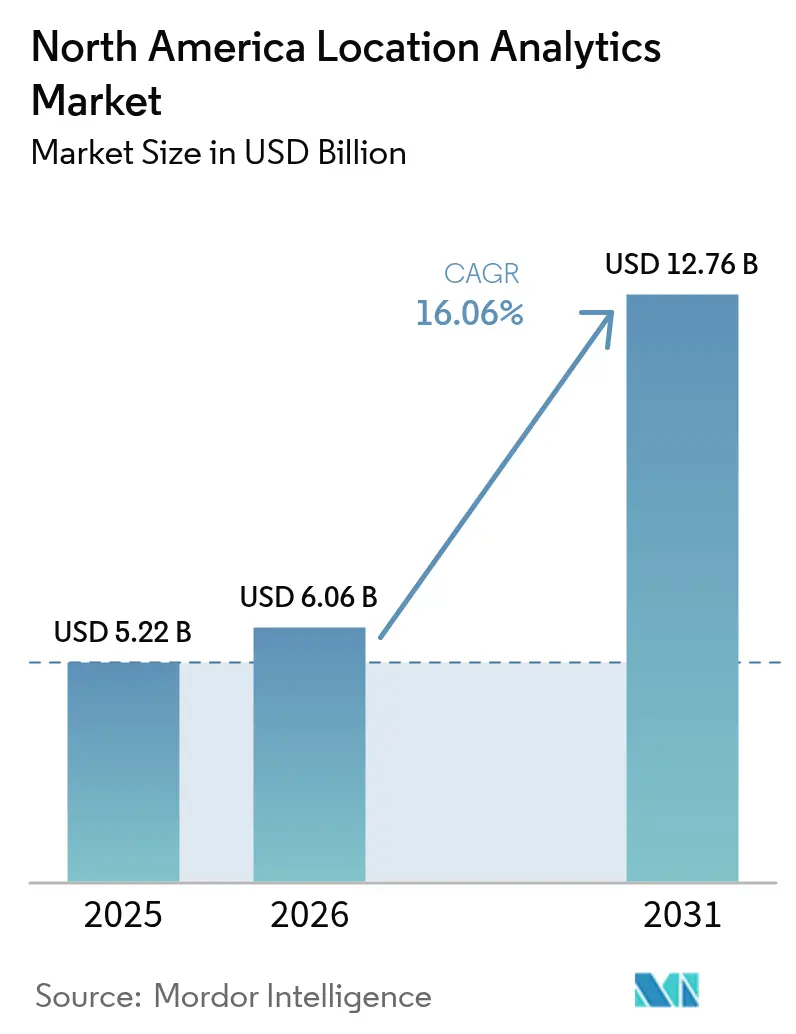
| Base Year Market Size (2025) | USD 5.22 Billion |
| Market Size (2026) | USD 6.06 Billion |
| Market Size (2031) | USD 12.76 Billion |
| Growth Rate (2026 - 2031) | 16.06% CAGR |
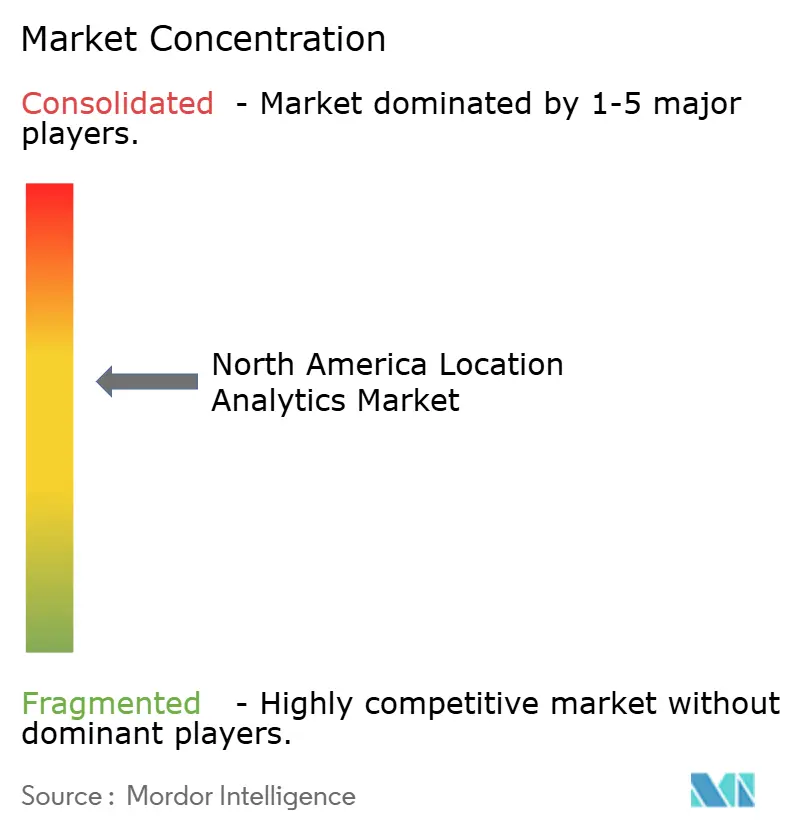
| Market Concentration | Medium |
Major Players *Disclaimer: Major Players sorted in no particular order Image © Mordor Intelligence. Reuse requires attribution under CC BY 4.0. | |
North America Location Analytics Market Analysis by Mordor Intelligence
The North America location analytics market size was valued at USD 5.22 billion in 2025 and estimated to grow from USD 6.06 billion in 2026 to reach USD 12.76 billion by 2031, at a CAGR of 16.06% during the forecast period (2026-2031). Strong tailwinds come from omni-channel retail organizations demanding precise geo-marketing, the surge of IoT sensors streaming real-time spatial data, and widespread migration to cloud-native geospatial platforms that compress deployment cycles. Enterprises are moving beyond basic latitude-and-longitude tracking toward rich spatial analytics that optimize merchandising, routing, and facility throughput. Private-5G and CBRS networks shorten indoor accuracy gaps, while government investment in emergency-response geotechnology adds an institutional layer of demand. Rising privacy regulation represents the main tempering factor, yet compliant data-mining architectures are already emerging to keep momentum intact for the North America location analytics market.
Key Report Takeaways
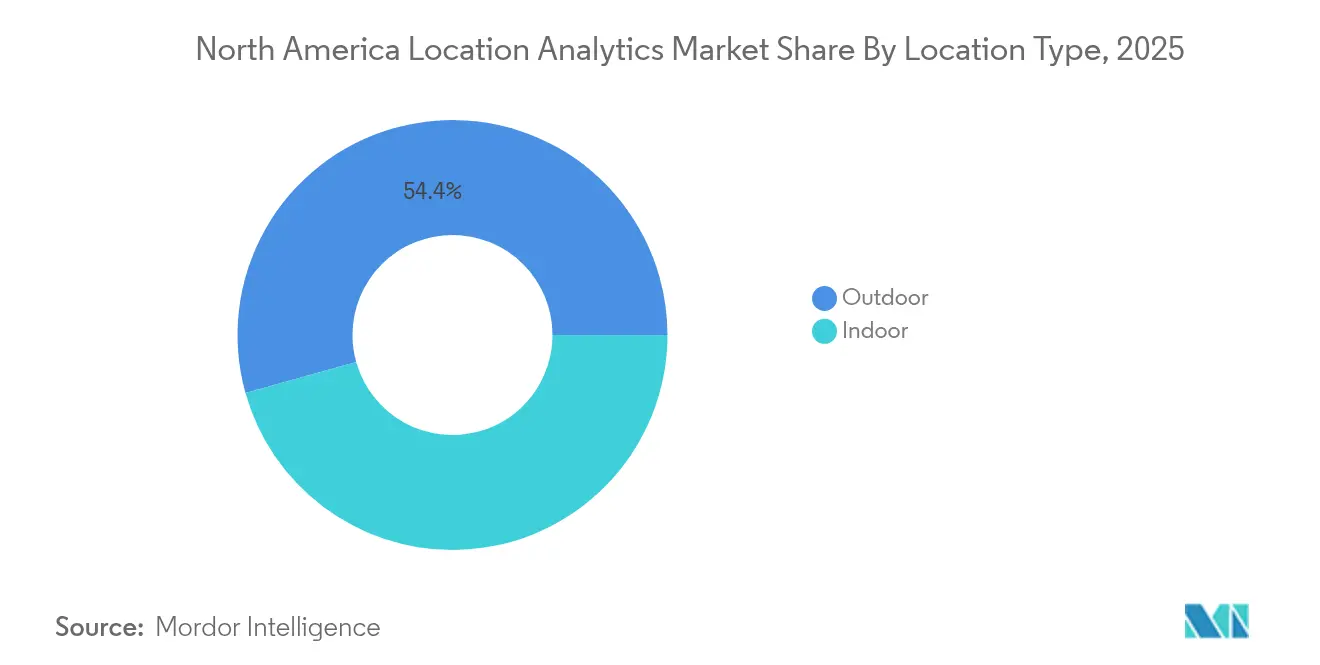
- By location type, the outdoor segment led with 54.35% of North America location analytics market share in 2025, whereas indoor positioning is set to compound at 17.85% CAGR through 2031.
- By deployment model, on-premise retained 59.20% share of the North America location analytics market size in 2025; cloud deployment is forecast to accelerate at a 19.6% CAGR to 2031.
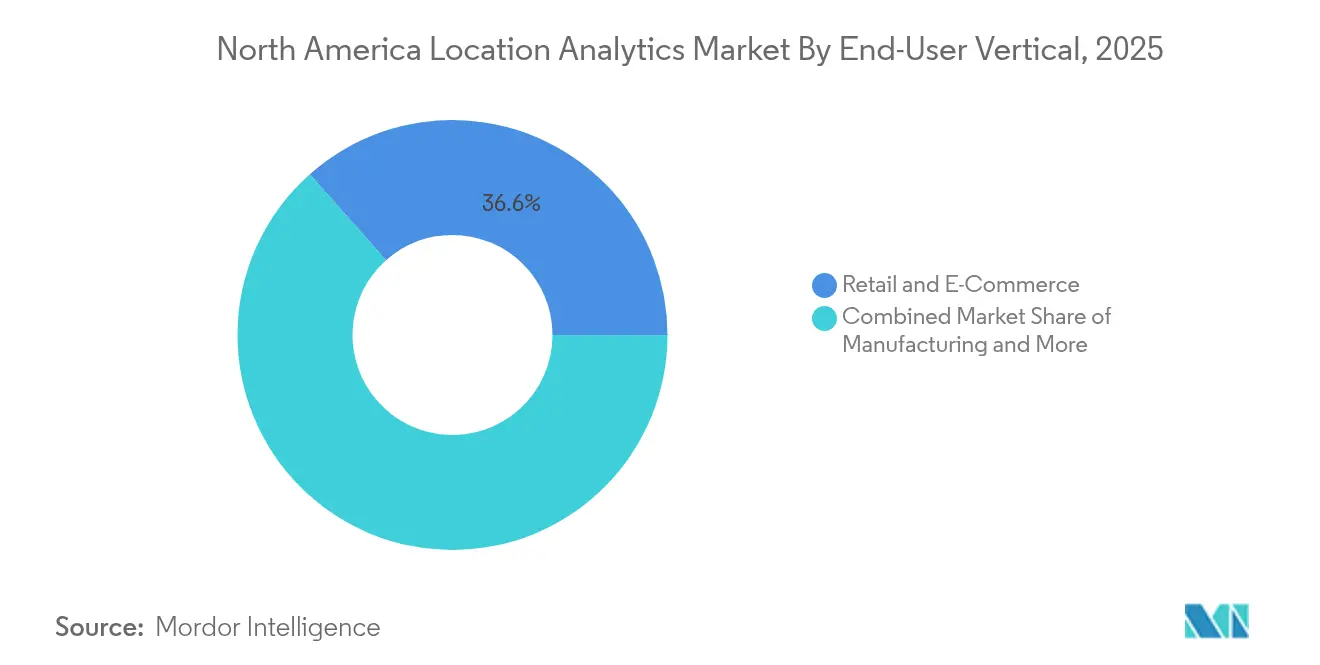
- By end-user vertical, retail and e-commerce commanded 36.55% share of the North America location analytics market size in 2025, while healthcare and life sciences is the fastest-expanding vertical at 16.22% CAGR.
- By geography, the United States controlled 85.40% of 2025 revenue; Canada is expected to post a 12.45% CAGR through 2031.
Note: Market size and forecast figures in this report are generated using Mordor Intelligence’s proprietary estimation framework, updated with the latest available data and insights as of 2026.
North America Location Analytics Market Trends and Insights
Drivers Impact Analysis*
| Driver | (~) % Impact on CAGR Forecast | Geographic Relevance | Impact Timeline |
|---|---|---|---|
| Surge in omni-channel retail geo-marketing campaigns | +3.2% | US retail corridors | Medium term (2-4 years) |
| Proliferation of IoT sensors & connected devices | +4.1% | US manufacturing & Canadian smart-city pilots | Long term (≥ 4 years) |
| Accelerated adoption of cloud-native geospatial analytics platforms | +2.8% | North America enterprise segment | Short term (≤ 2 years) |
| Corporate demand for hybrid workplace occupancy intelligence | +2.3% | Major metropolitan areas | Medium term (2-4 years) |
| Availability of CBRS private-5G improving indoor accuracy | +1.9% | US industrial corridors | Long term (≥ 4 years) |
| Source: Mordor Intelligence | |||
Surge in Omni-Channel Retail Geo-Marketing Campaigns
Retailers pair geofencing tools with CRM suites to trigger real-time promotions, driving higher conversion at store level. Showroom optimization research indicates that strategic in-store product placement and geographic reach expansion lift sales and consumer confidence. As brick-and-click convergence deepens, differentiated location content becomes a loyalty lever that pure-play e-commerce cannot replicate.
Proliferation of IoT Sensors & Connected Devices
Industrial IoT deployments now deliver continuous location telemetry, enabling predictive maintenance and lean inventory cycles. Multi-modal sensor networks combined with machine learning yield positioning systems that self-calibrate, cutting infrastructure spend over time.. The data deluge fuels edge-analytic demand, as manufacturers prefer local processing for latency-sensitive safety workflows.
Accelerated Adoption of Cloud-Native Geospatial Analytics Platforms
Enterprises are abandoning legacy GIS estates for cloud environments that support direct access to cloud-optimized GeoTIFF. The shift democratizes spatial insight across non-specialists who can visualize layers in browser workspaces while DevOps teams automate pipelines. Vendor ecosystems now bundle API-first geospatial services, trimming the total cost of ownership previously tied to on-premise stacks.
Corporate Demand for Hybrid Workplace Occupancy Intelligence
Permanent flexible-work policies push facility leaders to install indoor positioning to monitor desk utilization, ventilation needs, and traffic patterns. Results from healthcare trials underscore how real-time location systems enhance worker productivity and asset stewardship. Facilities teams now blend occupancy analytics with building-management controls to automate energy usage around live capacity metrics rather than static timetables.
Restraints Impact Analysis*
| Restraint | (~) % Impact on CAGR Forecast | Geographic Relevance | Impact Timeline |
|---|---|---|---|
| Heightened privacy and consumer opt-out regulations | –2.7% | California, expanding across North America | Short term (≤ 2 years) |
| High total cost of ownership for real-time indoor systems | –1.8% | Manufacturing & healthcare campuses | Medium term (2-4 years) |
| Source: Mordor Intelligence | |||
Heightened Privacy and Consumer Opt-Out Regulations
California’s CCPA enforcement sweep spotlights the personal nature of geolocation data, requiring explicit opt-outs and stronger consent flows.[1]California, Consumer Privacy Act Regulations, California Privacy Protection Agency cppa.ca.gov cppa.ca.gov Enterprises must now embed privacy engineering into every analytics stack, sometimes trimming data granularity to stay compliant.
High Total Cost of Ownership for Real-Time Indoor Systems
Ultra-wideband, BLE beacons, and Wi-Fi fingerprinting must be fine-tuned per floor plan, creating testing cycles that inflate roll-out budgets. Integration gaps between sensor layers and business applications lengthen payback periods, especially for mid-market adopters who lack in-house geospatial talent
*Our forecasts treat driver/restraint impacts as directional, not additive. The impact forecasts reflect baseline growth, mix effects, and variable interactions.
Segment Analysis
By Location Type: Indoor Positioning Drives Innovation
Outdoor services retained 54.35% North America location analytics market share in 2025 as GPS/GNSS underpins transportation and logistics. Indoor positioning, however, compounds at 17.85% CAGR, powered by sub-meter accuracy from CBRS-enabled private 5G and ultra-wideband deployments. Manufacturers embed the technology for asset-level visibility, while hospitals apply it to track high-value equipment.
Growing hybrid demand obliges vendors to fuse indoor and outdoor layers into single source-of-truth dashboards. Industry 4.0 blueprints call for worker safety geozones and automated guided vehicles requiring continuous coordinate streams. The North America location analytics market therefore pivots to multi-modal engines that reconcile GPS drift outdoors with multipath corrections indoors.


By Deployment Model: Cloud Acceleration Reshapes Infrastructure
On-premise systems still accounted for 59.20% of the North America location analytics market size in 2025, reflecting data-sovereignty priorities among heavily regulated sectors. Cloud options are scaling at a 19.6% CAGR as pay-as-you-go processing and native collaboration entice enterprises with limited capex. Hybrid architectures are also rising, combining edge inference with cloud modeling for low-latency use cases.
Private CBRS networks offer an on-site alternative that marries cloud orchestration with sovereign data paths, giving factories a route around public-cloud lock-in. Format innovations such as GeoParquet minimize ETL overhead, unlocking agile workflows that previously demanded specialist GIS scripting.
By Component: Solutions Drive Market Value
Integrated software suites dominate buying centers because they unify ingestion, processing, visualization, and alerting under one SLA. Services revenues expand as enterprises require system integration, model tuning, and managed-analytics oversight to maintain mapping fidelity. Field calibration, beacon lifecycle management, and compliance documentation fuel professional-services pipelines well after initial deployment.
Managed services add predictable opex, allowing business teams to focus on customer KPIs rather than sensor uptime. Vendors respond by offering tiered NOC support, proactive firmware pushes, and SLA-bound accuracy audits that align with uptime expectations in logistics and healthcare.
By Technology: Multi-Modal Approaches Enhance Accuracy
GPS/GNSS remains universal for long-range tracking, yet Bluetooth Low Energy blends minimal power draw with smartphone ubiquity for in-store navigation. Ultra-wideband earns traction for sub-meter precision on high-value assets where every centimetre matters. CBRS and 5G add deterministic timing data that lifts indoor fidelity without extra hardware overlay.
Hybrid engines stitch multiple signals to cover blind spots, ensuring resilience if one modality drops. Such redundancy is becoming baseline in safety-critical verticals, particularly chemical manufacturing and emergency response command centers.
By End-User Vertical: Healthcare Accelerates Adoption
Retail and e-commerce maintained 36.55% share of the North America location analytics market size in 2025, but healthcare and life sciences now grows fastest at 16.22% CAGR. Clinics deploy location analytics to shorten equipment retrieval times and map patient flow, cutting overcrowding risks. Manufacturers layer spatial data into MES dashboards for OEE improvements, while BFSI leverages geofencing for fraud checks.
Government and defense agencies invest in next-generation situational-awareness platforms that ingest geospatial feeds to speed decision loops. Logistics providers overlay fleet telematics with traffic and weather, refining ETAs and SLA compliance in last-mile delivery.
By Application: Emergency Response Gains Strategic Priority
Sales and marketing held 28.75% of 2025 revenue, yet emergency-response software shows an 18.1% CAGR as agencies digitize command workflows. The Department of Homeland Security’s POINTER navigation trials illustrate the pivot to responder-centred mapping that penetrates GPS-denied buildings. Supply-chain optimization stacks sit close behind, pairing RFID, BLE, and analytics to shrink stock-outs and working capital.
Risk-management teams overlay catastrophe models with live hazard feeds, improving capital allocation for insurers. Field-service managers now dispatch crews using AI-routed schedules that factor traffic, weather, and technician skill matrices to minimise downtime.
Geography Analysis
The United States commanded 85.40% of the North America location analytics market in 2025, underpinned by CBRS deployment density and 5G roll-outs that expand indoor coverage. Federal contracts from the National Geospatial-Intelligence Agency and the Department of Homeland Security keep R&D funnels active, spinning cutting-edge prototypes into commercial spin-offs. California’s privacy regime is tightening data-monetization paths in consumer segments, but enterprise B2B flows continue largely unhindered.
Canada is pacing a 12.45% CAGR to 2031 as Ottawa’s connectivity stimulus underwrites 5G and fiber builds in secondary cities. Resource industries leverage autonomous haul-trucks in Alberta oil sands and remote pumping stations in Saskatchewan, each dependent on resilient location networks. Cross-border enterprises enjoy harmonized data standards, enabling joint dashboards that span logistics corridors between Toronto and Chicago.
Regional government programs such as Montréal’s smart-city accelerator and Vancouver’s digital twin of municipal infrastructure foster pilot zones where vendors can co-create novel use cases. Canada’s privacy code aligns closely with European GDPR, giving multinationals a template to scale compliant solutions across trans-Atlantic operations.
Regulatory Landscape
Regulation affecting location analytics in North America is tightening around sensitive geolocation data, consent requirements, and telecom privacy duties. In June 2026, the US Federal Trade Commission finalized a settlement with Kochava that restricts the sale or sharing of sensitive location data without affirmative express consent (except for services directly requested by consumers), increasing compliance expectations for data brokers and downstream analytics users. Separately, a June 2026 US Supreme Court decision affirmed the FCC's ability to impose fines on wireless carriers for location data handling under Section 222 of the Communications Act, keeping carrier-sourced location data under active federal enforcement scrutiny.
In Canada, federal privacy and cybersecurity initiatives add parallel obligations for vendors and enterprise users operating cross-border. In June 2026, the Government of Canada tabled the Protecting Privacy and Consumer Data Act (Bill C-36), which proposes a new Digital Safety and Data Protection Commission of Canada and material administrative penalties, pushing enterprises to strengthen consent governance, purpose limitation, and audit-ready data controls. In March 2026, Canada passed the Critical Cyber Systems Protection Act (Bill C-8), which enables mandatory security directions for telecommunications providers and reinforces security-by-design expectations that carry through location data collection, transport, and storage across hybrid and cloud deployments.
Value Chain Analysis
The value chain spans data capture, connectivity, processing, and application-layer delivery. Upstream inputs include GNSS signals and a growing mix of indoor modalities (BLE, UWB, Wi-Fi, CBRS/5G), along with IoT sensors that emit continuous telemetry. Connectivity providers and private network ecosystems (notably CBRS in the United States) transport these data into edge gateways and cloud pipelines, where platform vendors and hyperscalers provide geospatial storage, analytics APIs, and orchestration. Midstream participants include GIS and enterprise software providers integrating spatial layers into operational systems (for example, Esri deployments paired with IBM Maximo for asset and field operations), while downstream value is realized in packaged applications for retail geo-marketing, supply chain visibility, emergency response routing, and facility utilization.
Delivery economics are shaped by integration and data network effects. Control-tower and visibility platforms aggregate shipper, carrier, and facility events into shared networks (for example, FourKites), while transportation data specialists have expanded graph-like supply chain intelligence based on trip patterns (INRIX released a supply chain dataset in March 2026 that maps supplier-customer connections across manufacturing sites). On the deployment side, enterprises are operationalizing location analytics through cloud-native and hybrid stacks, tying geospatial processing to broader data platforms and streaming layers. Partnerships such as LOCUS with CALSTART (May 2025) show how commercial vehicle trip data can be productized into planning-grade models that feed infrastructure decisions. Key bottlenecks include calibration and interoperability (floor-plan tuning for indoor systems, and ERP/TMS/MES integration), as well as hardware lead times for certain sensor and edge components, which can extend rollout schedules for high-accuracy indoor and fleet deployments.
Competitive Landscape
The competitive field is moderately concentrated. Traditional GIS giants such as Esri, HERE, and TomTom fortify portfolios with AI-powered predictive layers, while telecom vendors Ericsson and Nokia monetize 5G infrastructure by bundling centimeter-grade positioning. Cloud hyperscalers integrate managed geospatial APIs into broader analytics suites, lowering adoption barriers for mid-sized firms.
Differentiation is shifting from core mapping to orchestration of multi-modal inputs—BLE, UWB, private LTE, and satellite imagery—within a unified schema. Vendors able to abstract this complexity win wallet share as customers seek single-pane dashboards. Healthcare and heavy-industry specialists carve niches by wrapping compliance templates and pre-configured analytics tuned to regulatory workflows.
Start-ups exploit edge processing and federated-learning designs that keep sensitive coordinates on-premise, solving data-sovereignty pain points. M&A appetite is robust as incumbents acquire sensor specialists and indoor-mapping start-ups to fill platform gaps. Expect continued consolidation as hardware commoditizes and analytical value migrates to software-defined location engines.
North America Location Analytics Industry Leaders
Esri Inc.
IBM Corporation
Microsoft Corporation
Cisco Systems Inc.
Google LLC
- *Disclaimer: Major Players sorted in no particular order

Market Opportunities and Future Outlook
Public-sector standardization and cross-agency programs create tangible whitespace for vendors that can productize compliant, repeatable location intelligence workflows. The US Department of Transportation published its 2026-2030 GIS Strategic Plan to formalize GIS support capabilities into a broader location intelligence framework, expanding opportunities for software, integration services, and data governance tooling that connect field operations, safety workflows, and multimodal transportation datasets. Commercially, the ongoing shift to cloud-native data estates is driving demand for spatial analytics delivered inside mainstream analytics environments. ArcGIS GeoAnalytics becoming generally available for Microsoft Fabric (November 2025) reduces friction for enterprises that want to run geospatial processing alongside broader lakehouse and Spark workloads.
Infrastructure siting and capacity planning is another opportunity area where constraint-first geospatial modeling is increasingly viewed as a required capability. Research and industry energy siting work emphasize how power availability, land-use limits, and environmental constraints shape US hyperscale data center feasibility, pushing operators and suppliers toward location analytics that merges grid adjacency, permitting constraints, and risk layers into decision workflows. This constraint-based planning also intersects telecom rollouts such as 5G small-cell coverage verification, fiber route optimization, and network asset mapping. At the same time, privacy enforcement actions in the United States and proposed reforms in Canada are raising demand for privacy-preserving architectures (including consent controls, minimization, and on-premise or edge processing options) that support location-driven outcomes without relying on unrestricted consumer-level precise geolocation data.
Recent Industry Developments
- May 2026: IBM announced a five-year global technology modernization agreement with Abertis to upgrade capabilities used in mobility and infrastructure operations, including advanced analytics. The program highlights how large infrastructure operators are procuring integrated analytics stacks that can incorporate location-derived data for network performance, asset operations, and incident response across complex geographies.
- March 2026: IBM completed its acquisition of Confluent, adding a major data streaming platform to its hybrid cloud and AI portfolio. The combination strengthens real-time ingestion and event processing, a core requirement for location analytics use cases such as fleet telematics, indoor RTLS alerts, and emergency response workflows.
- July 2024: Esri launched ArcGIS Enterprise on Kubernetes integrated with IBM Maximo Application Suite as a commercial add-on for spatial enablement of asset and field operations. The release reflects rising demand for containerized, cloud-native GIS deployments that bring location context directly into enterprise asset management and operational workflows.


Research Methodology Framework and Report Scope
Market Definition and Coverage
This market covers location analytics software and related services used to collect, process, and analyze location data so organizations can make decisions using maps, spatial patterns, and movement signals across North America.
Scope exclusions: We exclude GPS or positioning hardware, raw imagery sales, and general BI tools that do not have a clear spatial analytics capability.
Segmentation Overview
- By Location Type
- Indoor
- Outdoor
- By Deployment Model
- On-premise
- Cloud
- Hybrid
- Edge (on-device)
- By Component
- Solutions
- Services
- By Technology
- GPS / GNSS
- Wi-Fi
- Bluetooth Low-Energy (BLE)
- Ultra-Wideband (UWB)
- Cellular (4G/5G incl. CBRS)
- RFID & NFC
- Magnetic & Other
- By End-User Vertical
- Retail & E-Commerce
- Banking, Financial Services & Insurance (BFSI)
- Manufacturing
- Healthcare & Life Sciences
- Government & Defense
- Energy & Utilities
- Transportation & Logistics
- Telecom & IT
- Real Estate & Smart Buildings
- Other Verticals
- By Application
- Risk Management
- Supply Chain & Inventory Optimization
- Sales & Marketing Optimization
- Facility & Asset Management
- Workforce & Field-Force Management
- Remote Monitoring & Predictive Maintenance
- Emergency & Disaster Response Management
- Customer Experience & Engagement
- Fraud & Compliance Analytics
- Others
- By Country
- United States
- Canada
- Mexico
Data Sources, Market Sizing, and Validation
Desk Research
Desk work starts by mapping what is being sold in location analytics and where demand is coming from across the United States, Canada, and Mexico, which helps keep a practical scope before we model revenue. We reviewed non-paywalled sources such as US Census Bureau business and population series, Bureau of Transportation Statistics mobility and freight indicators, FCC releases that shape wireless and spectrum usage, and NIST publications that influence data handling and cybersecurity practices.
To ground adoption and spending logic, we also used sources such as government open data portals at the city and state level, peer reviewed journals for indoor positioning and geospatial methods, and industry association websites that track geospatial and GIS usage. For company level direction, we screened annual reports, earnings notes, product documentation, and credible press coverage, and then supported the revenue build with paid subscriptions focused on company financials and intelligence, news and financials, patent databases, and tender and contract tracking where relevant. These examples are not exhaustive, and many other public and paid sources were also referenced for data collection, validation, and research clarification.
Primary Interviews and Surveys
Primary work was used to pressure test what desk sources cannot fully show, especially pricing patterns, packaging of analytics features, and what share of deployments are truly location driven versus adjacent geospatial tools. We spoke with a mix of solution providers, system integrators, and enterprise users across key verticals such as retail, transportation and logistics, public sector, and healthcare. Coverage was balanced across the United States, Canada, and Mexico so assumptions did not lean on one country only.
Distribution of primary research fieldwork respondents
| Company type | Respondent position | Region |
|---|---|---|
| Top tier: 37% | CXOs: 13% | |
| Mid tier: 49% | Functional/Unit leaders: 36% | |
| Smaller Players: 14% | Managers: 51% |
Market-Sizing & Forecasting
Sizing is built using a top-down approach where North America demand is reconstructed from the reachable user base by vertical and the typical spend on location analytics features per organization, and then reconciled against supply-side signals. Once the first total is formed, we corroborate it with selective bottom-up checks such as sampled vendor revenue cues, channel feedback on common deal sizes, and volume by pricing assumptions for recurring subscriptions versus services, so the total is not driven by one angle only.
Key model inputs include cloud adoption for analytics workloads, the pace of indoor versus outdoor use cases (for example, store and venue footfall analytics versus routing and fleet visibility), the number of location enabled assets and endpoints tied to IoT rollouts, renewal versus new logo mix that affects net revenue retention, and privacy and consent tightening that can slow certain advertising led deployments. For forecasting, scenario analysis is used so base, conservative, and faster adoption paths can be tied back to these variables and then reviewed with expert views collected in primary discussions. When bottom-up cues are missing for smaller suppliers, gaps are handled through peer group benchmarks and pricing bands, and then adjusted if interview feedback points to different packaging or discounting patterns.
Data Validation & Update Cycle
Outputs are checked against independent signals such as enterprise analytics spend trends, location technology adoption in key end markets, and visible contract activity. Unusual jumps are flagged for a second pass. Where variances remain, we re-contact respondents to confirm whether the driver is scope, pricing, or timing, and we correct assumptions before sign-off. Reports are refreshed annually, and material events are captured through interim monitoring, followed by a final pre-delivery review so clients receive an updated view at the time of publication.
Mordor Intelligence's North America Location Analytics Market Market Size Compared Against Other Published Estimates
Published market values for North America location analytics often differ because the studies do not always count the same revenue streams, and the year used as the base can shift results when growth is high. Differences also show up when one estimate leans more on supplier narratives, while another emphasizes end-user adoption and typical spend.
In this market, the biggest gap drivers are usually whether services are counted alongside software subscriptions, whether indoor positioning enablement is treated as part of location analytics or placed in a separate bucket, and how currency timing and inflation assumptions are applied across the forecast. The spread is also influenced by how often the model is refreshed, since deal sizes and packaging can change quickly with cloud bundles and new privacy requirements. Inclusion of adjacent geospatial tooling can inflate totals when definitions are loose, a scope discipline applied by Mordor Intelligence.
Benchmark comparison
| Source | Market Size | Gaps in Research Methodology |
|---|---|---|
| Mordor Intelligence | USD 5.22 B (2025) | |
| Industry Publisher A | USD 6.80 B (2026) | Uses a later start year and appears to blend broader software, services, and deployment labels, which can pull adjacent geospatial and general analytics spending into the total. |
| Research Distributor B | USD 5.22 B (2025) | Republishes figures tied to a fixed report window and provides limited clarity on inclusion rules, so readers cannot easily see how indoor, services, and non-spatial analytics tools are handled. |
Across the three figures, timing and scope definitions explain most of the variance. The remaining gap typically comes from how subscription pricing and services mix are treated in the model. By keeping inputs tied to observable adoption signals and checking totals through repeatable cross-checks, the sizing stays explainable and stable for planning decisions.


Key Questions Answered in the Report
What is the current size of the North America location analytics market?
The market is valued at USD 6.06 billion in 2026.
How fast is the North America location analytics market expected to grow?
It is forecast to post a 16.06% CAGR, reaching USD 12.76 billion by 2031.
Which deployment model is gaining the most momentum?
Cloud deployment is rising at a 19.6% CAGR as enterprises seek scalability and lower infrastructure costs.
Why is healthcare the fastest-growing vertical?
Hospitals need real-time asset tracking and patient flow optimization, pushing healthcare to a 16.22% CAGR through 2031.
Page last updated on:


