United States Protein Labeling Market Size and Share
Market Overview
| Study Period | 2020 - 2031 |
|---|---|
| Forecast Data Period | 2026 - 2031 |
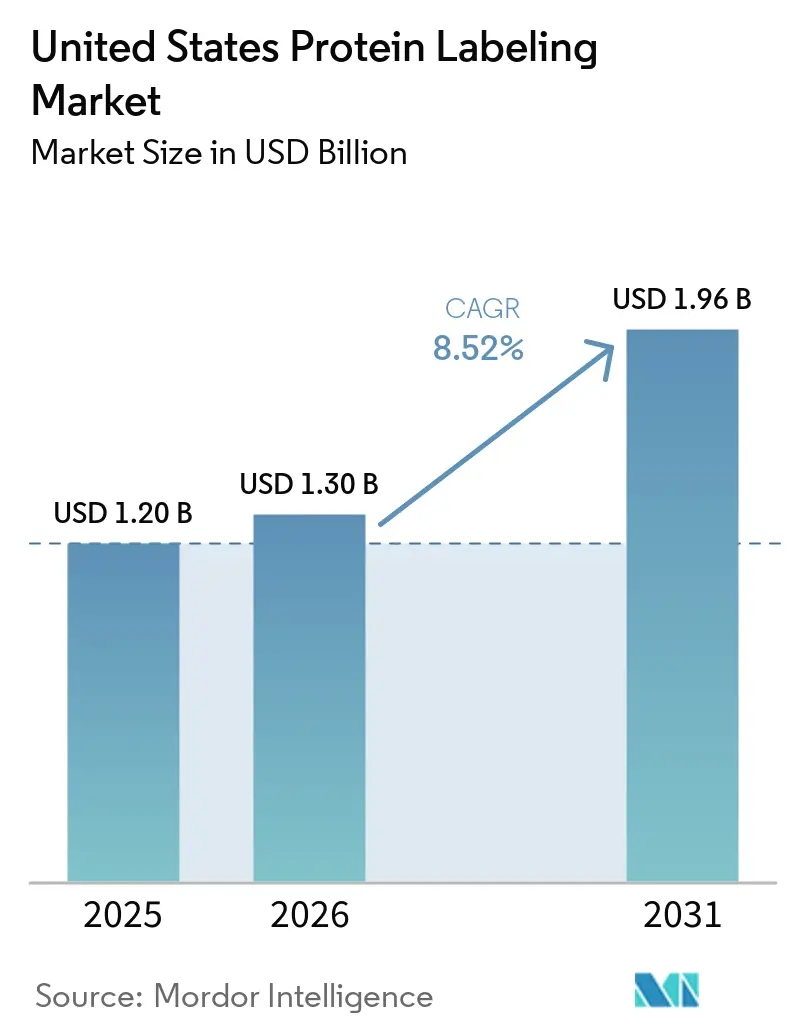
| Base Year Market Size (2025) | USD 1.20 Billion |
| Market Size (2026) | USD 1.30 Billion |
| Market Size (2031) | USD 1.96 Billion |
| Growth Rate (2026 - 2031) | 8.52% CAGR |
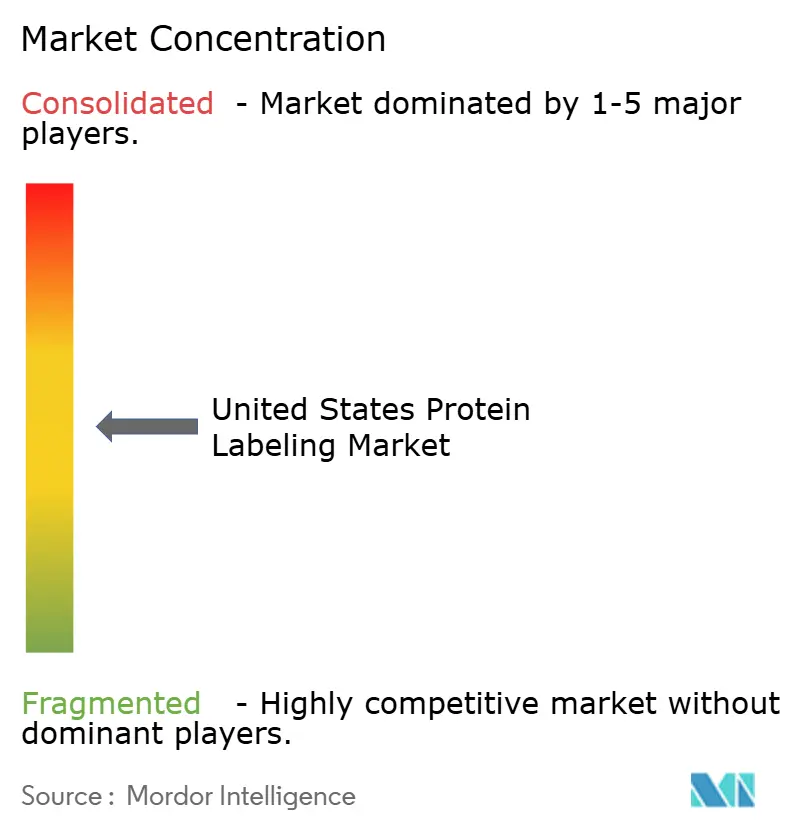
| Market Concentration | Medium |
Major Players *Disclaimer: Major Players sorted in no particular order Image © Mordor Intelligence. Reuse requires attribution under CC BY 4.0. | |
United States Protein Labeling Market Analysis by Mordor Intelligence
The United States Protein Labeling Market size was valued at USD 1.20 billion in 2025 and is estimated to grow from USD 1.30 billion in 2026 to reach USD 1.96 billion by 2031, at a CAGR of 8.52% during the forecast period (2026-2031).
Proteomic research is moving well beyond academic laboratories and into clinical and biopharma programs, and that shift is increasing demand for high-purity and multiplexed reagents as faster instruments shorten discovery cycles. ADC development and targeted protein degradation work are also moving protein labeling from a discretionary research tool to a required step in IND-enabling workflows, which makes purchasing patterns more repeatable across drug programs. AI-assisted probe design adds another layer of support because better fluorophore selection reduces failed conjugation attempts and limits reagent waste in high-throughput settings. The United States (US) protein labeling market is therefore benefiting from both higher experimental throughput and deeper use in manufacturing-linked applications, which supports demand for validated products and specialist services. Competition remains moderately concentrated, with diversified suppliers holding scale positions while focused players defend niches in photostable fluorophores and secondary-antibody reagents.
Key Report Takeaways
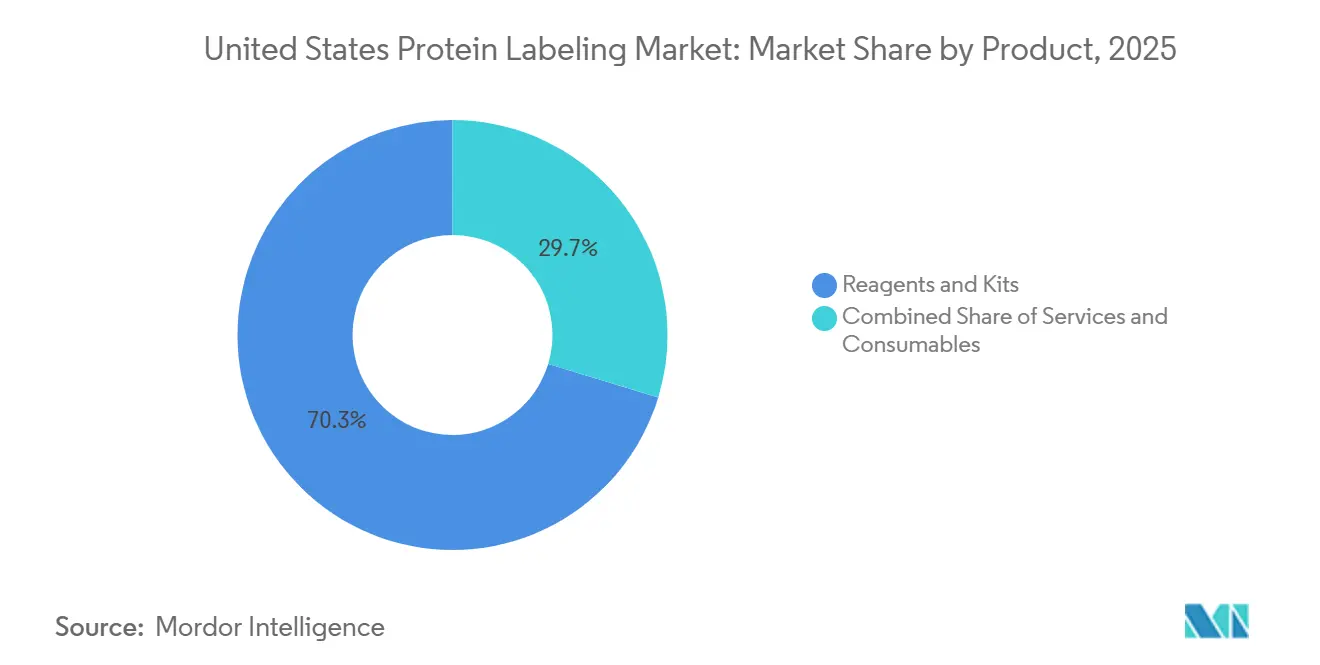
- By product, Reagents and Kits held 70.31% of US protein labeling market share in 2025, while Services are projected to expand at a 10.38% CAGR through 2031.
- By application, Immunological Techniques accounted for 34.24% of the US protein labeling market size in 2025, while Cell-based Assays are forecast to grow at a 10.52% CAGR through 2031.
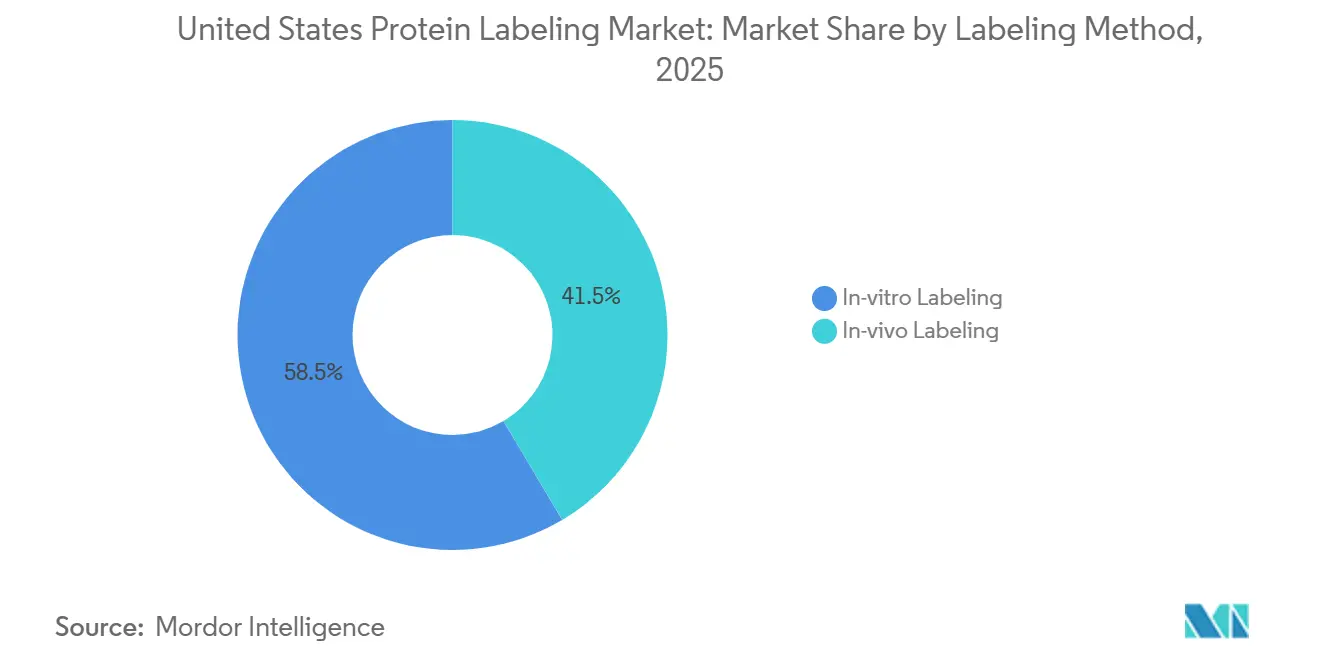
- By labeling method, In-vitro Labeling retained 58.52% of revenue in 2025, while In-vivo Labeling is projected to advance at an 11.25% CAGR through 2031.
- By end user, Pharmaceutical and Biotechnology Companies represented 45.24% of revenue in 2025, while CRDMOs are projected to record the highest CAGR at 11.83% through 2031.
Note: Market size and forecast figures in this report are generated using Mordor Intelligence’s proprietary estimation framework, updated with the latest available data and insights as of January 2026.
United States Protein Labeling Market Trends and Insights
Drivers Impact Analysis*
| Driver | (~) % Impact on CAGR Forecast | Geographic Relevance | Impact Timeline |
|---|---|---|---|
| Expansion Of Proteomics And Multi-Omics Pipelines | +2.5% | National, concentrated in Boston/Cambridge, San Francisco Bay Area | Short term (≤ 2 years) |
| Growing Use In ADC And Targeted Protein Degradation Workflows | +2.0% | National, with significant activity in New Jersey, Boston, San Diego | Medium term (2-4 years) |
| Rising Outsourcing Of Complex Conjugation To CROs And CDMOs | +1.3% | National, with early gains in Boston, Research Triangle, Maryland | Short term (≤ 2 years) |
| Shift Toward Site-Specific And Bioorthogonal Labeling | +1.2% | National, with academic research clusters at Boston, San Diego | Medium term (2-4 years) |
| AI-Assisted Probe Design For Multiplex Imaging | +0.7% | San Francisco Bay Area, Boston | Long term (≥ 4 years) |
| Single-Day Organ-Scale In-Tissue Labeling Platforms | +0.3% | Boston/Cambridge, NIH-funded academic centers | Long term (≥ 4 years) |
| Source: Mordor Intelligence | |||
Expansion of Proteomics and Multi-Omics Pipelines
Proteomics is moving past an aspirational phase because population-scale protein profiling is becoming operationally feasible across translational research programs. UltraPlex-TMT, published in 2026, enables 58-plex pseudo-multiplexed analysis through orthogonal protease digestion, which lifts the number of samples handled in one LC-MS run without extra instrumentation. That throughput shift increases the number of labeling reagent sets used in each campaign because more samples can be tagged and processed in the same time window. It also raises demand for affinity enrichment materials such as biotinylated probes and crosslinkers that help isolate low-abundance targets before mass spectrometry readout. Multi-omics programs further increase reagent intensity because proteomic outputs need compatible and orthogonal chemistries across genomic and metabolomic assays. Thermo Fisher Scientific’s 2026 Orbitrap Tribrid Apex launch adds AI-enabled software that converts raw spectra into usable proteomic readouts at scale, which deepens the role of high-purity reagents in the US protein labeling market.
Growing Use in ADC and Targeted Protein Degradation Workflows
ADC development has changed protein labeling from a routine analytical step into a precision manufacturing requirement across many drug programs. Lonza integrated GlycoConnect, HydraSpace, and toxSYN into one Advanced Synthesis platform in February 2026 and expanded the stack to dual-payload ADC formats, which shows how tightly defined conjugation has become for next-generation constructs. This shift matters because drug-to-antibody ratio control and conjugation site definition are now central to late-stage development, which reduces the commercial relevance of random-labeling chemistries in regulated settings. Targeted protein degradation adds a second demand stream because each degrader design requires separate labeling of the E3 ligase recruiting and target-binding modules to confirm cellular engagement in live-cell assays. A single program can therefore consume site-specific conjugation kits, fluorescent probes, and mass-tag quantification reagents in parallel rather than one after another. That pattern shortens procurement cycles and makes supplier relationships more durable across the US protein labeling market.
Rising Outsourcing of Complex Conjugation to CROs and CDMOs
Complex conjugation work is moving outward because most sponsors do not have the facilities, staff, or analytical support needed for bioorthogonal tagging and GMP bioconjugation. The collaboration announced in April 2026 between Piramal Pharma Solutions and Ajinomoto Bio-Pharma Services around AJICAP site-specific conjugation technology shows how service providers are building shared platforms to capture this demand. As sponsors transfer conjugation steps to CROs and CDMOs, they also shift reagent purchasing authority to those partners, which concentrates buying power in fewer specialized accounts. That procurement shift gives preferred vendors broader access than they can achieve through fragmented academic sales alone. Samsung Biologics completed its USD 353 million acquisition of the Rockville biologics facility in March 2026, adding a US GMP node that is relevant to ADC drug product services and complex conjugation activity. The outsourcing trend supports faster service growth inside the US protein labeling market because high-complexity workflows are increasingly bundled into wider development contracts.
Shift Toward Site-Specific and Bioorthogonal Labeling
The move away from random amine-reactive chemistries is changing the mix of products sold into the US protein labeling market. Nature Communications reported in 2026 that reactive oxygen species-activated bioorthogonal chemistry can trigger spatiotemporally precise in-vivo protein labeling, which expands the addressable use cases in tumor-selective delivery and real-time pathway mapping. Separate tetrazine-based genetic code expansion work achieved on-protein labeling rates of 10^6 M-1s-1 without harming protein stability, which supports faster and cleaner ligation in demanding workflows[1]Ryan A. Mehl et al., “Tuning Encodable Tetrazine Chemistry for Site-Specific Protein Bioorthogonal Ligations,” NSF Public Access Repository, par.nsf.gov. These advances are shifting demand toward enzymatic kits and copper-free click handles such as DBCO, BCN, and tetrazine, rather than traditional NHS-ester kits. The commercial effect is stronger in antibody conjugation and live-system studies where site control directly shapes assay quality and biological relevance. Compliance expectations tied to conjugate homogeneity and analytical characterization are also nudging vendor qualification toward site-specific approaches in regulated applications.
Restraints Impact Analysis*
| Restraint | (~) % Impact on CAGR Forecast | Geographic Relevance | Impact Timeline |
|---|---|---|---|
| High Cost Of High-Resolution Mass Spectrometry Workflows | -1.8% | National, disproportionately affecting academic and smaller CRO segments | Short term (≤ 2 years) |
| Regulatory Complexity For Radio-Isotope Conjugates | -1.0% | National, with particular complexity near NRC-regulated handling zones | Long term (≥ 4 years) |
| Dye Stability And Cold-Chain Burden | -0.7% | National, with amplified impact in distributed clinical diagnostics labs | Short term (≤ 2 years) |
| Large-Tag Steric Hindrance And Localization Artifacts | -0.5% | Global, concentrated in super-resolution imaging applications | Medium term (2-4 years) |
| Source: Mordor Intelligence | |||
High Cost of High-Resolution Mass Spectrometry Workflows
High-resolution quantitative proteomics still carries a cost base that many academic and clinical labs cannot absorb. Orbitrap and time-of-flight instruments cost USD 500,000 to USD 1.5 million per unit, and full deployment also requires premium labeling kits, chromatography systems, and specialized software. That cost profile keeps many institutions on western blot and ELISA workflows that generate less information but require lower up-front spending. The limitation continues after instrument purchase because next-generation multiplex tag kits still carry meaningful per-experiment costs that can reduce run frequency. A shortage of bioinformatic staff adds another barrier because reagent investments are less valuable when complex DIA outputs cannot be interpreted quickly. This restraint caps spending in lower-budget segments and slows the pace at which the US protein labeling market can convert broad academic interest into full-workflow adoption.
Regulatory Complexity for Radio-Isotope Conjugates
Radioactive protein labels remain useful in receptor-binding assays, autoradiography, and early radiopharmaceutical work, but they face a layered compliance burden in the United States. NRC rules for handling, storage, disposal, and dosimetry create operating requirements that many smaller biotech firms and shared academic facilities cannot support. That burden is accelerating substitution toward fluorescent and chemiluminescent options in programs where radiolabel sensitivity is not essential. Shipping adds another obstacle because Class 7 hazardous material rules increase packaging needs, carrier requirements, and delivery delays for radioactive conjugates. Novel 18F-labelled tetrazine prosthetic groups for PET-compatible protein radiolabeling remain scientifically attractive, but they still need to move through FDA IND pathways and radioactive drug research approvals before clinical use. Those longer commercialization timelines reduce the speed at which radio-isotope formats can contribute to the US protein labeling market over the forecast period.
*Our forecasts treat driver/restraint impacts as directional, not additive. The impact forecasts reflect baseline growth, mix effects, and variable interactions.
Segment Analysis
By Product: Services Accelerate as Conjugation Complexity Rises
Reagents and Kits captured 70.31% of US protein labeling market share in 2025, which gave them the leading position in the US protein labeling market. Their scale reflects entrenched use across immunoassays, proteomics platforms, and biopharmaceutical quality control laboratories where standardized kit protocols reduce experimental variability. Brand validation also supports pricing because laboratories often prefer trusted fluorescent dyes, biotin capture systems, and mass-tag kits when failed runs are costly. Consumables serve the same workflows through purification columns, gels, and plate formats that support processing after labeling. Even though consumables carry less pricing power, their reorder pattern stays tied to sample throughput and keeps them important inside the US protein labeling industry.
Services are projected to expand at a 10.38% CAGR through 2031, making them the fastest-growing product segment in the US protein labeling market. GenScript launched the TurboCHO Protein Expression Kit in May 2026 with output in 3 to 5 days and yields up to 5 times higher than competing formats, reflecting how service buyers now expect outsourced partners to reduce discovery timelines rather than only execute isolated steps. As bioorthogonal and site-specific methods become harder to run internally, custom conjugation orders are increasingly turning into recurring program agreements. That shift makes service revenue less exposed to short-term demand swings and gives specialist providers room to sustain premium margins.


By Application: Cell-based Assays Set the Pace in a Diversifying Landscape
Immunological Techniques accounted for 34.24% of the US protein labeling market size in 2025, which kept them as the largest application area in the US protein labeling market. ELISA, western blot, and immunohistochemistry remain durable because they sit inside established laboratory SOPs, pathology routines, and lot-release testing systems. That installed-base effect limits substitution even as newer readouts gain visibility. Mass spectrometry also holds a meaningful place, but its expansion is moderated by instrument and informatics costs already weighing on adoption. Fluorescence microscopy and protein microarrays continue to serve specific niches in localization studies and multiplex profiling with steady demand tied to system upgrades and platform refresh cycles.
Cell-based Assays are projected to grow at a 10.52% CAGR through 2031, which gives them the fastest pace within applications and expands the US protein labeling market into more live-system workflows. Merck and Promega combined Duolink proximity ligation assay technology with HiBiT split-luciferase reporters, creating a system that can detect protein-protein interactions and quantify target protein levels in 3D cell models[2]Merck Group, “Merck Partners with Promega to Advance 3-D Cell Drug Discovery Technologies,” Merck Group, merckgroup.com. Organoid-based testing is also adding demand because tissue-like models need volumetric labeling approaches rather than simple surface staining. That requirement opens space for premium cell-permeant probes and enzymatic tags that standard kits do not address well.
By Labeling Method: In-vivo Labeling Reshapes Imaging Strategies
In-vitro Labeling retained 58.52% of revenue in 2025, so it remained the dominant method in the US protein labeling market. Its lead comes from broad compatibility with lysate proteomics, ELISA preparation, antibody conjugation, and western blot workflows. Most clinical and industrial quality testing still works on processed samples rather than intact living systems, which reinforces this installed base. The method also fits denaturation and fixation steps that many high-throughput protocols still require. FLEXTAG was reported in 2026 as a small and self-renewable protein labeling system that improves long-duration single-molecule localization microscopy, showing that even mature in-vitro approaches continue to advance.
In-vivo Labeling is projected to grow at an 11.25% CAGR through 2031, which is the fastest rate across all segmentation types in the US protein labeling market. Communications Biology published activeDISCO in 2026, showing that large-scale exploration of intact human brain anatomy through light-sheet microscopy is now achievable with organ-scale tissue labeling. LifeCanvas Technologies commercializes SHIELD-based tissue preservation and SmartLabel electrophoretic antibody delivery systems that can reduce whole-organ labeling time from weeks to a single day, which raises reagent use per experiment in neuroscience and oncology centers. As imaging shifts toward intact tissues and organoids, suppliers with precise and tissue-compatible probes are likely to capture a larger share of high-value workflows.
By End User: CRDMO Segment Outpaces All Others Across the Forecast
Pharmaceutical and Biotechnology Companies represented 45.24% of revenue in 2025, giving them the largest end-user position in the US protein labeling market. Their spending spans early mechanism studies, live-cell assays, and late-stage biopharmaceutical quality control, so they buy across most labeling formats rather than one narrow category. Demand inside this group is splitting between large pharma teams that standardize on platform-validated chemistries and smaller biotech firms that favor off-the-shelf kits for speed. Bio-Techne expanded its AI-engineered designer protein portfolio in January 2025, including heat-stable cytokine agonists and optimized growth factors developed through deep-learning workflows, which points to a growing role for engineered reference proteins in assay calibration. Academic and Research Institutes and Clinical Diagnostics Laboratories also remain important because they require broad reagent coverage and strong lot consistency across routine and high-sensitivity workflows.
CRDMOs are projected to grow at an 11.83% CAGR through 2031, which makes them the fastest-growing end-user group and one of the strongest demand centers in the US protein labeling industry. Their expansion reflects more ADC bioconjugation outsourcing, more multispecific antibody programs that need site-specific labeling, and more academic spin-outs that use CROs before building internal analytical teams. Samsung Biologics’ March 2026 Rockville acquisition reinforces this direction because it expands US manufacturing capacity in a node that is relevant to ADC and biologics service demand. As CRDMOs take on more analytical complexity, they increasingly shape which platforms become routine across sponsor portfolios, which makes relationships with these organizations especially valuable for smaller reagent suppliers.
Geography Analysis
Boston/Cambridge, the San Francisco Bay Area, and San Diego formed the main demand base for the US protein labeling market in 2025, and together they captured 63.9% of US life sciences venture capital. Boston/Cambridge stood out with 8,210 NIH funding awards totaling USD 4.80 billion, which sustained dense purchasing activity across academic medical centers, biotech startups, and contract research organizations[3]MassBio, “2025 Industry Snapshot,” MassBio, massbio.org. The concentration of research institutions and early-stage companies in this corridor keeps demand high for immunological assay kits, proteomics reagents, and outsourced analytical support. New England Biolabs and EpiCypher expanded their strategic partnership in May 2026, which strengthened the regional ecosystem for chromatin biology and protein-nucleic acid interaction tools.
The San Francisco Bay Area attracted USD 12.36 billion in life sciences venture capital in 2024 and USD 6.27 billion in the first half of 2025, which supports heavy use of premium cell-permeant and bioorthogonal reagents in startup-led discovery programs. This cluster is especially important for AI-linked biologics discovery and high-throughput phenotypic screening, both of which depend on reliable protein labeling workflows. San Diego also remains a major center because it combines a large mid-sized biotech base with strong genomics and proteomics infrastructure. That mix drives healthy demand for mass spectrometry tags, fluorescence microscopy reagents, and application-specific kits across drug discovery settings. Revvity introduced the Opera Phenix OptIQ high-content screening system and the EnVision Nexus One plate reader at SLAS2026, reinforcing the link between premium instrumentation and matched reagent adoption in these leading clusters.
Research Triangle Park is emerging as the most significant new node in the US protein labeling market, with more than 653 life sciences companies and 58,000 employees in 2026 and employment concentration more than 2.5 times the national average. Its rise reflects more favorable biomanufacturing economics and an expanding base of CDMO capacity additions and sponsored research activity. The Maryland-Virginia corridor adds another layer of demand through NIH-adjacent clinical work and Samsung Biologics’ Rockville presence, especially for regulatory-linked and process analytical applications. As these inland nodes expand, the US protein labeling market is becoming less skewed toward the 3 coastal clusters, even though they still set the pace for high-value procurement.
Competitive Landscape
The US protein labeling market is moderately concentrated, with Thermo Fisher Scientific, Merck KGaA, Danaher, Revvity, and Roche collectively controlling close to half of revenue. Thermo Fisher Scientific holds the broadest portfolio, spanning fluorescent probes, site-specific antibody labeling kits, isobaric tags, and the Olink proteomics platform, and its May 2026 acquisitions of MSAID and Proteinaceous deepen its reach across instrument, software, and reagent layers. Merck KGaA competes through the MilliporeSigma chemistry portfolio and strengthened its position in October 2025 through its Promega collaboration around Duolink and HiBiT for 3D cell and protein interaction workflows. Specialist suppliers such as Biotium, Lumiprobe, and Vector Laboratories remain relevant because users still value photostable dyes and focused antibody reagent lines that large catalogs do not always prioritize.
Competitive strategy in the US protein labeling market is splitting between platform integrators and chemistry specialists. Integrators such as Thermo Fisher Scientific and Revvity connect reagents to software and instrumentation, which raises switching costs through workflow continuity rather than reagent exclusivity alone. Revvity’s 2026 Signals BioDesign launch fits that model because it adds digital workflow support around biologic research and strengthens the case for bundled adoption across discovery laboratories. Chemistry specialists compete differently by pushing brighter dyes, longer shelf-life buffers, and tighter stoichiometry control in conjugation kits. Merck Patent GmbH’s 2025 application on transglutaminase-based microtag sequences also shows that site-selective conjugation tools are moving toward protected IP positions rather than open commoditization.
The market still leaves room for targeted entrants because some high-performance needs remain under-served. Single-cell protein labeling is one example, since antibody-oligonucleotide conjugates used in CITE-seq and CODEX demand nanogram-scale performance and low batch variation that general-purpose catalogs do not always deliver. That gap gives both incumbents and niche suppliers a reason to invest in validation-heavy kits for small-volume and multiplexed workflows. Even with that white space, the US protein labeling market is not fully fragmented because large suppliers still shape standards through breadth, installed relationships, and the ability to pair chemistry with instruments and analysis software.
United States Protein Labeling Industry Leaders
Thermo Fisher Scientific Inc.
Merck KGaA
Danaher Corporation
Bio-Rad Laboratories Inc.
Revvity Inc.
- *Disclaimer: Major Players sorted in no particular order

Recent Industry Developments
- May 2026: GenScript Biotech launched TurboCHO Protein Expression Kit, one of its largest global product launches, enabling protein expression results in 3 to 5 days with yields up to 5 times higher than comparable competing formats. The kit targets the high-throughput, AI-enabled discovery market where rapid protein production directly accelerates labeling and conjugation workflows.
- March 2026: Samsung Biologics completed the USD 353 million acquisition of GSK's biologics manufacturing facility in Rockville, Maryland, with 60,000 liters of combined drug substance capacity. This establishes Samsung Biologics' first US manufacturing presence, expanding its ADC bioconjugation service footprint into a key US market cluster and reinforcing its competitive position against North American-based CDMOs.


United States Protein Labeling Market Report Scope
As per the scope of the report, protein labeling is a technique used to attach a detectable marker, such as a fluorescent dye, radioactive isotope, or epitope tag, to a protein of interest. This allows researchers to track, visualize, or quantify the protein in various biological experiments, facilitating studies on protein localization, interactions, and function.
The United States protein labeling market is segmented by product into reagents and kits, services, and consumables. By application, the market is categorized into immunological techniques, cell-based assays, fluorescence microscopy, protein microarrays, and mass spectrometry. Based on labeling method, the market is divided into in-vitro labeling and in-vivo labeling. By end user, the market includes pharmaceutical and biotechnology companies, contract research and development/manufacturing organizations, academic and research institutes, and clinical diagnostics laboratories. For each segment, the market size and forecast are provided in terms of value (USD).
| Reagents and Kits |
| Services |
| Consumables |
| Immunological Techniques |
| Cell-based Assays |
| Fluorescence Microscopy |
| Protein Microarrays |
| Mass Spectrometry |
| In-vitro Labeling |
| In-vivo Labeling |
| Pharmaceutical and Biotechnology Companies |
| Contract Research and Development / Manufacturing Organizations |
| Academic and Research Institutes |
| Clinical Diagnostics Laboratories |
| By Product | Reagents and Kits |
| Services | |
| Consumables | |
| By Application | Immunological Techniques |
| Cell-based Assays | |
| Fluorescence Microscopy | |
| Protein Microarrays | |
| Mass Spectrometry | |
| By Labeling Method | In-vitro Labeling |
| In-vivo Labeling | |
| By End User | Pharmaceutical and Biotechnology Companies |
| Contract Research and Development / Manufacturing Organizations | |
| Academic and Research Institutes | |
| Clinical Diagnostics Laboratories |


Key Questions Answered in the Report
What is the 2031 outlook for the US protein labeling market?
The US protein labeling market is forecast to reach USD 1.96 billion by 2031 from USD 1.30 billion in 2026, growing at a CAGR of 8.52% over 2026-2031.
Which product group leads revenue in the US protein labeling space?
Reagents and Kits lead the product mix with a 70.31% revenue share in 2025 because they remain central to standardized immunoassay, proteomics, and quality control workflows.
Which application is growing fastest through 2031?
Cell-based Assays are the fastest-growing application segment, with a projected CAGR of 10.52% through 2031, supported by phenotypic screening, PROTAC studies, and live-cell trafficking work.
Why is in-vivo labeling gaining traction in the United States?
In-vivo Labeling is projected to grow at 11.25% CAGR through 2031 because intact tissue, organoid, and organ-scale imaging workflows need spatiotemporally precise probes and high-volume reagent use per experiment.
Which end users are driving the strongest future demand?
CRDMOs are projected to grow at 11.83% CAGR through 2031 as more sponsors outsource complex ADC bioconjugation and site-specific labeling work to specialized service organizations.
How concentrated is competition among suppliers?
Competition is moderate because the top 5 suppliers control close to half of revenue, while specialist companies still hold defensible positions in focused fluorophore and antibody-reagent niches.
Page last updated on:


