North America Proteomics Market Size and Share
Market Overview
| Study Period | 2020 - 2031 |
|---|---|
| Base Year For Estimation | 2025 |
| Forecast Data Period | 2026 - 2031 |
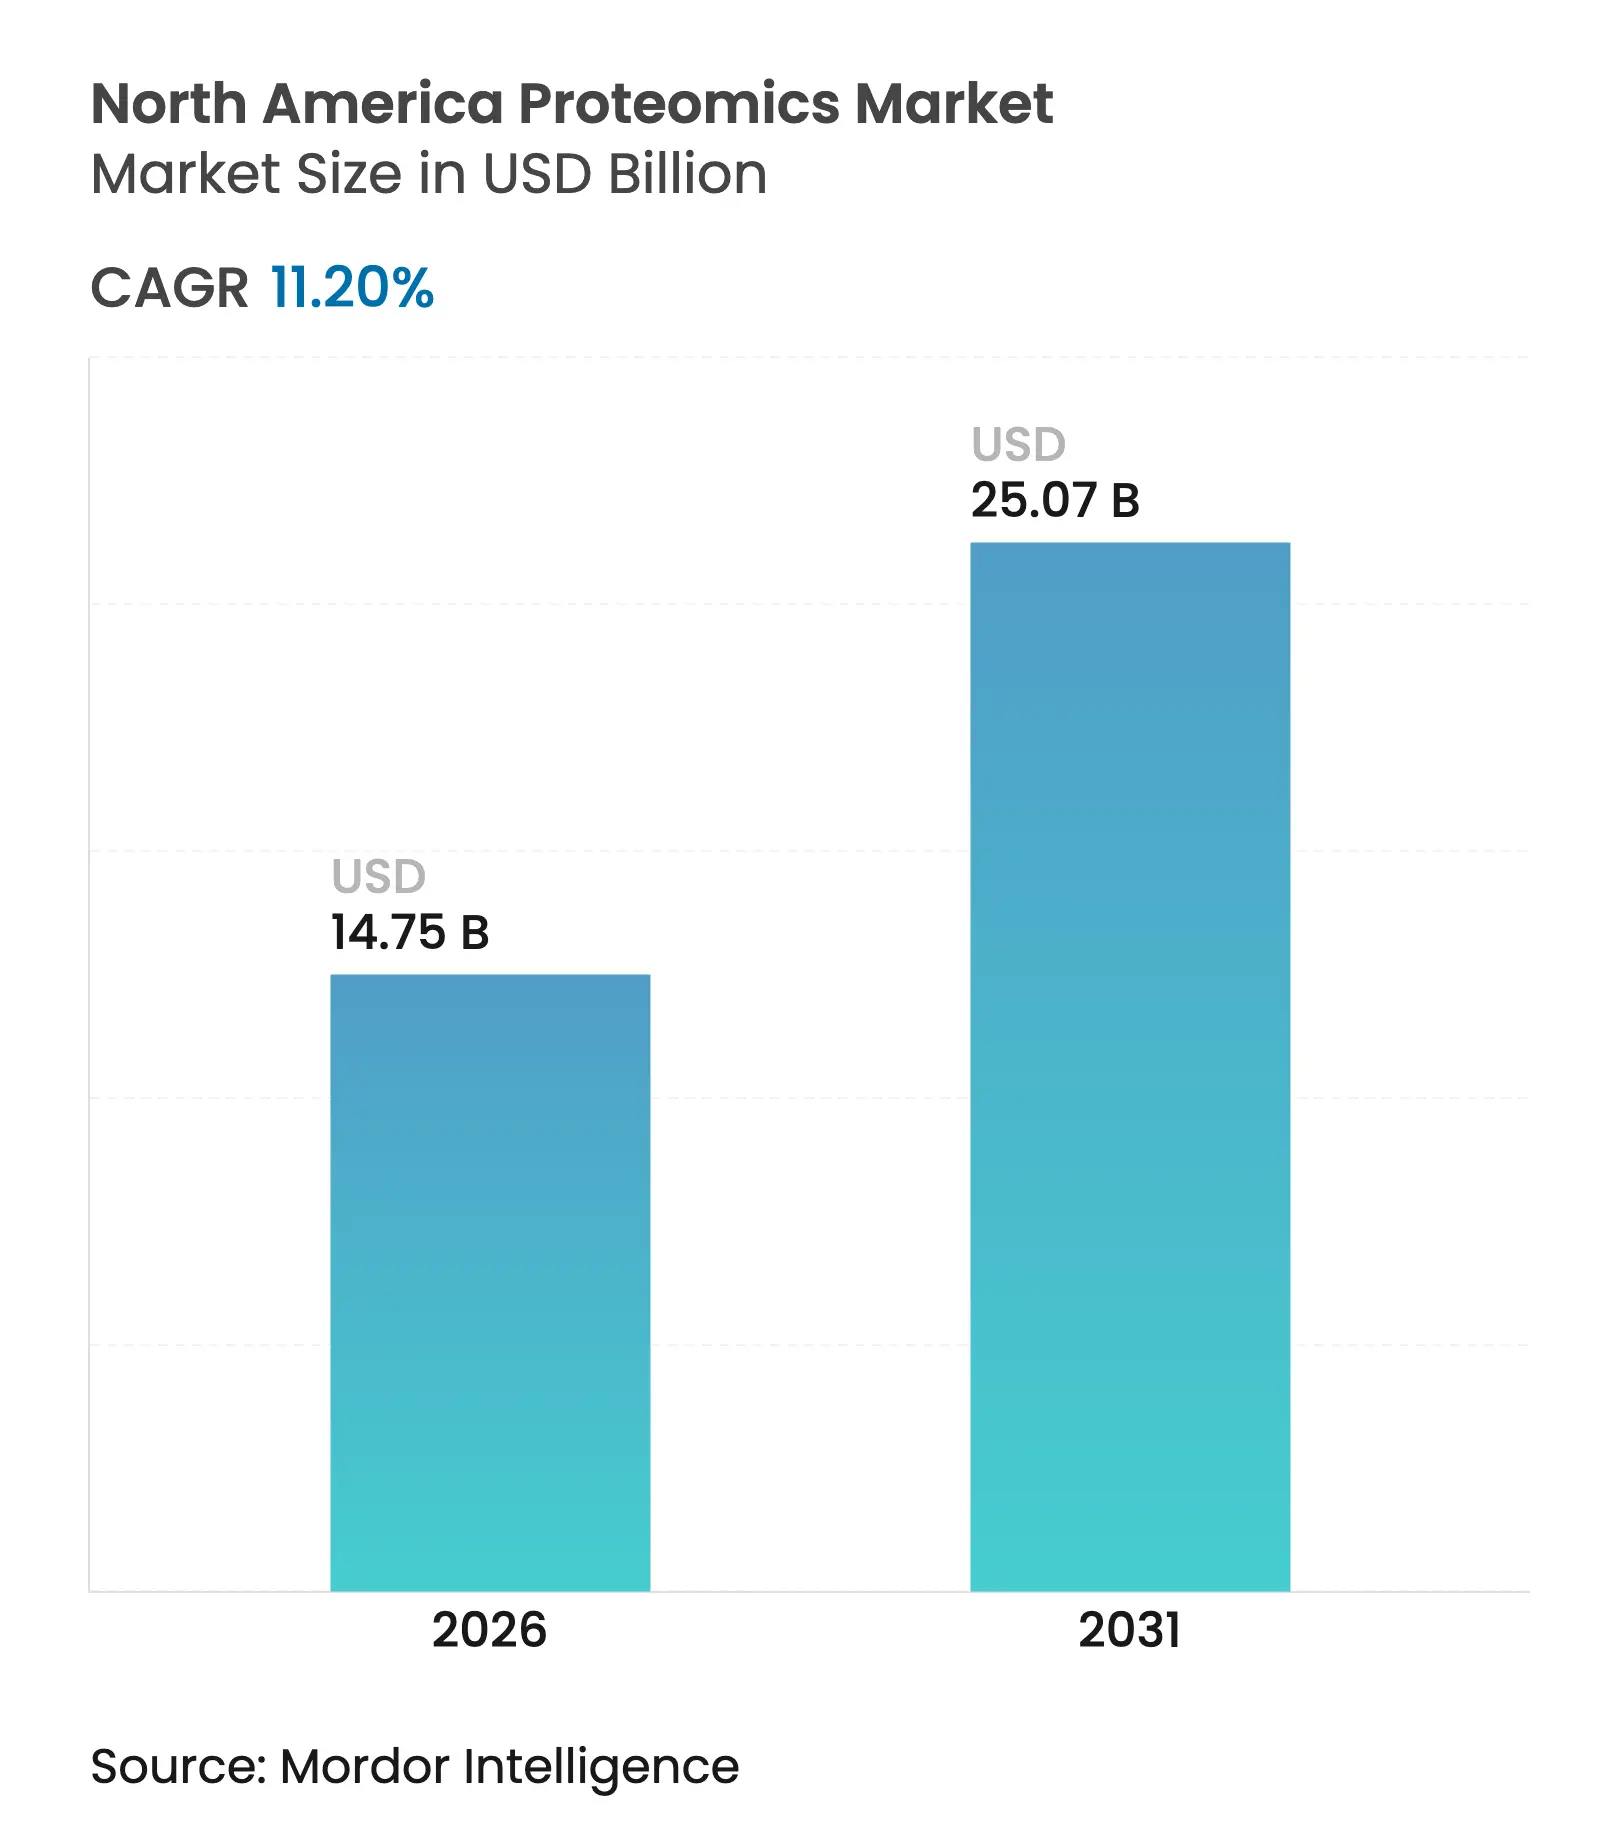
| Market Size (2026) | USD 14.75 Billion |
| Market Size (2031) | USD 25.07 Billion |
| Growth Rate (2026 - 2031) | 11.20 % CAGR |
| Market Concentration | Medium |
Major Players *Disclaimer: Major Players sorted in no particular order. Image © Mordor Intelligence. Reuse requires attribution under CC BY 4.0. |
North America Proteomics Market Analysis by Mordor Intelligence
The North America proteomics market size is expected to grow from USD 13.26 billion in 2025 to USD 14.75 billion in 2026 and is forecast to reach USD 25.07 billion by 2031 at 11.20% CAGR over 2026-2031. Rising integration of artificial intelligence with modern mass-spectrometry platforms, steady consolidation among instrument suppliers, and expanding venture capital flows into multi-omics start-ups combined to keep the region ahead of global peers. Strategic deals, such as Thermo Fisher Scientific’s USD 3.1 billion purchase of Olink, show how incumbents lock in next-generation protein-analysis assets to shorten discovery timelines. United States-based pharmaceutical sponsors dominate early-stage demand for high-throughput workflows, while smaller biotechnology firms and academic users increasingly rely on contract research organizations to offset capital barriers. Fuel for long-run growth also comes from regulatory moves that give clinical laboratories clearer pathways to adopt proteomic diagnostics, pushing hospitals and reference labs to modernize their analytical fleets.
Key Report Takeaways
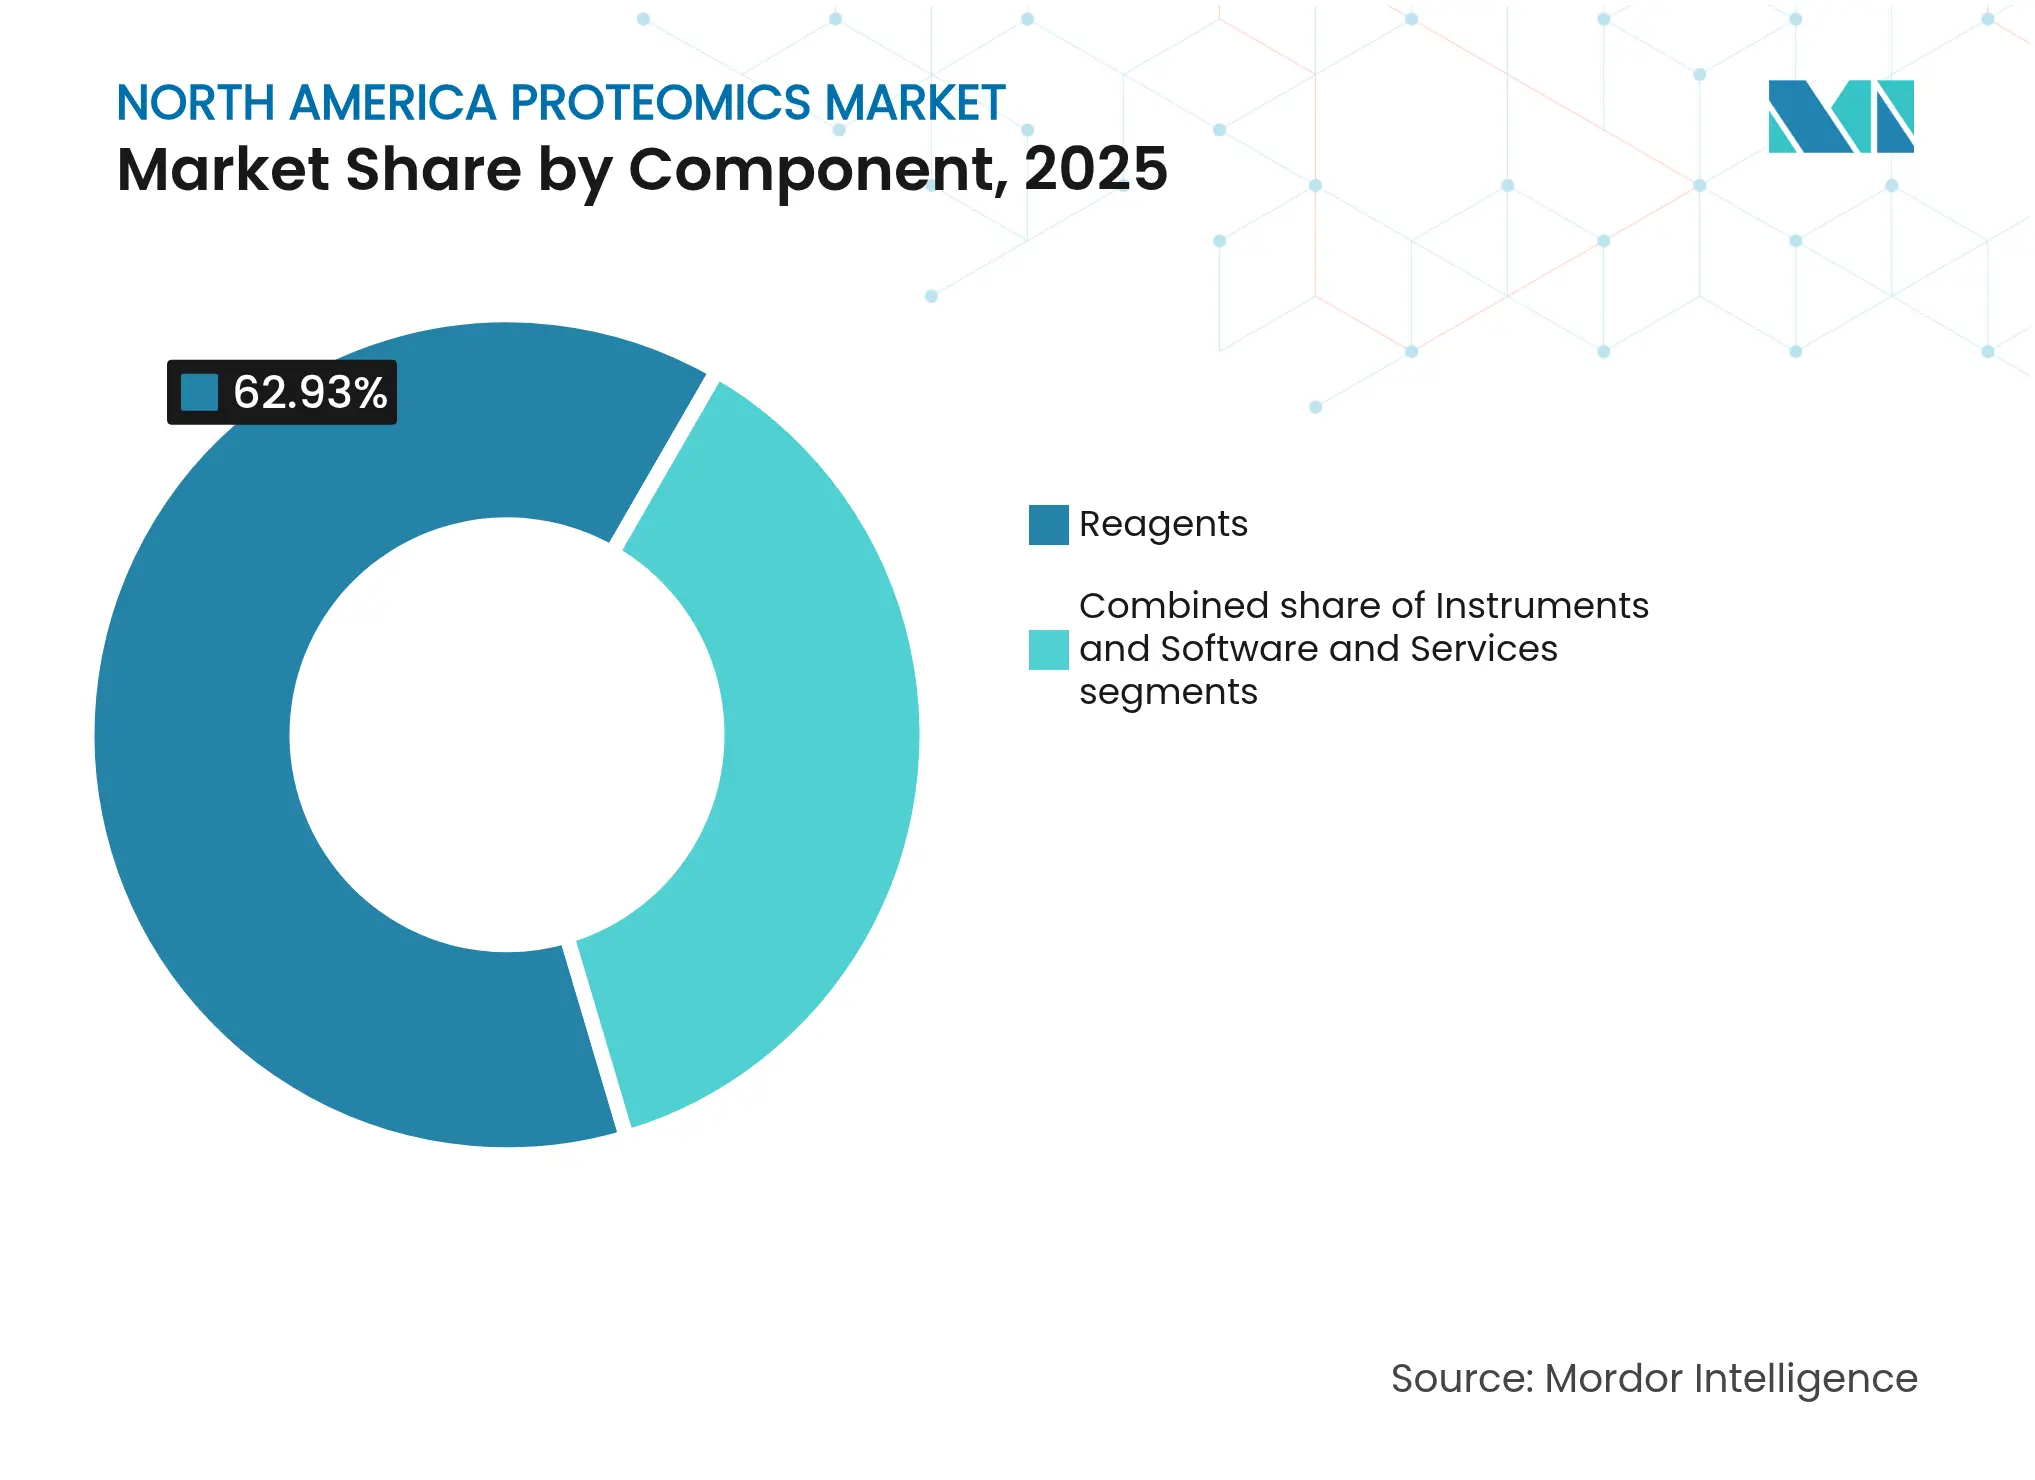
- By component, reagents led with 62.93% of the North America proteomics market share in 2025; software & services is projected to expand at a 12.21% CAGR to 2031.
- By technology, mass spectrometry accounted for 27.98% of the North America proteomics market size in 2025, whereas next-generation sequencing is set to accelerate at a 12.57% CAGR through 2031.
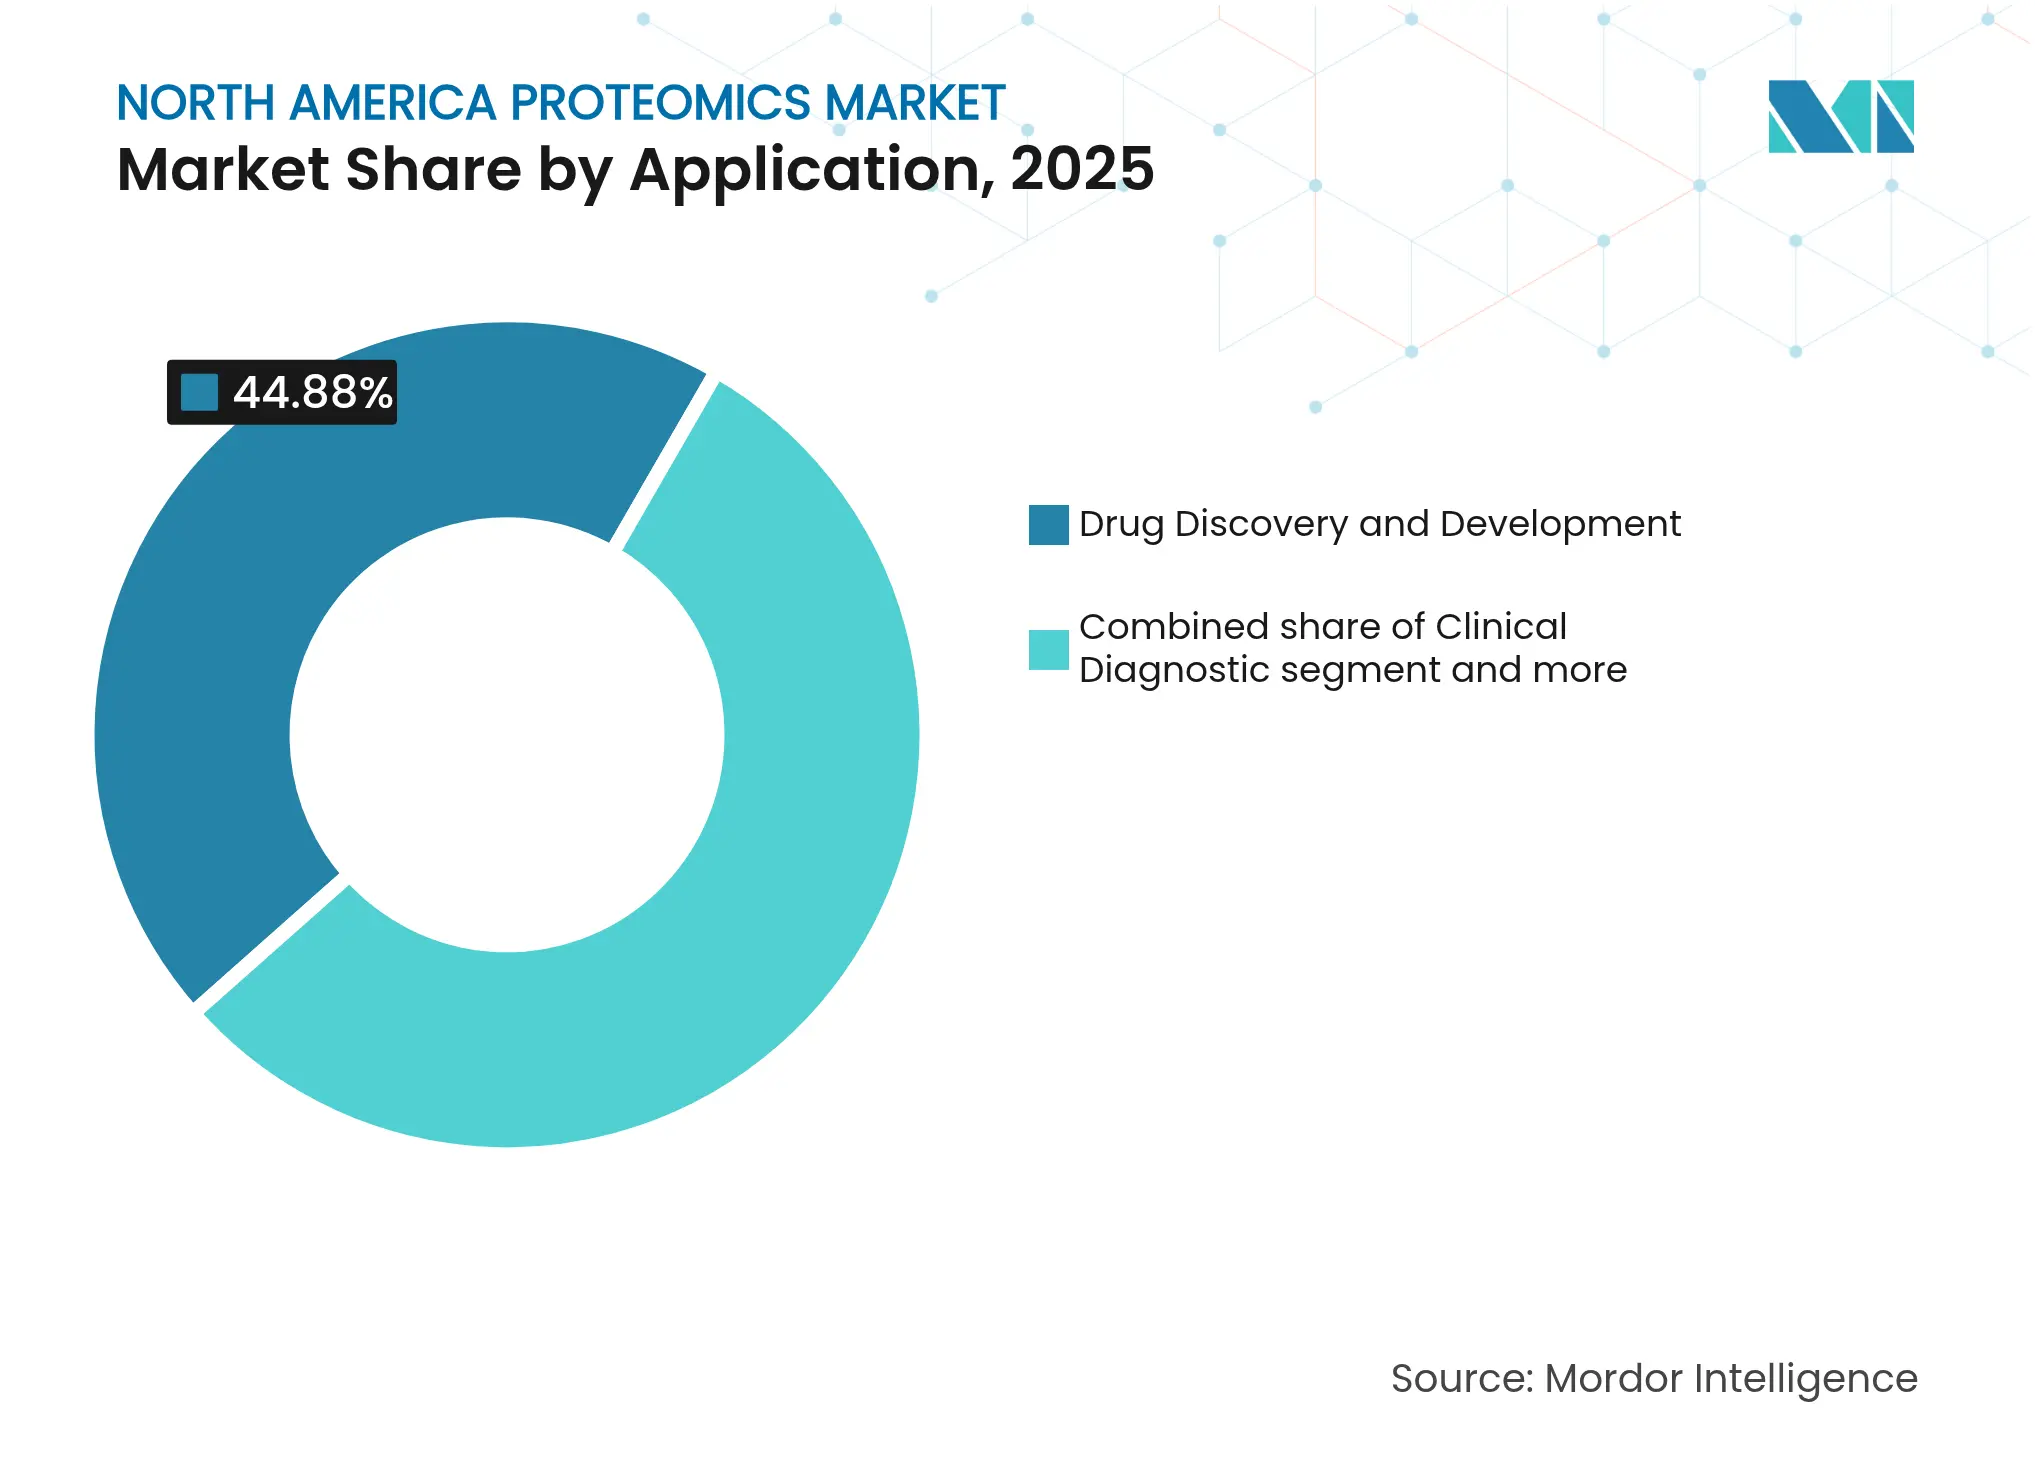
- By application, drug discovery and development held 44.88% North America proteomics market share in 2025; precision and personalized medicine is advancing at a 12.98% CAGR to 2031.
- By end-user, pharmaceutical and biotechnology companies captured 66.82% share in 2025, while contract research organizations record the fastest 11.94% CAGR through 2031.
- By geography, the United States dominated with 77.15% market share in 2025; Mexico posts the highest 12.44% CAGR between 2026 and 2031.
Note: Market size and forecast figures in this report are generated using Mordor Intelligence's proprietary estimation framework, updated with the latest available data and insights as of 2026.
North America Proteomics Market Trends and Insights
Drivers Impact Analysis
| Driver | (~) % Impact on CAGR Forecast | Geographic Relevance | Impact Timeline | |||
|---|---|---|---|---|---|---|
Escalating adoption of personalized medicine
Escalating adoption of personalized medicine
| +2.8% | North America, with strongest uptake in US precision oncology centers | Medium term (2-4 years) |
(~) % Impact on CAGR Forecast
:
+2.8%
|
Geographic Relevance
:
North America, with strongest uptake in US precision
oncology centers
|
Impact Timeline
:
Medium term (2-4 years)
|
Surge in proteomics-specific funding
Surge in proteomics-specific funding
| +2.1% | US biotech hubs, expanding to Canadian research institutes | Short term (≤ 2 years) | |||
Breakthroughs in high-throughput MS platforms
Breakthroughs in high-throughput MS platforms
| +1.9% | Global, with early deployment in North American pharmaceutical companies | Medium term (2-4 years) | |||
Expansion of biopharma proteomics spending
Expansion of biopharma proteomics spending
| +1.7% | US and Canada biopharmaceutical manufacturing corridors | Long term (≥ 4 years) | |||
AI-enabled proteogenomic decision tools
AI-enabled proteogenomic decision tools
| +1.5% | Technology centers in US, with spillover to Mexico's emerging biotech sector | Long term (≥ 4 years) | |||
Field-deployable microfluidic sample-prep kits
Field-deployable microfluidic sample-prep kits
| +1.1% | North America, with particular relevance for remote clinical sites | Medium term (2-4 years) | |||
| Source: Mordor Intelligence | ||||||
Escalating Adoption of Personalized Medicine
Precision oncology programs now embed deep-visual proteomics to guide therapy selection at the individual tumor-cell level. The FDA cleared four peptide-based therapeutics in 2024[1]Othman Al Musaimi, “2024 FDA TIDES (Peptides and Oligonucleotides) Harvest,” Pharmaceuticals, mdpi.com, demonstrating regulatory confidence in protein-driven interventions. Healthcare systems increasingly recognize that real-time protein signatures improve treatment prediction accuracy more than genomic markers alone, especially in cancers where expression profiles shift during disease progression. Demand therefore rises for high-sensitivity instruments able to quantify low-abundance proteins directly from clinical samples. These needs sustain premium pricing for novel Orbitrap and acoustic-ejection platforms that cut run times without sacrificing depth. As payers link reimbursement to measurable outcomes, laboratories prioritize assays that translate protein dynamics into actionable decisions, further lifting the North America proteomics market.
Surge in Proteomics-Specific Funding
Venture investors have made large follow-on commitments to companies combining live-cell imaging with AI analytics. Eikon’s USD 351 million raise in February 2025 pushed the firm’s valuation to USD 3.1 billion and signaled broad confidence in protein-tracking drug-discovery engines. Public support mirrors private enthusiasm: Canada’s skills strategy projects 65,000 additional bioeconomy workers by 2029[2]CASTL Canada, “Future-Proofing Canada’s Biomanufacturing Workforce,” castlcanada.ca, including 16,140 roles focused on biomanufacturing. With new capital, start-ups generate proprietary interaction datasets at unprecedented scale, erecting entry barriers that established players must address through partnerships or acquisitions. High liquidity, coupled with clear clinical use-cases, sustains the funding wave that underpins expansion of the North America proteomics market.
Breakthroughs in High-Throughput MS Platforms
Thermo Fisher’s Orbitrap Astral Zoom and Excedion Pro instruments[3]Youngbo Choi, “Recent Technological and Intellectual Property Trends in Antibody–Drug Conjugate Research,” Pharmaceutics, mdpi.com quadruple peptide-identification speed while improving sensitivity, letting biopharma customers screen more biomarkers per dollar. Complementary AI models such as InstaNovo+ decode spectra ten times faster than traditional database searches, boosting depth of coverage for immunotherapy targets. Acoustic-ejection mass-spectrometry systems now process a peptide every 1.5 seconds, delivering daily throughputs suitable for large-scale clinical trials. These advances compress discovery cycles, reinforcing vendor pricing power and adding momentum to the North America proteomics market.
Expansion of Biopharma Proteomics Spending
Biopharmaceutical sponsors are shifting budgets[4]Thermo Fisher Scientific, “Thermo Fisher Scientific Unveils Next-generation Mass Spectrometers at ASMS 2025,” thermofisher.com toward antibody-drug conjugates and RNA-protein therapeutics, modalities that depend on robust proteomics assays for potency and safety tests. Agilent’s USD 925 million purchase of BIOVECTRA brought a GMP manufacturing footprint that aligns with demand for integrated discovery-to-CMC workflows. Growth persists because protein biomarkers deliver clearer efficacy signals than DNA markers in complex diseases. Companies therefore ring-fence funds to build or outsource multi-omics platforms, supporting consistent double-digit spending growth that feeds the North America proteomics market.
Restraints Impact Analysis
| Restraint | (~) % Impact on CAGR Forecast | Geographic Relevance | Impact Timeline | |||
|---|---|---|---|---|---|---|
High capital cost of instruments
High capital cost of instruments
| -1.8% | North America, particularly affecting smaller biotech companies and academic institutions | Short term (≤ 2 years) |
(~) % Impact on CAGR Forecast
:
-1.8%
|
Geographic Relevance
:
North America, particularly affecting smaller biotech
companies and academic institutions
|
Impact Timeline
:
Short term (≤ 2 years)
|
Bioinformatics talent shortage
Bioinformatics talent shortage
| -1.3% | US and Canada, with acute shortages in specialized AI-proteomics roles | Medium term (2-4 years) | |||
Patent thickets on affinity reagents
Patent thickets on affinity reagents
| -0.9% | Global, with the strongest impact on US biotechnology companies developing novel antibody-based assays | Long term (≥ 4 years) | |||
Cyber-security risks in cloud multi-omics
Cyber-security risks in cloud multi-omics
| -0.7% | North America, particularly affecting companies with cloud-based data integration platforms | Medium term (2-4 years) | |||
| Source: Mordor Intelligence | ||||||
High Capital Cost of Instruments
Flagship mass-spectrometry units can cost well above USD 1 million, a hurdle that delayed orders in 2024. Bio-Rad Laboratories saw its life-science sales slip 16.5% in Q2 2024 as customers deferred purchases, prompting the firm to guide full-year revenue down 2.5% to 4.0%. Smaller biotechs and academic centers lack balance-sheet flexibility, leading them to rent time at core facilities or engage service labs. Leasing smooths cash flow but raises lifetime operating expense. Rapid innovation also shortens depreciation cycles, forcing caution on buyers and trimming short-term growth for the North America proteomics market.
Bioinformatics Talent Shortage
Modern proteomics platforms generate terabytes of raw data per run, yet only a limited pool of specialists can script Python pipelines, manage cloud architectures, and interpret AI-driven models. Surveys show 69% of biopharma job postings now require automation skills, while 27% demand data-science expertise. Canadian employers report gaps between academic training and Good Manufacturing Practice realities, with 74% planning to hire within three years. Recruiter competition lifts salaries and lengthens project timelines. The resulting bottleneck dampens deployment speeds and marginally cools the North America proteomics market.
Segment Analysis
By Component: Reagents Remain Cornerstone of Daily Workflows
Reagents captured 62.93% of the North America proteomics market share in 2025 because every experiment requires fresh antibodies, enzymes, buffers, and labeling kits. Suppliers lock in predictable revenue by bundling consumables with instruments. The software & services slice is much smaller, yet it delivers a 12.21% CAGR because laboratories must extract insights from high-volume data. Cloud platforms equipped with pretrained AI models simplify spectrum annotation, protein-protein interaction mapping, and clinical-trial report generation. Instruments command premium prices but represent a cyclical buy-decision. Vendors therefore tie service contracts to hardware to smooth cash flows and improve customer retention across the North America proteomics market.
Growth in software also reflects a pivot toward subscription models. Data analysis portals charge per sample or per month, turning unpredictable capital expenses into operating budgets. Managed-service firms now integrate LIMS, statistical pipelines, and regulatory-grade audit trails, letting understaffed hospitals gain modern capabilities without hiring full-time bioinformaticians. As data volumes swell, so does demand for encrypted cloud storage, backup, and cyber-security audits. Each of these trends adds momentum to the North America proteomics industry and lifts long-run platform value for developers who can enable seamless reagent-to-report workflows.
Note: Segment shares of all individual segments available upon report purchase
By Technology: Mass Spectrometry Leads, Next-Generation Sequencing Climbs Quickly
Mass spectrometry held 27.98% of the North America proteomics market size in 2025, reflecting decades of reliability, vast legacy datasets, and broad regulatory acceptance. High-resolution Orbitrap and time-of-flight systems now pair with foundation AI models that predict spectrum quality and post-translational modifications in real time. Next-generation sequencing platforms chart a 12.57% CAGR because vendors blend genomics, transcriptomics, and proteomics into single multi-omics reads. Illumina plans to commercialize spatial transcriptomics add-ons by 2026, combining its sequencers with NVIDIA GPUs to accelerate protein-structure insight within oncology studies.
Microfluidic sample-handling tools shrink reaction volumes, enabling low-cost point-of-care tests for infectious-disease proteotyping. Chromatography and capillary electrophoresis retain niche relevance for sample cleanup, while protein microarrays support high-throughput antibody discovery. Hybrid instruments that combine MS, NGS, and fluorescence-imaging modules reduce laboratory footprints and maximize asset utilization. Such convergence improves workflow efficiency, keeping end users loyal to suppliers that provide total solutions, thereby expanding the North America proteomics market.
By Application: Drug Discovery Dominant but Precision Medicine Accelerates
Drug discovery and development consumed 44.88% of the North America proteomics market size in 2025 because pharmaceutical sponsors rely on protein-level readouts from target validation through toxicity assessment. Companion-diagnostic development for antibody-drug conjugates keeps MS core facilities booked months in advance. Precision and personalized medicine, however, grows at 12.98% CAGR as hospitals deploy proteomic assays to stratify patients and monitor therapy in near real time. The FDA introduced a distinct classification for clinical mass-spectrometry devices in 2024, opening a clearer regulatory path for lab-developed proteomic tests.
Biomarker discovery remains critical because plasma proteomics panels now quantify more than 9,000 proteins per patient, enriching longitudinal cohorts for cardiovascular and neurodegenerative research. Agricultural and environmental proteomics emerge as spill-over segments, especially for food-safety surveillance. Vendors that package discovery, clinical trial support, and companion diagnostics in one offering win larger contracts, increasing competitive intensity within the North America proteomics market.
Note: Segment shares of all individual segments available upon report purchase
By End-User: Contract Research Organizations Gain Momentum
Pharmaceutical and biotechnology companies still represented 66.82% revenue share in 2025 because they fund in-house target discovery and IND-enabling studies. Yet CROs log a 11.94% CAGR because sponsors convert fixed costs into variable fees by outsourcing proteomic workflows. The U.S. CMO/CRO industry is projected to grow at a fast pace by 2033. CROs, therefore, build specialized mass-spectrometry fleets and recruit data-science talent to provide end-to-end services.
Academic and government institutes remain vital for method innovation, yet grant budgets limit equipment refresh cycles. Diagnostic laboratories enter the market as new regulatory clarity encourages them to validate MS-based assays for metabolic disorders. Equipment vendors respond by launching benchtop sequencers such as Quantum-Si’s Platinum Pro, designed for small-volume clinical settings. These dynamics diversify revenue streams and broaden the North America proteomics market base.
Geography Analysis
United States facilities underpin 77.15% of the North America proteomics market size in 2025 because they host the largest concentration of pharmaceutical R&D budgets, clinical trial centers, and core mass-spectrometry laboratories. Regulatory frameworks shape demand: the FDA’s updated rules for laboratory-developed tests and clinical mass-spectrometry systems tightened compliance obligations yet also standardized expectations, enabling faster rollout of nationwide testing programs. Strategic acquisitions such as Thermo Fisher’s Olink deal and Agilent’s BIOVECTRA purchase reinforce U.S. leadership by embedding cutting-edge immuno-proteomics platforms into local supply chains. Venture investment cycles stay robust, with multiple proteomics start-ups exceeding USD 1 billion valuations within three years of launch, although hiring constraints in bioinformatics continue to slow project delivery. The country’s forecast CAGR through 2031 is 10.86%, confirming its anchor role in the North America proteomics market.
Canada accelerates at 11.59% CAGR thanks to public programs that train the next generation of biomanufacturing and analytical specialists. The federal workforce study highlighted demand for 65,000 new life-science employees by 2029. Harmonized regulatory frameworks let Canadian research institutes participate in cross-border oncology trials, drawing instrument placements northward. Favorable exchange rates and provincial tax incentives attract foreign sponsors looking for cost-efficient collaborative sites. However, shortages of senior computational biologists limit the pace at which local CROs can seize large-scale multi-omics contracts. Addressing these gaps will determine how much extra share Canada secures within the North America proteomics market.
Mexico records the fastest 12.44% CAGR because nearshoring policies coax multinational drug manufacturers to expand production campuses in Guadalajara and Monterrey. Government incentives for clinical-research infrastructure and alignment with FDA quality guidelines lower operational risk for sponsors, thereby boosting orders for proteomic instrumentation across central reference labs. Domestic talent pipelines still lack advanced bioinformatics training, so global companies partner with universities to develop certificate programs in mass-spectrometry data analysis. Infrastructure upgrades remain the main bottleneck, yet steady capital inflows from multinational clients position Mexico as the rising star of the North America proteomics market.

Reports are available across multiple geographies.
Gain in-depth market insights across regions to support informed decisions.
Competitive Landscape
Market Concentration
Competition centers on end-to-end solutions that merge high-resolution detection with cloud-native analytics. Market leaders pursue bolt-on deals: Thermo Fisher added Olink’s proximity-extension assay to strengthen single-cell and low-abundance protein coverage, while Agilent folded BIOVECTRA into its portfolio to secure GMP biologics production capacity. Illumina’s alliance with NVIDIA embeds accelerated DRAGEN pipelines into sequencers, giving users real-time multi-omics alignment. Such moves signal that hardware margins alone no longer suffice; companies must own data infrastructure and analytical IP to defend share in the North America proteomics market.
Emerging disruptors target field-deployable workflows. Portable microfluidic prep kits pair with acoustic-ejection MS to enable same-day biomarker panels in oncology clinics. Start-ups also use large protein-protein interaction datasets to train foundation models that infer druggable sites with minimal lab work. Intellectual-property strategy shifts alongside technology: recent USPTO guidance on means-plus-function claims for antibodies broadens patent scope, letting innovators protect epitope-agnostic functionalities. This raises entry barriers yet invites litigation that could reshape control points within the North America proteomics industry.
Competitive intensity rises as CROs spin up full-service proteomics divisions. Vendors now bundle hardware leases, reagent consumables, data-science support, and regulatory documentation into multiyear contracts. Price competition focuses less on per-run costs and more on total turnaround time to clinical decision. Customers gravitate toward partners that can deliver validated data, integrate laboratory information-management systems, and withstand cybersecurity audits. Players that fail to scale AI pipelines or secure niche assay IP risk margin compression and share erosion in the North America proteomics market.
North America Proteomics Industry Leaders

*Disclaimer: Major Players sorted in no particular order
Recent Industry Developments
- June 2025: Thermo Fisher Scientific unveiled Orbitrap Astral Zoom and Orbitrap Excedion Pro instruments, offering enhanced speed and sensitivity aimed at precision oncology workflows.
- June 2025: Waters Corporation introduced BioResolve Protein A Affinity Columns using MaxPeak Premier Technology to raise antibody titer sensitivity sevenfold for biotherapeutic development.
- January 2025: Quantum-Si launched Platinum Pro benchtop protein sequencer featuring Pro Mode for custom application development, with Avantor as exclusive distributor in the United States and Canada.
- January 2025: Illumina announced collaboration with NVIDIA to accelerate multi-omic data analysis by integrating DRAGEN pipelines with GPU architecture.
Table of Contents for North America Proteomics Industry Report
1. Introduction
- 1.1Study Assumptions & Market Definition
- 1.2Scope of the Study
2. Research Methodology
3. Executive Summary
4. Market Landscape
- 4.1Market Overview
- 4.2Market Drivers
- 4.2.1Escalating adoption of personalized medicine
- 4.2.2Surge in proteomics?specific funding
- 4.2.3Breakthroughs in high-throughput MS platforms
- 4.2.4Expansion of biopharma proteomics spending
- 4.2.5AI-enabled proteogenomic decision tools
- 4.2.6Field-deployable microfluidic sample-prep kits
- 4.3Market Restraints
- 4.3.1High capital cost of instruments
- 4.3.2Bioinformatics talent shortage
- 4.3.3Patent thickets on affinity reagents
- 4.3.4Cyber-security risks in cloud multi-omics
- 4.4Supply Chain Analysis
- 4.5Regulatory Landscape
- 4.6Technological Outlook
- 4.7Porter's Five Forces Analysis
- 4.7.1Threat of New Entrants
- 4.7.2Bargaining Power of Buyers
- 4.7.3Bargaining Power of Suppliers
- 4.7.4Threat of Substitutes
- 4.7.5Intensity of Competitive Rivalry
5. Market Size & Growth Forecasts (Value)
- 5.1By Component
- 5.1.1Instruments
- 5.1.2Reagents
- 5.1.3Software and Services
- 5.2By Technology
- 5.2.1Mass Spectrometry
- 5.2.2Spectroscopy
- 5.2.3Chromatography
- 5.2.4Next-Generation Sequencing
- 5.2.5Protein Microarrays
- 5.2.6Microfluidics
- 5.2.7X-ray Crystallography
- 5.2.8Other Technologies
- 5.3By Application
- 5.3.1Drug Discovery & Development
- 5.3.2Clinical Diagnostics
- 5.3.3Biomarker Discovery
- 5.3.4Precision and Personalized Medicine
- 5.3.5Agricultural & Environmental Proteomics
- 5.3.6Other Applications
- 5.4By End-user
- 5.4.1Pharmaceutical & Biotechnology Companies
- 5.4.2Academic & Research Institutes
- 5.4.3Contract Research Organizations
- 5.4.4Other End-users
- 5.5By Geography
- 5.5.1United States
- 5.5.2Canada
- 5.5.3Mexico
6. Competitive Landscape
- 6.1Market Concentration
- 6.2Competitive Benchmarking
- 6.3Market Share Analysis
- 6.4Company Profiles (includes Global level Overview, Market level overview, Core Segments, Financials as available, Strategic Information, Market Rank/Share for key companies, Products & Services, and Recent Developments)
- 6.4.1Agilent Technologies Inc.
- 6.4.2Alamar Biosciences, Inc.
- 6.4.3Bioinformatics Solutions Inc.
- 6.4.4Bio-Rad Laboratories Inc.
- 6.4.5Bruker Corporation
- 6.4.6Creative Proteomics
- 6.4.7Danaher Corporation
- 6.4.8GE Healthcare
- 6.4.9Illumina Inc.
- 6.4.10Merck KGaA
- 6.4.11Nautilus Biotechnology
- 6.4.12Oxford Nanopore Technologies
- 6.4.13Promega Corporation
- 6.4.14QIAGEN N.V.
- 6.4.15Revvity, Inc.
- 6.4.16Seer Inc.
- 6.4.17Shimadzu Corporation
- 6.4.18SomaLogic Inc.
- 6.4.19Thermo Fisher Scientific Inc.
- 6.4.20Waters Corporation
7. Market Opportunities & Future Outlook
- 7.1White-space & Unmet-Need Assessmen
Research Methodology Framework and Report Scope
Market Definitions and Key Coverage
Segmentation Overview
- By Component
- Instruments
- Reagents
- Software and Services
- Instruments
- By Technology
- Mass Spectrometry
- Spectroscopy
- Chromatography
- Next-Generation Sequencing
- Protein Microarrays
- Microfluidics
- X-ray Crystallography
- Other Technologies
- Mass Spectrometry
- By Application
- Drug Discovery & Development
- Clinical Diagnostics
- Biomarker Discovery
- Precision and Personalized Medicine
- Agricultural & Environmental Proteomics
- Other Applications
- Drug Discovery & Development
- By End-user
- Pharmaceutical & Biotechnology Companies
- Academic & Research Institutes
- Contract Research Organizations
- Other End-users
- Pharmaceutical & Biotechnology Companies
- By Geography
- United States
- Canada
- Mexico
- United States
Detailed Research Methodology and Data Validation
Primary Research
Desk Research
Market-Sizing & Forecasting
Data Validation & Update Cycle
Why Mordor's North America Proteomics Baseline Commands Reliability
Benchmark comparison
| Market Size | Anonymized source | Primary gap driver | ||
|---|---|---|---|---|
USD 13.26 B (2025) | Mordor Intelligence | Anonymized source:Mordor Intelligence | Primary gap driver: | |
USD 18.75 B (2024) | Global Consultancy A | Includes outsourcing services and spatial-omics revenues; older base year | ||
USD 16.43 B (2024) | Industry Journal B | Uses uniform CAGR, folds protein microarrays into core scope | ||
USD 12.72 B (2024) | Analytics Firm C | Derives value by applying global share, limited interview validation |