Recombinant Protein Market Size and Share
Market Overview
| Study Period | 2020 - 2031 |
|---|---|
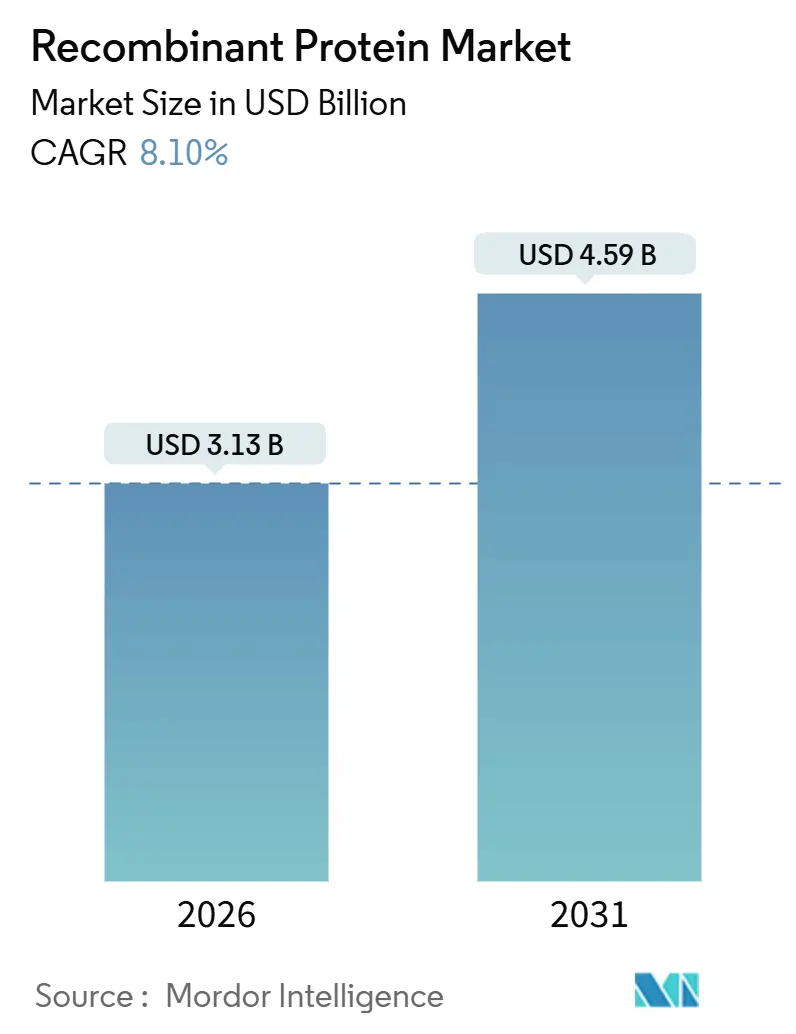
| Market Size (2026) | USD 3.13 Billion |
| Market Size (2031) | USD 4.59 Billion |
| Growth Rate (2026 - 2031) | 8.10% CAGR |
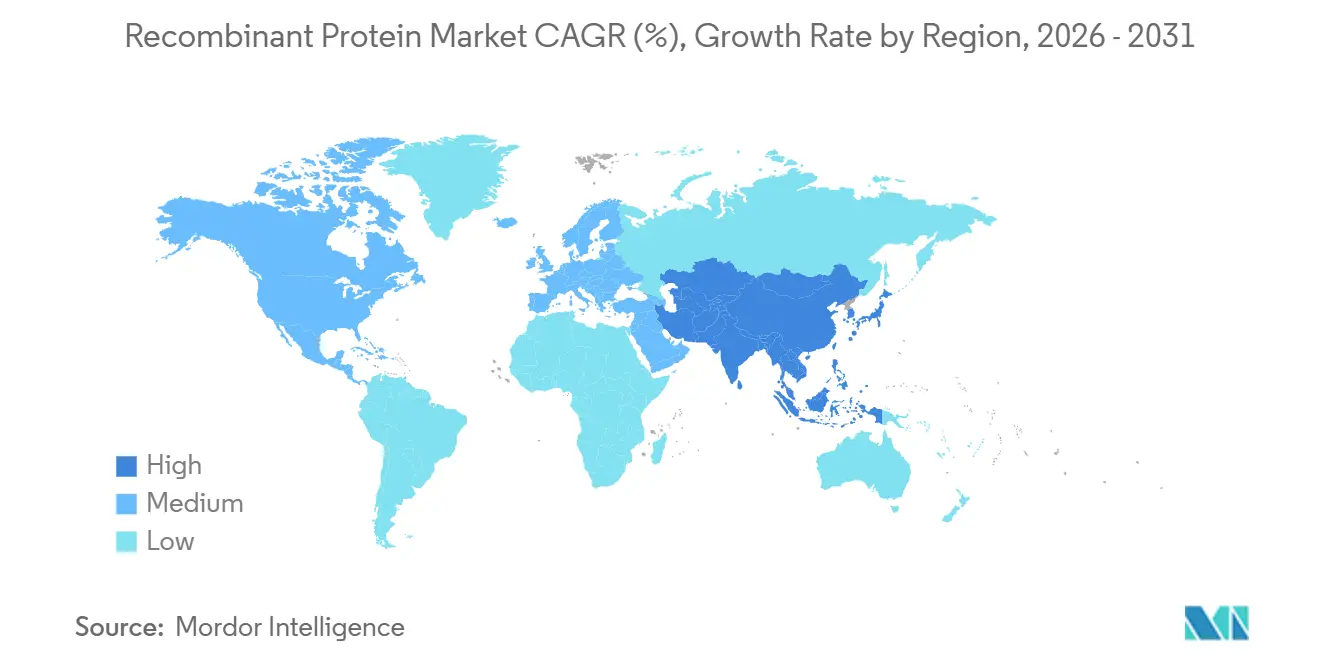
| Fastest Growing Market | Asia-Pacific |
| Largest Market | North America |
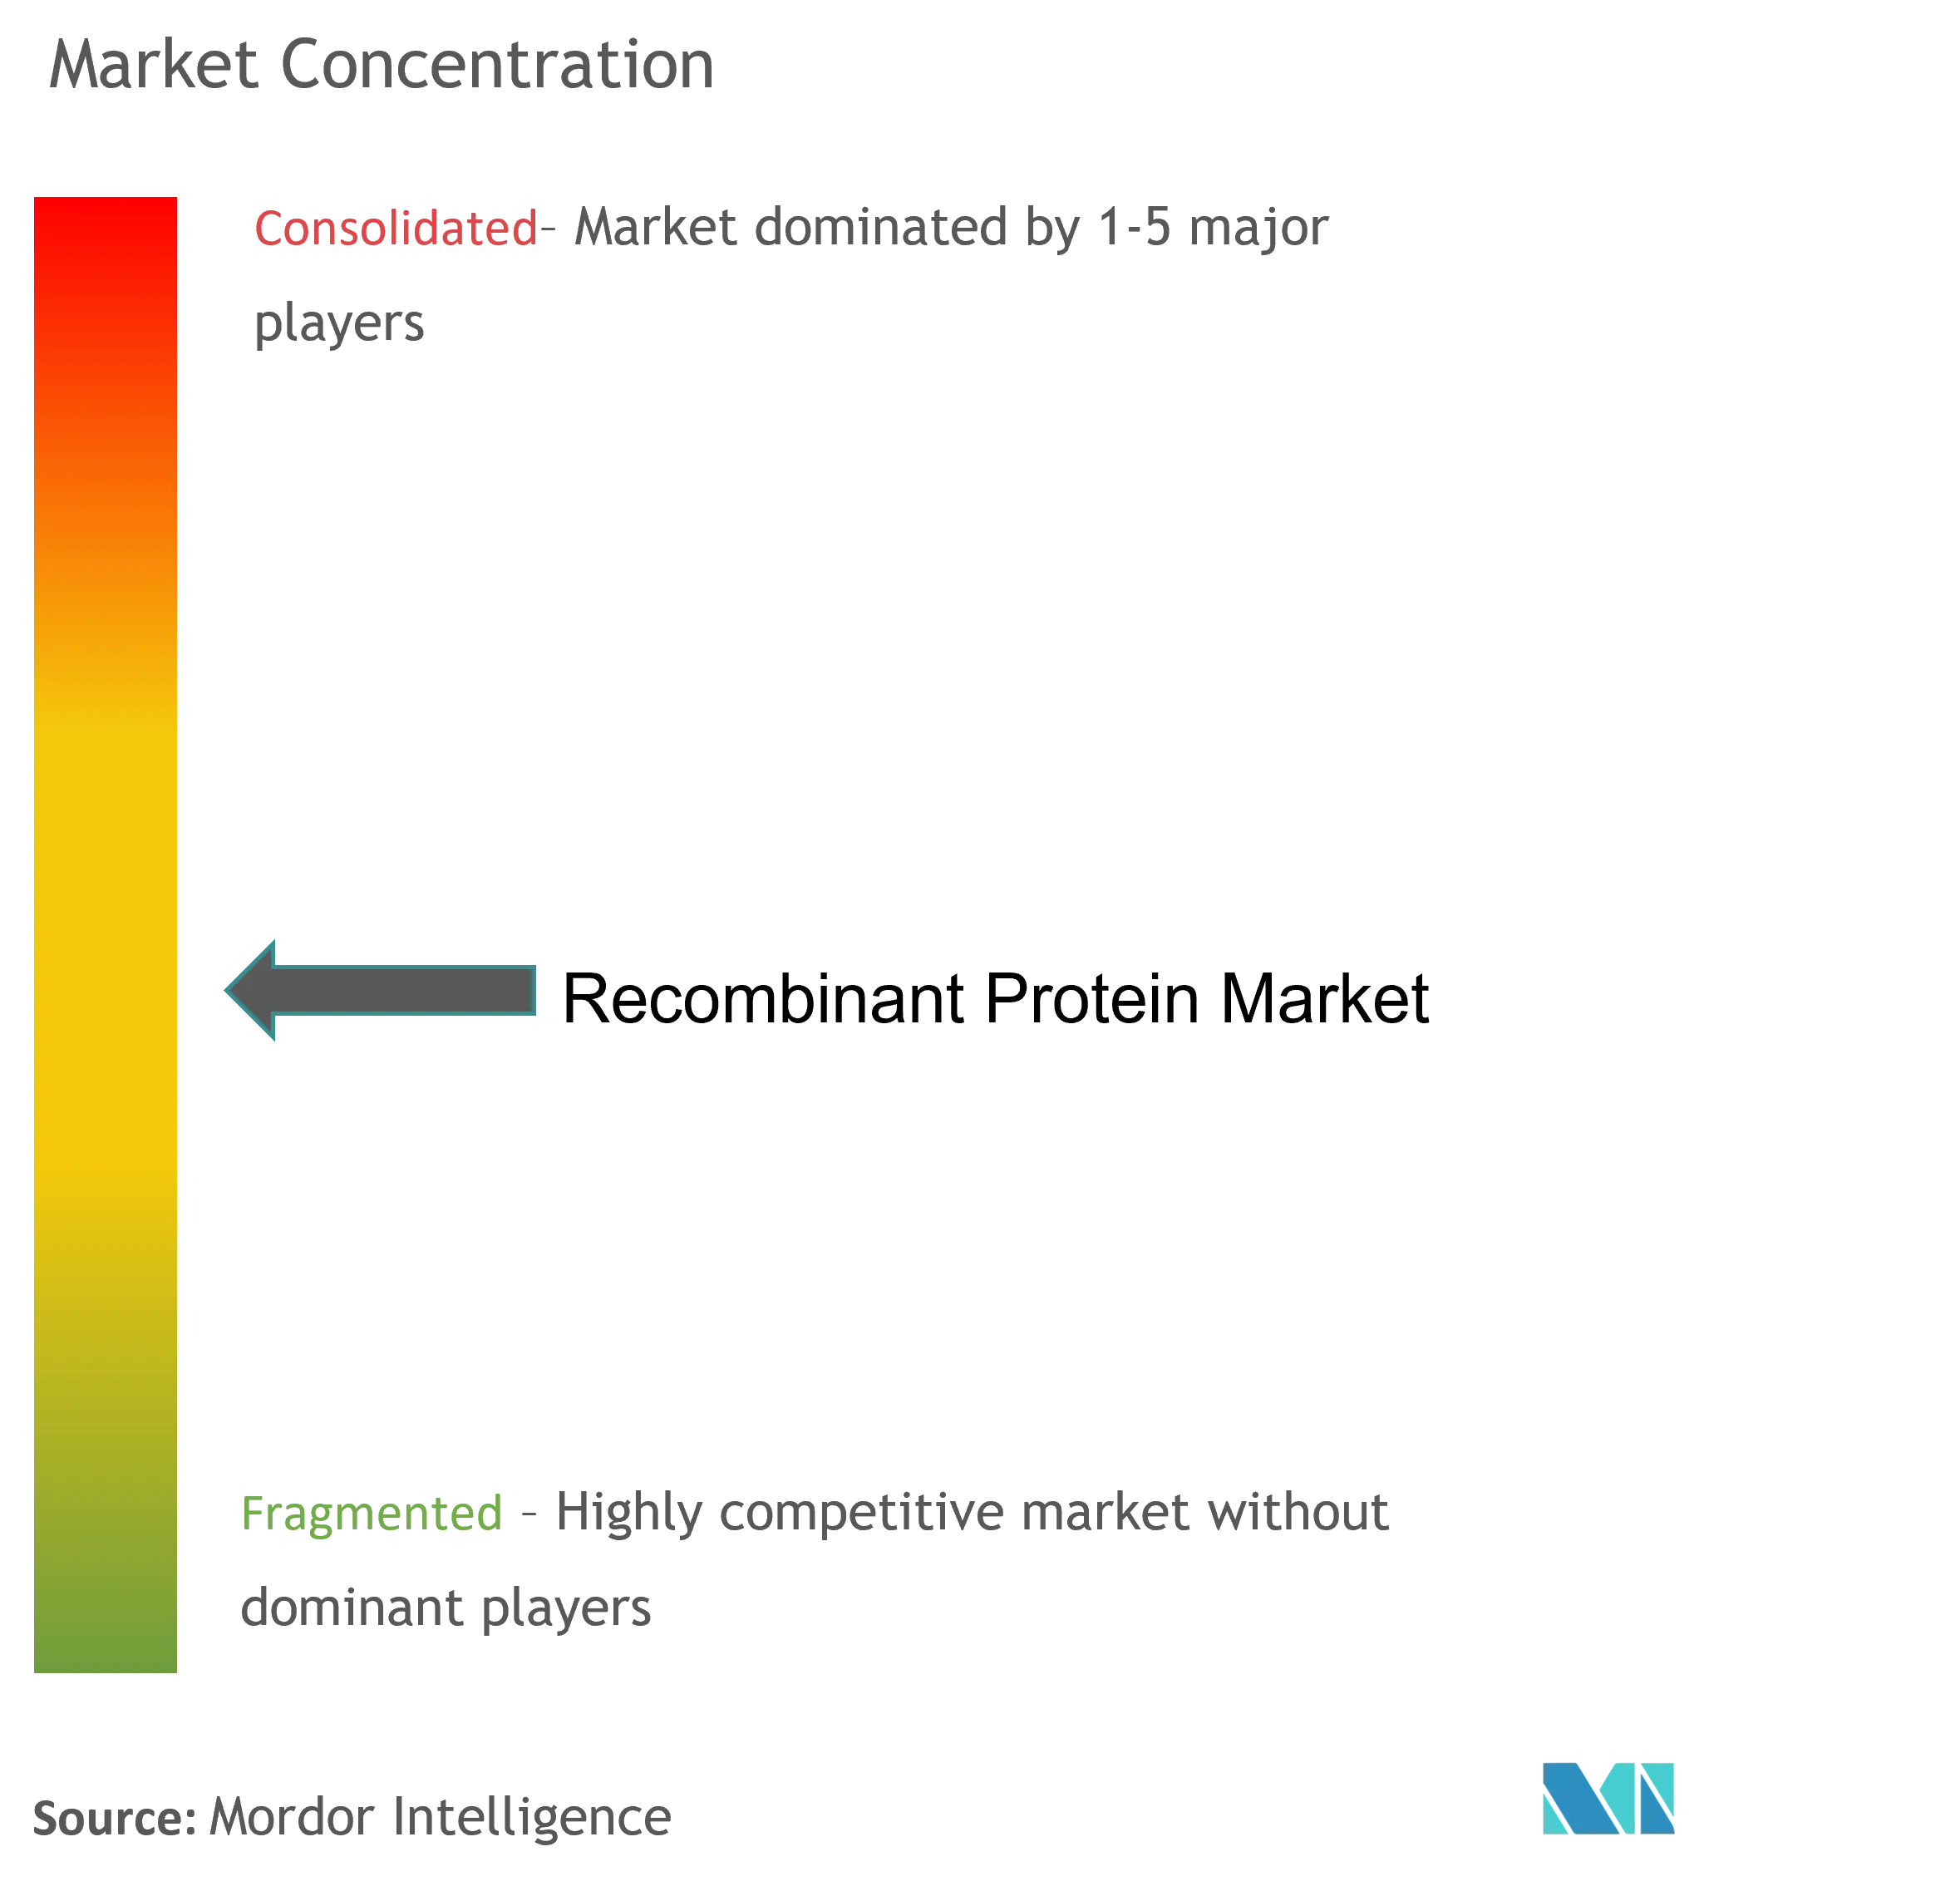
| Market Concentration | Medium |
Major Players *Disclaimer: Major Players sorted in no particular order Image © Mordor Intelligence. Reuse requires attribution under CC BY 4.0. | |
Recombinant Protein Market Analysis by Mordor Intelligence
The Recombinant Protein Market size is estimated at USD 3.13 billion in 2026, and is expected to reach USD 4.59 billion by 2031, at a CAGR of 8.10% during the forecast period (2026-2031).
Expansion reflects a strategic pivot away from single-target monoclonal antibodies toward precision biologics such as fusion constructs, bispecific formats, and AI-designed scaffolds that address complex oncology, metabolic, and rare-disease indications. Mammalian expression platforms remain the workhorse, yet cell-free and synthetic systems are gaining momentum on the back of faster cycle times and lower capital intensity. Contract development and manufacturing organizations (CDMOs) continue to scale across Asia-Pacific, leveraging cost advantages to win global programs, while FDA fast-track designations and robust National Institutes of Health grants sustain North American leadership. Competitive pressure is mounting as biosimilar entrants, single-use bioreactors, and AI-enabled design shorten timelines and compress margins, creating both risk and opportunity for incumbents.
Key Report Takeaways
- By product, cytokines and growth factors led with 25.2% revenue share in 2025; fusion proteins posted the fastest 8.82% CAGR through 2031.
- By expression system, mammalian platforms captured 46.1% of the recombinant protein market share in 2025, while cell-free systems expanded at an 8.54% CAGR to 2031.
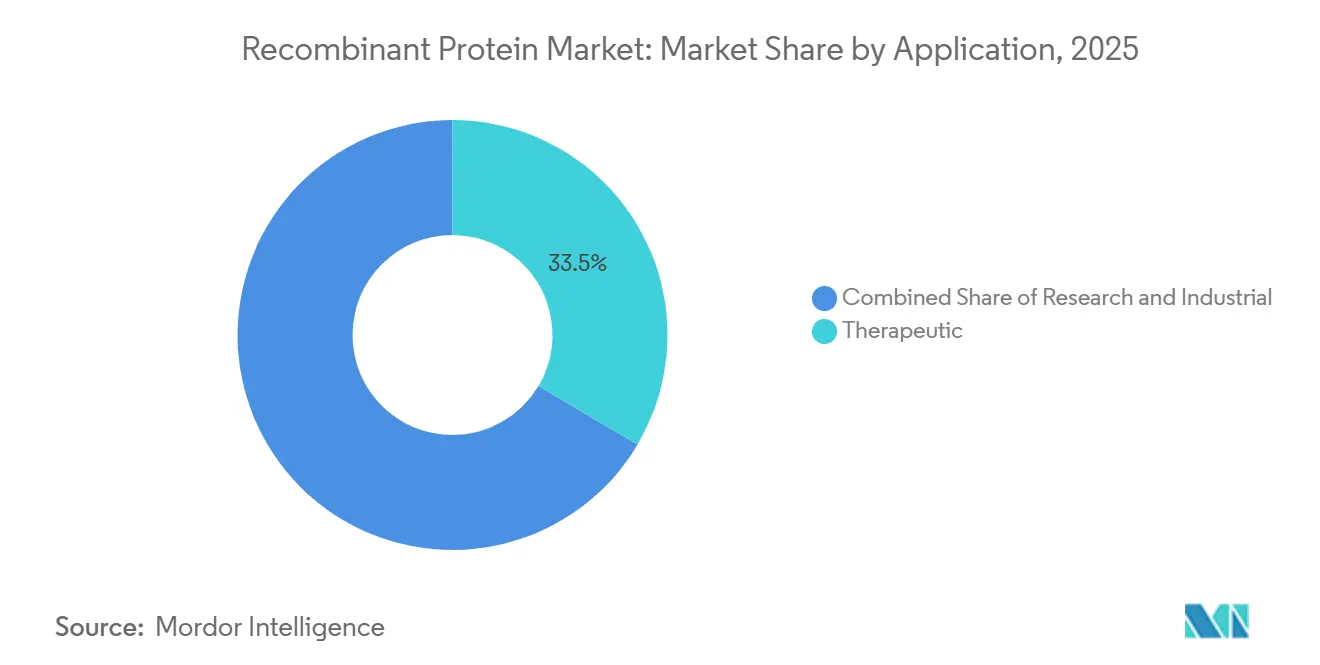
- By application, therapeutic use commanded 33.5% of the recombinant protein market size in 2025 and research is projected to grow at an 8.44% CAGR.
- By end user, pharmaceutical and biotechnology companies held 39.7% revenue share in 2025; CROs and CDMOs registered the highest 8.63% CAGR through 2031.
- By geography, North America accounted for 42.1% revenue in 2025; Asia-Pacific is the fastest-growing region at an 8.81% CAGR between 2026 and 2031.
Note: Market size and forecast figures in this report are generated using Mordor Intelligence’s proprietary estimation framework, updated with the latest available data and insights as of January 2026.
Global Recombinant Protein Market Trends and Insights
Drivers Impact Analysis*
| Drivers | (~) % Impact on CAGR Forecast | Geographic Relevance | Impact Timeline |
|---|---|---|---|
| Chronic-Disease Burden Elevates Demand For Biologics | +1.8% | Global, with concentration in North America, Europe, and urban Asia-Pacific | Long term (≥ 4 years) |
| Breakthroughs In High-Yield Expression & Purification Platforms | +1.5% | Global, led by North America and Europe bioclusters | Medium term (2-4 years) |
| Expansion Of Bioclusters & CDMO Capacity Worldwide | +1.4% | Asia-Pacific core, spill-over to North America and Europe | Medium term (2-4 years) |
| Favorable Biologics Reimbursement & Fast-Track Approvals | +1.2% | North America and Europe, emerging in select Asia-Pacific markets | Short term (≤ 2 years) |
| AI-Driven De Novo Protein Design Unlocks Novel Pipelines | +0.9% | North America and Europe, early adoption in China | Long term (≥ 4 years) |
| Single-Use, Low-Capex Bioreactors Democratize Manufacturing | +0.7% | Global, with rapid uptake in Asia-Pacific and emerging markets | Medium term (2-4 years) |
| Source: Mordor Intelligence | |||
Chronic Disease Burden Elevates Demand for Biologics
Rising prevalence of diabetes, cancer, and autoimmune disorders is expanding the addressable patient pool for recombinant therapeutics. The World Health Organization added semaglutide to its Model List of Essential Medicines in 2024, recognizing glucagon-like peptide-1 receptor agonists as a cornerstone of obesity and type 2 diabetes management [1]World Health Organization, “Essential Medicines List Update,” who.int. Novo Nordisk's Wegovy and Eli Lilly's Zepbound collectively generated multi-billion-dollar revenues in 2025, underscoring payer willingness to reimburse high-cost biologics when clinical outcomes justify expenditure. Oncology pipelines are shifting toward interleukin-based immunotherapies and bispecific antibodies that engage T cells, with FDA approvals for teclistamab and talquetamab in multiple myeloma validating the dual-targeting paradigm. This trend extends beyond wealthy markets; India and China are scaling biosimilar insulin and erythropoietin production to serve domestic populations, creating a parallel demand stream that favors cost-efficient expression systems and local fill-finish capacity.
Breakthroughs In High-Yield Expression & Purification Platforms
Mammalian cell lines now routinely achieve titers of 10 grams per liter to 15 grams per liter in perfusion culture, halving bioreactor footprint and accelerating clinical supply timelines. Chinese hamster ovary (CHO) cell engineering incorporating CRISPR-mediated knockout of apoptosis pathways and overexpression of chaperones has become standard practice among top-tier CDMOs, enabling clients to compress process development from 18 months to 12 months. Continuous chromatography systems, which integrate bind-elute and flow-through modes, reduce resin consumption by 30% and cut purification cycle time significantly, translating into lower cost-of-goods for high-volume products. Bacterial platforms are benefiting from codon optimization and periplasmic secretion strategies that improve solubility and reduce endotoxin burden, making Escherichia coli viable for simpler cytokines and growth factors. These advances compress the cost-quality frontier, allowing smaller biotechs to compete on manufacturing efficiency rather than relying solely on intellectual property moats.
Expansion Of Bioclusters & CDMO Capacity Worldwide
Asia-Pacific CDMO capacity additions are reshaping global supply chains. Samsung Biologics' Plant 5 in Incheon added 180 kiloliters of single-use capacity in 2024, bringing the site's total to 784 kiloliters and positioning the company as the world's largest contract biomanufacturer by volume. Lotte Biologics committed USD 3.3 billion to a 360-kiloliter greenfield facility in South Korea, targeting both innovator and biosimilar clients. In China, WuXi Biologics operates multiple sites with aggregate capacity exceeding 400 kiloliters, serving domestic and international pipelines with cost structures 20% to 30% below Western peers. North America and Europe are responding with targeted expansions: Lonza's Vacaville acquisition added 330 kiloliters of mammalian capacity, while Fujifilm's Denmark and North Carolina investments total USD 2.8 billion and focus on high-complexity glycoproteins requiring advanced analytics and regulatory pedigree. This geographic diversification reduces concentration risk but also fragments quality standards, prompting regulators to harmonize good manufacturing practice (GMP) inspections under International Council for Harmonisation (ICH) Q7 and Q11 guidelines [2]International Council for Harmonisation, “ICH Q7/Q11 Guidelines,” ich.org.
Favorable Biologics Reimbursement & Fast-Track Approvals
Regulatory agencies are accelerating biologics pathways to address unmet needs. The Center for Drug Evaluation and Research has approved a total of 63 biosimilars for 17 different reference products since 2015. The European Medicines Agency's PRIME scheme provided early scientific advice to 42 biologics developers in 2025, aligning clinical endpoints with regulatory expectations and reducing late-stage attrition. Payer policies are evolving in parallel; the United States Food and Drug Administration finalized interchangeability standards for biosimilars in 2024, allowing pharmacists to substitute without prescriber intervention. Japan's Ministry of Health, Labour and Welfare expanded reimbursement for regenerative medicine products, including recombinant growth factors used in cell therapy manufacturing, signaling a shift toward value-based pricing that rewards clinical differentiation over cost minimization.
Restraints Impact Analysis*
| Restraints | (~) % Impact on CAGR Forecast | Geographic Relevance | Impact Timeline |
|---|---|---|---|
| Persistent High COGS For Complex Glycoproteins | -1.1% | Global, most acute in high-complexity therapeutic segments | Long term (≥ 4 years) |
| Intensifying Biosimilar-Driven Price Erosion | -0.9% | North America and Europe, spreading to Asia-Pacific | Medium term (2-4 years) |
| Cold-Chain & Fill-Finish Bottlenecks in Emerging Markets | -0.6% | Asia-Pacific, Middle East & Africa, South America | Medium term (2-4 years) |
| Regulatory Ambiguity for Cell-Free Synthesis Platforms | -0.4% | Global, with regulatory focus in North America and Europe | Short term (≤ 2 years) |
| Source: Mordor Intelligence | |||
Persistent High COGS for Complex Glycoproteins
Downstream processing for heavily glycosylated proteins still represents 60%–70% of manufacturing outlay, despite resin and process advances. Affinity resins priced at USD 10,000–15,000 per liter require frequent replacement, and extended culture durations inflate overhead costs. Glyco-engineered yeast strains offer promise, but sparse regulatory precedent adds 12–18 months of comparability work, restraining near-term adoption. High cost structures disadvantage biosimilars once reference prices fall, concentrating production among the few players that maintain scale efficiencies. Without step-change gains in glycan control or purification economy, margin pressure will persist and temper recombinant protein market acceleration.
Intensifying Biosimilar-Driven Price Erosion
Humira biosimilars captured significant market share in the United States by volume by 2025, slashing AbbVie’s revenue by USD 6 billion year-over-year. European experience shows reference-product prices falling due to growing adoption of infliximab and rituximab biosimilars. Medicare Part D discounts averaged 65%, signaling payers resolve to widen competition and extend savings. Originators respond with formulation tweaks, subcutaneous options, or strategic exits, yet the repricing cycle extends across tumor necrosis factor inhibitors and anti-VEGF lines. Sustained price erosion dampens revenue growth and forces companies to squeeze costs or chase novel modalities, slightly constraining recombinant protein market performance.
*Our forecasts treat driver/restraint impacts as directional, not additive. The impact forecasts reflect baseline growth, mix effects, and variable interactions.
Segment Analysis
By Product: Cytokines Anchor Revenue, Fusion Proteins Propel Growth
Cytokines and growth factors accounted for 25.2% of the recombinant protein market share in 2025, sustained by widespread use of interleukins, colony-stimulating factors, and interferons across oncology and immunology. Interleukin-15 programs in particular are expanding T-cell therapies, while next-generation interleukin-2 variants deliver stronger tumor infiltration with lower toxicity. Fusion proteins, though only emerging, are projected to grow at an 8.82% CAGR through 2031, benefiting from half-life extension and dual-targeting mechanisms exemplified by Amgen’s Uplizna [3]Amgen, “Uplizna Product Information,” amgen.com. Demand for hormones such as insulin, erythropoietin, and human growth hormone remains steady, yet biosimilar launches like Semglee and Rezvoglar exert downward price pressure. Monoclonal antibodies and fragments continue to dominate autoimmune and oncology care, while industrial enzymes provide reliable cash flow as sustainability mandates drive the switch from petrochemical catalysts. AI-designed scaffolds and synthetic biology outputs populate early pipelines, suggesting longer-term upside once regulatory clarity and manufacturing readiness mature.


By Expression System: Mammalian Dominance, Cell-Free Momentum
Mammalian hosts held 46.1% of the market share in 2025, reflecting an unrivaled ability to deliver human-like glycosylation essential for immunoglobulins and Fc-fusion constructs. Recombinant protein market size tied to mammalian systems continues to expand as perfusion and fed-batch processes yield titers above 10 g/L, lowering per-gram costs. Cell-free platforms, however, grow fastest at an 8.54% CAGR, offering 48-hour production cycles and site-specific conjugation versatility showcased by Sutro Biopharma’s XpressCF.
Bacterial expression remains a workhorse for non-glycosylated molecules, aided by codon optimization that halves refolding expense. Yeast systems deliver a balance of eukaryotic folding and bacterial scalability, with Pichia pastoris enabling dense fermentations suited for industrial enzymes. Insect cells occupy niche vaccine and viral-like-particle uses, but limited scale constrains their broader stake in the recombinant protein market.
By Application: Therapeutics Lead, Research Use Accelerates
Therapeutic products captured 33.5% of revenue in 2025 as GLP-1 agonists and bispecific antibodies demonstrated strong payer acceptance and clinical gains. The recombinant protein market size for therapeutics is projected to grow with a significant CAGR as additional orphan-disease biologics reach the market. Research applications expand in parallel, propelled by proteomics, CRISPR screens, and synthetic-biology workflows that depend on high-purity reagents.
Academic laboratories are upgrading core facilities with automated purification suites funded by a USD 500 million NIH allocation, improving internal throughput while increasing demand for standardized reference proteins. Industrial uses involving food processing and detergents rely on recombinant enzymes for energy savings and greener profiles; Novozymes’ cold-wash proteases illustrate the commercial potential in sustainability-oriented niches.
By End User: Pharma Dominance, CDMOs Capture Outsourcing Wave
Pharmaceutical and biotech companies commanded 39.7% of spending in 2025, preserving process know-how for blockbuster assets with patent life beyond 2030. Still, CROs and CDMOs register the highest 8.63% CAGR as virtual biotechs outsource development to conserve capital. Lonza’s backlog topped USD 15 billion in 2025 across 150 programs, while Samsung Biologics signed 30 new multi-product agreements in 2024.
Academic and government institutes grow at a more measured pace, tied to grant cycles and internal budget approvals. These institutions demand ISO-certified suppliers and traceable quality, positioning specialized reagent firms such as Sino Biological and Bio-Techne to gain share. As outsourcing proliferates, recombinant protein market dynamics shift toward flexible capacity and compliance credentials.
Geography Analysis
North America held 42.1% of global revenue in 2025, buoyed by concentrated venture funding, FDA regulatory leadership, and entrenched bioclusters in Boston and the San Francisco Bay Area. The FDA issued 68 breakthrough therapy designations across 2024-2025, shaving up to a year off commercialization timelines. Canada’s CAD 950 million Pan-Canadian Biologics and Biosimilars Initiative is set to boost domestic output, reducing import reliance and enlarging the regional recombinant protein market size.
Europe leverages established capacity in Ireland, Switzerland, and Denmark. Lonza’s Visp and Portsmouth sites contribute 200 kL of mammalian volume, while Fujifilm’s new 120 kL Danish plant targets complex glycoproteins. EMA’s PRIME program continues to streamline development, and biosimilar penetration across infliximab and rituximab surpasses 80%, reinforcing Europe’s reputation for value-based procurement.
Asia-Pacific is on an 8.81% CAGR trajectory as China and India escalate CDMO footprints. WuXi Biologics exceeds 400 kL capacity with cost structures undercutting Western peers by up to 30%. Samsung Biologics’ 784 kL site in Incheon further cements regional prominence. Domestic demand for biosimilar insulin and erythropoietin in India also adds volume, broadening recombinant protein market penetration across emerging economies.
Middle East & Africa and South America remain nascent but strategic. Saudi Vision 2030 earmarks USD 2 billion for biomanufacturing to lower import dependency. Brazil recorded significant biosimilar market growth in 2025, although regulatory harmonization lags U.S. and EU benchmarks. South Africa’s Biovac Institute expanded fill-finish output, offering a springboard for regional recombinant protein contracts once WHO prequalification is secured.

Competitive Landscape
Global revenue concentration sits majorly among the top 10 suppliers, indicating a moderately fragmented structure that still allows specialized entrants to gain share. Large innovators such as Amgen, Roche, and Novo Nordisk retain in-house capacity to protect intellectual property and margins. CDMOs including Lonza, Samsung Biologics, and WuXi Biologics scale aggressively, exploiting single-use technology and Asian cost advantages to court virtual biotechs and mid-caps.
Competitive differentiation increasingly revolves around AI-driven discovery, continuous manufacturing, and cell-free synthesis. Generate Biomedicines’ USD 273 million Series B in 2024 highlights investor confidence in generative models that compress discovery cycles.
Biosimilar entrants erode margins in mature categories; Amgen’s Amjevita and Boehringer Ingelheim’s Cyltezo together controlled half of Humira’s U.S. volume by 2025, propelling AbbVie to diversify toward new immunology assets.
Recombinant Protein Industry Leaders
Eli Lilly and Company
Thermo Fisher Scientific Inc.
Novartis AG
GlaxoSmithKline PLC
Pfizer Inc.
- *Disclaimer: Major Players sorted in no particular order

Recent Industry Developments
- January 2026: Amgen acquired Dark Blue Therapeutics for up to $840 million, adding a preclinical targeted protein degradation therapy for acute leukemias to its pipeline.
- December 2025: Samsung Biologics acquired GSK's Human Genome Sciences unit in Rockville, Maryland, for USD 280 million, securing its first United States. manufacturing site and expanding its global footprint.
- March 2025: Thermo Fisher Scientific launched a new recombinant cytokine panel for multiplex immunoassays, focusing on immuno-oncology research.


Research Methodology Framework and Report Scope
Market Definitions and Key Coverage
Our study defines the recombinant protein market as revenue earned from purified proteins produced through recombinant-DNA expression in mammalian, bacterial, yeast, insect, or cell-free systems and supplied for therapeutic use, pre-clinical or clinical research, and select bioprocess reagents. We count finished molecules such as insulin, cytokines, monoclonal fragments, enzymes, and fusion constructs at the ex-factory selling price.
Scope Exclusions: Diagnostic antibodies, bulk food enzymes, and contract manufacturing service fees are outside the scope.
Segmentation Overview
- By Product
- Hormones (Insulin, EPO, hGH, FSH)
- Cytokines & Growth Factors (ILs, CSFs, IFNs)
- Monoclonal Antibodies & Fragments
- Enzymes
- Fusion Proteins & Others
- By Expression System
- Mammalian (CHO, HEK293)
- Bacterial (E. coli)
- Yeast (Pichia, Saccharomyces)
- Insect (Sf9, Sf21)
- Cell-Free / Synthetic
- By Application
- Therapeutic
- Research
- Industrial (Agro-biotech, Food, Detergents)
- By End User
- Pharmaceutical & Biotechnology Companies
- Academic & Research Institutes
- CROs & CDMOs
- By Geography
- North America
- United States
- Canada
- Mexico
- Europe
- Germany
- United Kingdom
- France
- Italy
- Spain
- Rest of Europe
- Asia-Pacific
- China
- Japan
- India
- South Korea
- Australia
- Rest of APAC
- Middle East & Africa
- GCC
- South Africa
- Rest of Middle East & Africa
- South America
- Brazil
- Argentina
- Rest of South America
- North America
Detailed Research Methodology and Data Validation
Primary Research
Mordor analysts interviewed bioprocess engineers at contract development organizations, academic group leaders, and hospital formulary managers across North America, Europe, and Asia. Their insight on batch yields, price corridors, and near-term capacity plans let us recalibrate desk findings and validate hidden assumptions.
Desk Research
We began by mapping demand with open datasets from the US FDA biologic approvals, EMA Community Register filings, NIH RePORTER grant counts, and OECD health-R&D trends. Trade codes in UN Comtrade and national customs portals helped size cross-border flows of insulin, interferons, and growth factors. PubMed articles and Questel patent families revealed pipeline depth, while 10-Ks, investor decks, and pricing drawn from D&B Hoovers and Dow Jones Factiva showed average selling prices and shipment ranges. These sources illustrate, not exhaust, the backbone we used.
A second sweep checked regional health budgets, clinical-trial registries, and association white papers to align prevalence data with reagent consumption. Together, these strands formed a coherent historic baseline before any forecasts were run.
Market-Sizing & Forecasting
We rebuild the market with a top-down demand pool that links treated patient cohorts, reagent-consumption norms, and industrial usage, which is then filtered through price bands by protein class. Select bottom-up supplier roll-ups and channel checks confirm totals. Key variables include new therapeutic approvals, oncology and diabetes prevalence, mammalian bioreactor capacity, proteomics grant spend, and post-patent price erosion. A multivariate regression engine projects every driver, and scenario analysis layers in regulatory or manufacturing shocks.
Data Validation & Update Cycle
Outputs pass multi-step peer review. Analysts compare modeled totals with shipment disclosures, customs anomalies, and spot price trackers, re-contacting sources when variances exceed thresholds. We refresh figures each year and issue interim flashes when material events occur.
Why Mordor's Recombinant Protein Baseline Deserves Decision-Maker Confidence
Estimates often diverge because firms choose different product baskets, currencies, or refresh cadences.
According to Mordor Intelligence, the 2025 global market equals USD 2.9 billion, offering a grounded midpoint for planning.
Benchmark comparison
| Market Size | Anonymized source | Primary gap driver |
|---|---|---|
| USD 2.9 B (2025) | Mordor Intelligence | - |
| USD 3.01 B (2024) | Global Consultancy A | Narrower product list, desk-only validation |
| USD 2.2 B (2023) | Industry Association B | Excludes research reagents, older currency base |
| USD 3.52 B (2024) | Regional Consultancy C | Adds diagnostic antibodies, optimistic pricing |
Differences stem mainly from scope drift and limited field checks. By combining clearly defined coverage with on-ground validation, we supply a balanced, transparent baseline that clients can reproduce and trust.


Key Questions Answered in the Report
How big is the Recombinant Protein Market?
The recombinant protein market size is expected to reach USD 3.13 billion in 2026 and is projected to reach USD 4.59 billion by 2031.
Which product category currently leads global revenue?
Cytokines and growth factors lead with a 25.2% share, supported by wide oncology and immunology use.
Which expression system is expanding fastest?
Cell-free and synthetic platforms are advancing at an 8.54% CAGR thanks to rapid 48-hour production cycles.
Which region shows the highest growth rate through 2031?
Asia-Pacific posts the fastest regional CAGR at 8.81% as China and India have ramped up CDMO capacity and biosimilar demand.
Why are CDMOs gaining share among end users?
Mid-tier biotechs prefer outsourcing to CDMOs, driving an 8.63% CAGR for the segment as they conserve capital and shorten timelines.
Page last updated on:


