Protein Expression Market Size and Share
Market Overview
| Study Period | 2020 - 2031 |
|---|---|
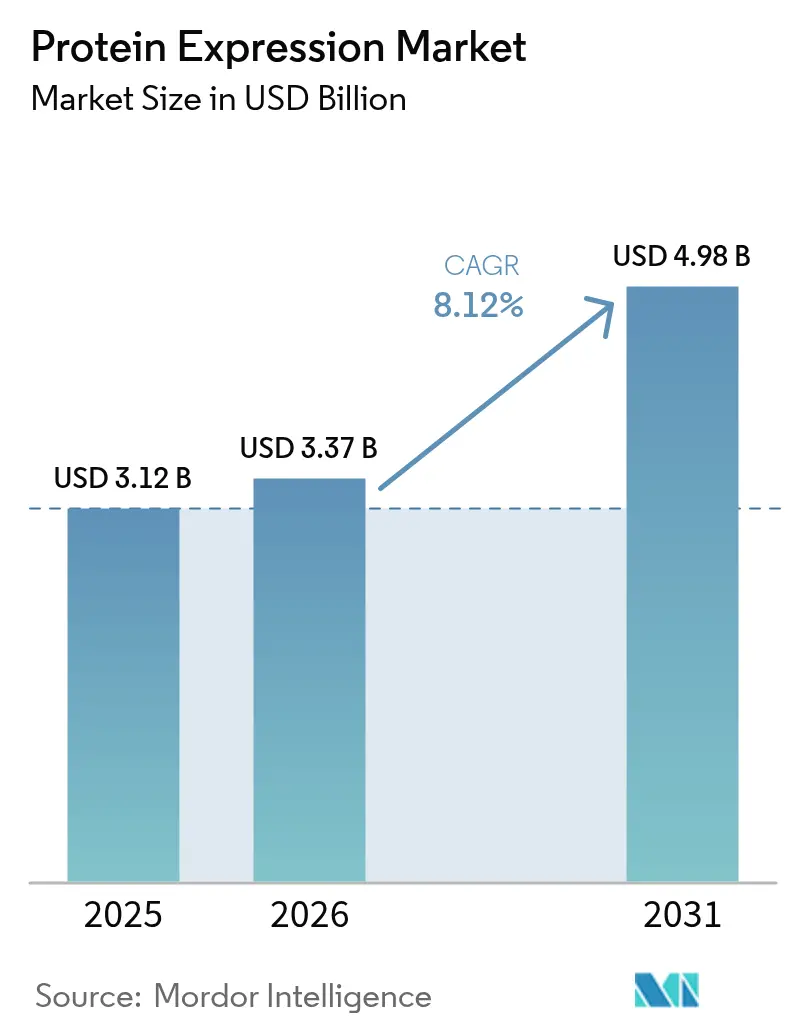
| Market Size (2026) | USD 3.37 Billion |
| Market Size (2031) | USD 4.98 Billion |
| Growth Rate (2026 - 2031) | 8.12% CAGR |
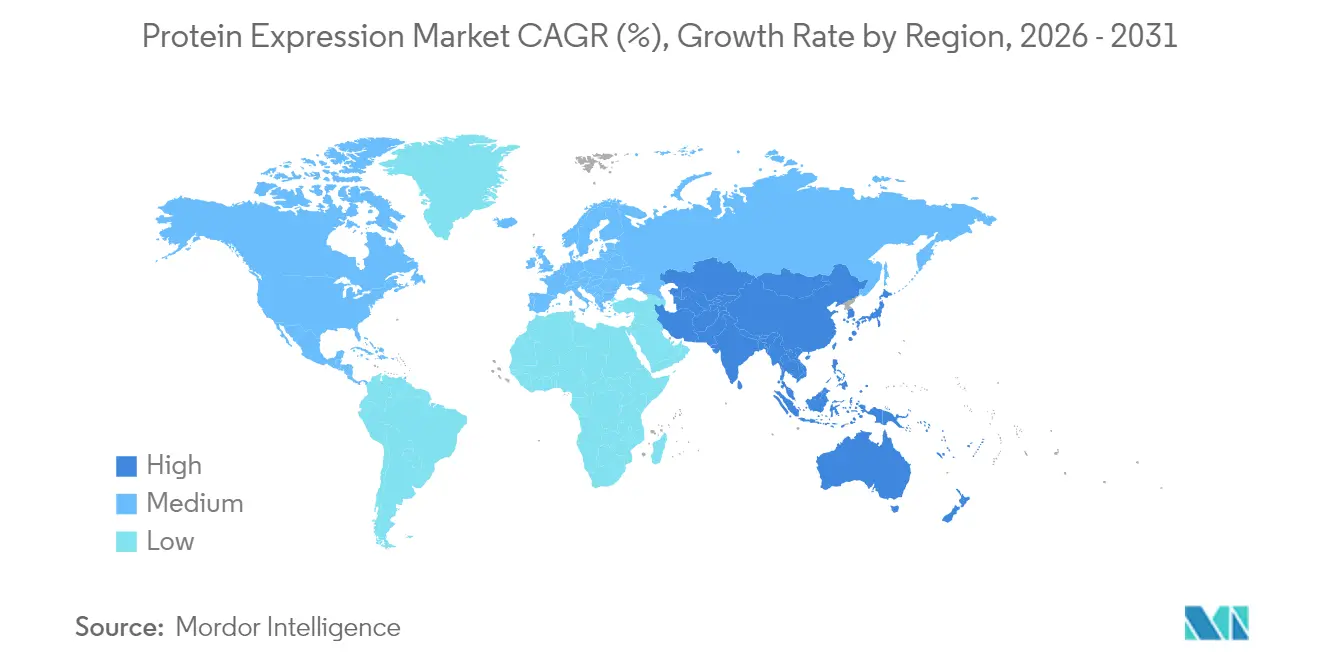
| Fastest Growing Market | Asia Pacific |
| Largest Market | North America |
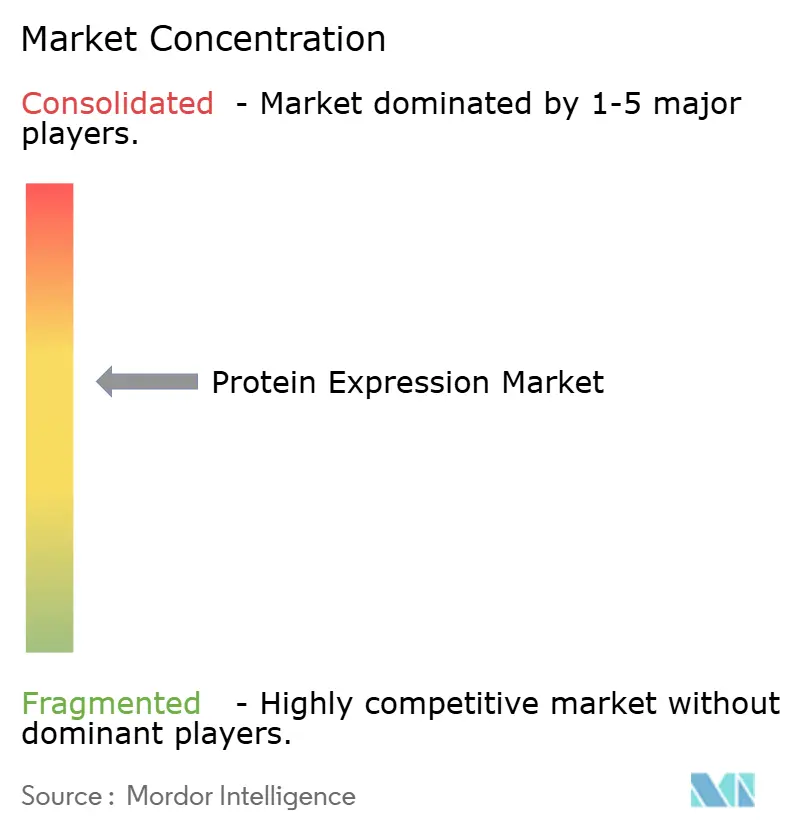
| Market Concentration | Medium |
Major Players *Disclaimer: Major Players sorted in no particular order Image © Mordor Intelligence. Reuse requires attribution under CC BY 4.0. | |
Protein Expression Market Analysis by Mordor Intelligence
The protein expression market size is expected to grow from USD 3.12 billion in 2025 to USD 3.37 billion in 2026 and is forecast to reach USD 4.98 billion by 2031 at 8.12% CAGR over 2026-2031. Growth traces back to the rapid shift from conventional recombinant methods toward AI-enabled platforms that fine-tune codon usage, lift yields, and shorten development cycles. Strong R&D budgets by large-cap pharmaceutical firms, such as Thermo Fisher Scientific’s USD 2 billion U.S. manufacturing program, are adding modern capacity while de-risking supply chains. Government-funded multi-omics agendas, together with the commercial rollout of continuous-flow micro-bioreactors, dismantle historic scale and cost barriers. Meanwhile, a pipeline of 698 biologics projects at WuXi Biologics illustrates how clinical complexity translates into unrelenting demand for advanced expression technologies.
Key Report Takeaways
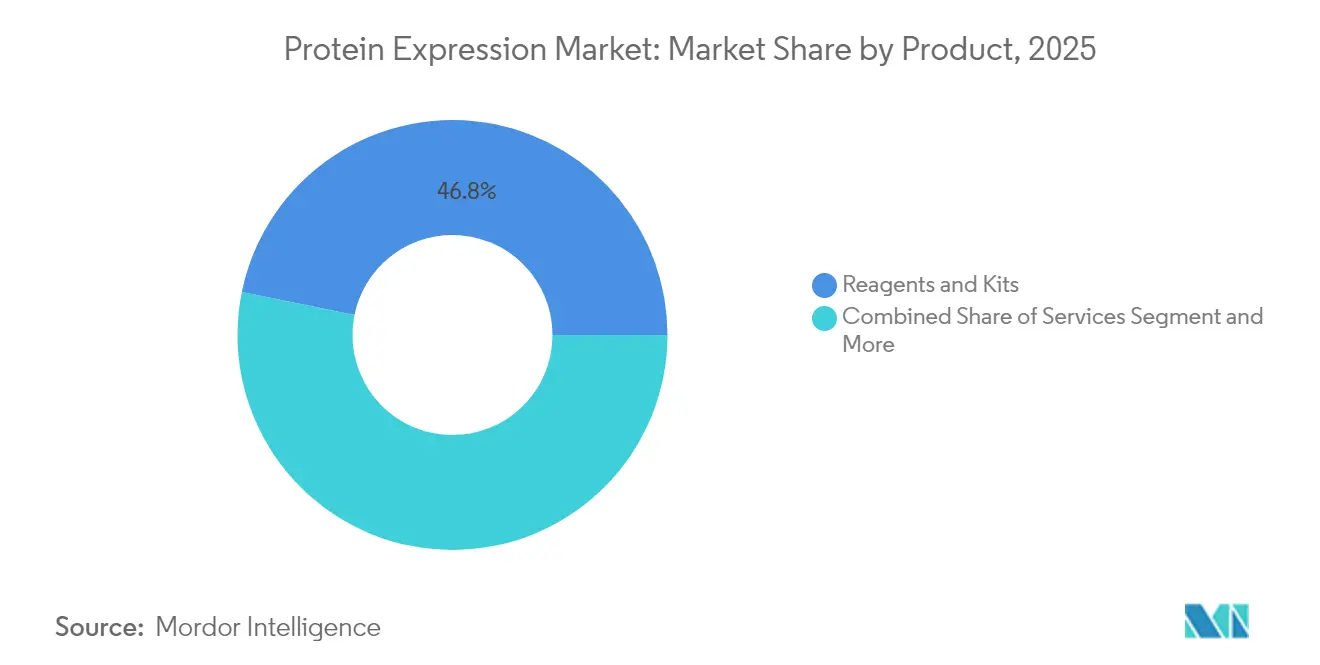
- By product and services category, Reagents & Kits led with 46.80% revenue share of the protein expression market in 2025; Services are projected to expand at a 12.07% CAGR through 2031.
- By application, therapeutic uses held 58.10% of the protein expression market share in 2025, whereas agricultural biotechnology is forecast to grow at a 12.64% CAGR to 2031.
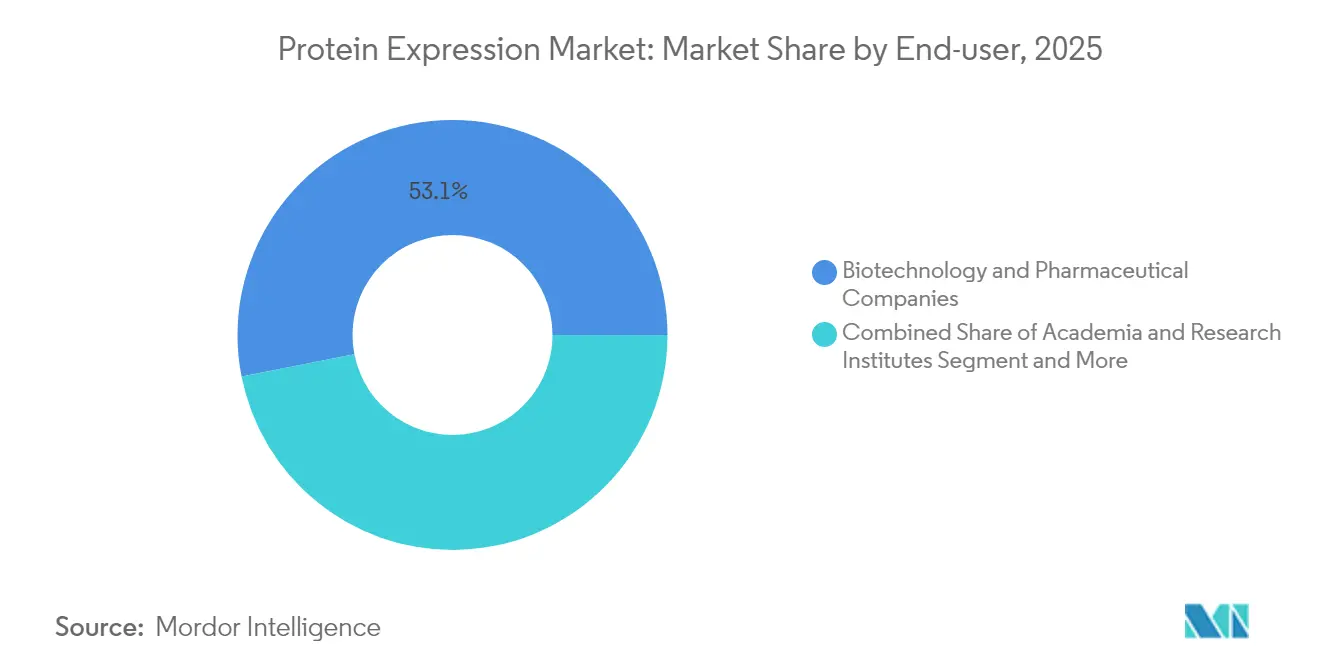
- By end-user, biotechnology & pharmaceutical companies accounted for 53.10% of demand in 2025, while CROs/CDMOs register the highest projected CAGR at 12.31% through 2031.
- By geography, North America commanded 39.55% of the protein expression market size in 2025 and Asia-Pacific is advancing at an 11.45% CAGR to 2031.
Note: Market size and forecast figures in this report are generated using Mordor Intelligence’s proprietary estimation framework, updated with the latest available data and insights as of 2026.
Global Protein Expression Market Trends and Insights
Drivers Impact Analysis*
| Driver | (~) % Impact on CAGR Forecast | Geographic Relevance | Impact Timeline |
|---|---|---|---|
| Rising R&D investments by large-cap pharma | +2.1% | Global, strongest in North America & EU | Medium term (2-4 years) |
| Expansion of therapeutic biologics pipeline | +1.8% | Global, with momentum shifting toward Asia-Pacific | Long term (≥ 4 years) |
| Government-funded multi-omics initiatives | +1.3% | North America and EU, early gains in China and Japan | Medium term (2-4 years) |
| AI-optimised codon usage accelerating yield | +1.7% | Early adoption in the United States, Germany, Singapore | Short term (≤ 2 years) |
| Continuous-flow micro-bioreactors adoption | +0.9% | Core uptake in Asia-Pacific, spill-over to North America | Medium term (2-4 years) |
| Source: Mordor Intelligence | |||


Rising R&D Investments by Large-Cap Pharma
Industry majors are investing heavily in expression infrastructure; Thermo Fisher Scientific alone allocated USD 2 billion for U.S. expansion that targets both capacity and next-generation process innovation. Such capital flows align with the fact that biologics now account for nearly 70% of biopharmaceutical sales, making dependable protein output a strategic imperative. M&A activity, illustrated by Roche’s USD 1 billion agreement to acquire Poseida Therapeutics, concentrates valuable expression know-how within top tier firms. Start-ups also benefit; ExpressionEdits raised USD 13 million to engineer higher-fidelity proteins, signalling broad confidence in the space. As this funding surge translates into new pilot and commercial facilities, the protein expression market experiences stronger order books and faster technology refresh cycles.
Expansion of Therapeutic Biologics Pipeline
WuXi Biologics’ 698 active programs, including 51 late-phase projects, highlight the unprecedented scale of clinical development that hinges on sophisticated expression systems. Growing FDA approvals of monoclonal antibodies and the advent of gene-edited cell therapies, such as CASGEVY under Lonza’s supply agreement, intensify demand for platforms that can handle complex post-translational requirements. Antibody-drug conjugates and bispecific formats require high-yield mammalian systems, while microbial platforms are being re-engineered to deliver plasmid DNA at commercial scale. This broad modality mix stretches existing capacity and drives multiyear outsourcing contracts, fuelling consistent revenue streams across equipment, reagents, and services. Geographic diversification of clinical trials reinforces the need for local manufacturing footprints in Asia-Pacific and Europe, further widening the protein expression market.
Government-Funded Multi-Omics Initiatives
Major public agencies treat protein expression as critical research infrastructure. The NIH Multi-Omics for Health and Disease Consortium merges proteomics with genomics to decode disease progression in diverse populations. Complementing this, the National Science Foundation launched a USD 40 million program that accelerates AI-enhanced protein design to bolster the bioeconomy[1]National Science Foundation, “New $40M Funding Opportunity Accelerates the Translation of Novel Approaches to Protein Design to Bolster the U.S. Bioeconomy,” nsf.gov. ARPA-H’s APECx project establishes toolkits for broadly protective vaccine antigens, further tightening the link between public health preparedness and expression technology. The UK Biobank Proteomics Project, powered by Thermo Fisher’s Olink platform, is cataloguing more than 5,400 proteins across 600,000 samples, creating the world’s largest human proteome reference. These publicly funded datasets raise analytical standards and stimulate commercial opportunities in biomarker validation and therapeutic discovery.
AI-Optimised Codon Usage Accelerating Yield
CodonTransformer, trained on genomic data from 164 species, generates DNA sequences that enhance expression while avoiding deleterious motifs, resulting in multi-fold yield gains. Complementary frameworks like the Codon Health Index rank codons based on host fitness, cutting resource competition and further elevating production efficiency. Experimental results confirm that optimized coding sequences can lift green fluorescent protein titres more than fivefold in Bacillus subtilis models, demonstrating the practical upside of AI decision-making. These algorithmic improvements shorten build-test-learn cycles from months to weeks, providing faster path-to-clinic for novel biologics and reinforcing the competitiveness of the protein expression market.
Restraints Impact Analysis*
| Restraint | (~) % Impact on CAGR Forecast | Geographic Relevance | Impact Timeline |
|---|---|---|---|
| Capital-intensive high-throughput systems | -1.2% | Global, largest drag in emerging markets | Long term (≥ 4 years) |
| Limited post-translational modification fidelity | -0.8% | Global, acute in complex biologics | Medium term (2-4 years) |
| IP clustering around AI-generated protein libraries | -0.6% | Primarily North America & EU | Short term (≤ 2 years) |
| Source: Mordor Intelligence | |||
Capital-Intensive High-Throughput Systems
Scaling from 10 to 288 recombinant proteins per week necessitates liquid-handling robots, parallel bioreactors, and integrated purification skids that carry heavy upfront costs. Platforms such as the Protein Expression and Purification Platform rely on fully automated HEK and CHO lines, requiring specialised facilities, ongoing maintenance, and skilled operators. Downstream processing outlays can consume up to 60% of total development budgets, stretching the finances of smaller firms and slowing adoption in lower-income regions. While low-cost DIY reactors offer limited relief, they sacrifice throughput and compliance readiness. This financial barrier narrows supplier diversity and tempers the near-term growth of the protein expression market in capital-constrained geographies.
Limited Post-Translational Modification Fidelity
Mistranslation rates as high as 8 × 10⁻³ compromise protein function and may trigger immunogenic responses in therapeutic products. Glycosylation inconsistency impedes biosimilar development, forcing repeated analytical cycles and delaying regulatory filings. Mammalian hosts remain the gold standard for complex proteins, but even they require media optimisation and chaperone engineering to reach desired fidelity levels. Advances in targeted codon optimisation and strain engineering show promise yet demand sustained R&D budgets to become mainstream. These quality uncertainties lengthen time-to-market and push some sponsors toward specialised CDMOs, constraining the protein expression market’s full potential.
*Our forecasts treat driver/restraint impacts as directional, not additive. The impact forecasts reflect baseline growth, mix effects, and variable interactions.
Segment Analysis
By Product & Services: Services Accelerate Despite Reagents Dominance
Reagents & Kits captured 46.80% protein expression market share in 2025, underlining their status as indispensable inputs across every workflow, from vector construction to final purification. Service providers are gaining momentum; the segment is forecast to post a 12.07% CAGR through 2031 as developers outsource complex or high-volume programs to partners with proprietary cell lines and GMP suites. KBI Biopharma secured USD 250 million worth of long-term mammalian production contracts that illustrate sustained demand for external expertise.
Innovation within reagents remains brisk: Bioneer’s ExiProgen system and newer cell-free formulations cut expression timelines while preserving yields. Meanwhile, multi-modality CDMO deals, reported by BioProcess International, broaden service menus to include cell-free and microbial options, signalling that service revenues will outpace reagent growth as biologic complexity rises. Collectively, these forces deepen the protein expression market, creating parallel revenue streams from consumables and turnkey outsourcing.


By Application: Agricultural Biotechnology Disrupts Therapeutic Leadership
Therapeutic use cases dominate value, accounting for 58.10% of the protein expression market size in 2025 thanks to sustained antibody, vaccine, and gene therapy pipelines. Yet agricultural biotechnology posts the fastest growth at 12.64% CAGR, driven by CRISPR-edited crops, enzyme-linked pest resistance, and precision fermentation proteins that redefine food security. Fusarium-resistant wheat lines co-expressing chitinase and β-1,3-glucanase underscore the efficacy of plant-based expression systems in crop protection.
Industrial enzymes and research tools maintain mid-single-digit growth, buoyed by AI-guided enzyme evolution for food processing and green chemistry. Plant bioreactors that assemble animal proteins—reviewed in Frontiers in Plant Science—expand addressable markets while circumventing many cold-chain requirements. These diverse applications broaden the protein expression market, mitigating reliance on any single therapeutic modality and underscoring the technology’s cross-sector utility.
By End-user: CROs/CDMOs Capitalize on Outsourcing Momentum
Biotechnology & pharmaceutical companies controlled 53.10% of spending in 2025, reflecting their need for direct oversight of critical path programs. Those firms also underwrite major greenfield builds such as Thermo Fisher Scientific’s U.S. expansion that fortifies internal supply assurance.
CROs/CDMOs, however, will outpace all other end-users with a 12.31% CAGR to 2031, benefitting from risk-sharing models and regulatory familiarity. WuXi Biologics illustrates this ascent; late-phase and commercial revenue grew 101.7%, validating the premium developers place on proven large-scale capabilities.
Academic and research institutes contribute steady baseline demand through NIH and NSF grants that fund exploratory proteomics and AI-driven design studies. New collaborations, such as Nuclera and Cytiva’s integration of discovery and characterization platforms, blur historical boundaries between academic and industrial users. Together, these dynamics encourage flexible capacity sharing that widens entry points into the protein expression market.
Geography Analysis
North America held 39.55% protein expression market share in 2025 on the strength of deep pharmaceutical pipelines, venture capital networks, and an enabling policy environment. The NSF’s USD 40 million protein design program and ARPA-H’s vaccine-centric initiatives provide long-term demand visibility. Company-level moves—including Thermo Fisher’s USD 3.1 billion acquisition of Olink—bolster analytical throughput and are positioning the region as a global proteomics hub. Canada and Mexico contribute scale-up and fill-finish services that complement U.S. capacity, while streamlined regulatory pathways encourage cross-border trials.
Asia-Pacific is forecast to deliver the highest regional CAGR at 11.45% through 2031, propelled by harmonised regulations, cost-competitive capacity, and government incentives for biologics self-sufficiency. China leads investments, evidenced by WuXi Biologics’ 37.7% non-COVID revenue growth and new microbial platforms designed for recombinant protein and plasmid DNA. Japan and South Korea supply cutting-edge automation, while India and Australia offer cost-effective, GMP-ready infrastructures. Regional governments back precision fermentation firms to address food security, expanding end-markets beyond therapeutics.
Europe shows steady mid-single-digit growth anchored by established manufacturing hubs and a rigorous yet predictable regulatory framework. Lonza’s Netherlands facility, key to the CASGEVY gene-edited cell therapy, confirms Europe’s ability to handle novel modalities at commercial scale. Germany, the United Kingdom, and France remain R&D powerhouses, and Eastern European nations add capacity with competitive labor costs. Ongoing emphasis on sustainability feeds demand for plant-based and precision-fermented proteins, aligning policy goals with commercial adoption.
Competitive Landscape
Competition is moderately concentrated: global leaders Thermo Fisher Scientific, Merck KGaA, and Agilent Technologies integrate acquisitions and proprietary platforms to deliver end-to-end solutions. Thermo Fisher’s Olink acquisition knit proximity extension assays into a portfolio that now spans discovery to quality control, widening switching costs for customers. Lonza’s GS Xceed gene expression system and microbial XS Technologies create modular toolkits that accelerate cell line development and support multi-scale manufacturing.
Mid-sized CDMOs are raising differentiation through platform breadth. KBI Biopharma offers integrated analytics alongside GMP production, attracting long-tenure contracts that lock in revenue visibility. Agilent, meanwhile, couples chromatography instrumentation with recombinant cell-line services, giving it leverage across capital equipment and consumables.
Emerging disruptors focus on cost compression and automation. AI-first players employ self-driving labs to explore protein fitness landscapes with minimal human input. Insect-cell mini-bioreactors promise double-digit cost savings and reduced greenhouse emissions relative to conventional mammalian systems. As IP clusters form around AI-generated libraries, licensing strategies become important weapons in securing recurring revenues.
Protein Expression Industry Leaders
Agilent Technologies Inc
Thermo Fisher Scientific Inc
Merck KGaA
Takara Bio Inc
New England Biolabs
- *Disclaimer: Major Players sorted in no particular order

Recent Industry Developments
- June 2025: Sanofi completed acquisition of Blueprint Medicines for USD 9.1 billion, adding Ayvakit revenue streams and deepening rare immunology expertise.
- April 2025: Thermo Fisher Scientific committed USD 2 billion to boost U.S. innovation and manufacturing, allocating USD 500 million directly to next-generation protein expression R&D.


Research Methodology Framework and Report Scope
Market Definitions and Key Coverage
Our study defines the protein expression market as the revenue generated from kits, reagents, vectors, expression systems (mammalian, bacterial, yeast, insect, cell-free), and associated services used to synthesize, purify, and analyze recombinant or native proteins for therapeutic, research, and industrial purposes. We cover global demand across drug developers, contract manufacturers, academic labs, and industrial enzyme makers, with values expressed at ex-factory prices before distributor margins.
Scope exclusion: diagnostic proteomics service revenues and equipment such as mass spectrometers lie outside this sizing.
Segmentation Overview
- By Product & Services
- Reagents & Kits
- Cell-free Expression
- Bacterial Expression
- Yeast Expression
- Algal Expression
- Insect Expression
- Mammalian Expression
- Plant-based Expression
- Services
- Other Products
- Reagents & Kits
- By Application
- Therapeutic
- Industrial Enzymes
- Research & Discovery
- Agricultural Biotechnology
- By End-user
- Academia & Research Institutes
- Biotechnology & Pharmaceutical Companies
- CROs / CDMOs
- Geography
- North America
- United States
- Canada
- Mexico
- Europe
- Germany
- United Kingdom
- France
- Italy
- Spain
- Rest of Europe
- Asia-Pacific
- China
- Japan
- India
- South Korea
- Australia
- Rest of Asia-Pacific
- Middle East and Africa
- GCC
- South Africa
- Rest of Middle East and Africa
- South America
- Brazil
- Argentina
- Rest of South America
- North America
Detailed Research Methodology and Data Validation
Primary Research
Mordor analysts interviewed bioprocess engineers, CDMO commercial heads, academic PIs, and procurement managers across North America, Europe, Asia-Pacific, and Latin America. These discussions validated reagent usage norms, average selling prices, capacity-utilization swings, and adoption timelines for cell-free platforms, helping us adjust desk-derived assumptions and close regional data gaps.
Desk Research
We began with public datasets from agencies such as OECD R&D Statistics, US FDA Biologics License Application logs, Eurostat trade codes for HS 3504/3822, and scientific literature indexed on PubMed. Annual reports and 10-Ks of leading bio-suppliers were mined for segment revenue clues; then news archives in Dow Jones Factiva and company intelligence from D&B Hoovers filled pipeline and capacity trends. Industry associations, such as BioProcess International, the American Chemical Society, and the UK BioIndustry Association, provided benchmark volumes for cell culture media, upstream titer averages, and outsourcing ratios. The sources listed are illustrative; many additional references informed checkpoints throughout our desk work.
Market-Sizing & Forecasting
A top-down demand pool was first built from biologics R&D spend and commercial batch counts, which are then split by typical reagent load and average kit pricing. Supplier roll-ups and spot ASP × volume checks supplied a selective bottom-up view to fine-tune totals. Key variables tracked include: 1) number of monoclonal antibody IND filings, 2) average upstream titers per liter, 3) prevalence of outsourced protein production, and 4) median price movements for transfection reagents and affinity columns. Forecasts to 2030 employ multivariate regression, linking reagent demand to biologics pipeline growth, CRO penetration, and R&D intensity, before scenario testing for regulatory or supply-chain shocks. Gaps in country-level bottom-ups were bridged by nearest-neighbor ratios on R&D spend per biologic candidate.
Data Validation & Update Cycle
Outputs pass three layers: automated variance checks versus trade and customs data, peer review by a senior analyst, and final sign-off after reconciling any anomalies. We refresh models each year and trigger interim updates when material events, such as facility expansions, major M&A, or price shocks, occur, ensuring clients receive the latest view.
Why Mordor's Protein Expression Baseline Warrants Trust
Published estimates often differ; definitions, price anchors, or update cadences rarely match exactly, and that creates confusion for decision-makers.
Key gap drivers we observed include wider product baskets that fold in diagnostic proteomics, currency mix choices, single-source ASP assumptions, and less frequent model refreshes. Mordor's scope stays squarely on expression inputs and services; our ASPs use multi-region weighted averages, and we rerun models annually, which together underpin a balanced baseline.
Benchmark comparison
| Market Size | Anonymized source | Primary gap driver |
|---|---|---|
| USD 3.12 B (2025) | Mordor Intelligence | - |
| USD 5.17 B (2025) | Global Consultancy A | Includes diagnostic proteomics and bundles plasmid services |
| USD 3.41 B (2024) | Industry Publisher B | Uses list prices, excludes emerging cell-free systems |
| USD 3.78 B (2024) | Trade Journal C | Updates every three years; limited primary interviews |
The comparison shows how broader scopes or older price decks lift or depress totals. By anchoring to clearly stated inclusions, multi-source pricing, and yearly validations, Mordor Intelligence delivers a dependable, decision-ready starting point for strategy teams.


Key Questions Answered in the Report
What is the current value of the protein expression market?
The protein expression market size stood at USD 3.37 billion in 2026.
Which region leads the protein expression market?
North America leads with 39.55% share, backed by strong R&D funding and established manufacturing capacity.
Which segment is expanding the fastest?
Services are growing quickest at a 12.07% CAGR as outsourcing demand accelerates.
Why are AI-optimised codon tools important?
They raise expression yields several-fold and compress development timelines, improving project economics.
How significant is agricultural biotechnology for future growth?
It is the fastest-growing application at a 12.64% CAGR, widening the market beyond traditional therapeutics.
What are the main barriers to wider adoption?
Capital-intensive high-throughput systems and challenges with post-translational modification fidelity continue to limit accessibility, especially in emerging markets.
Page last updated on:


