Protein Labeling Market Size and Share
Market Overview
| Study Period | 2020 - 2031 |
|---|---|
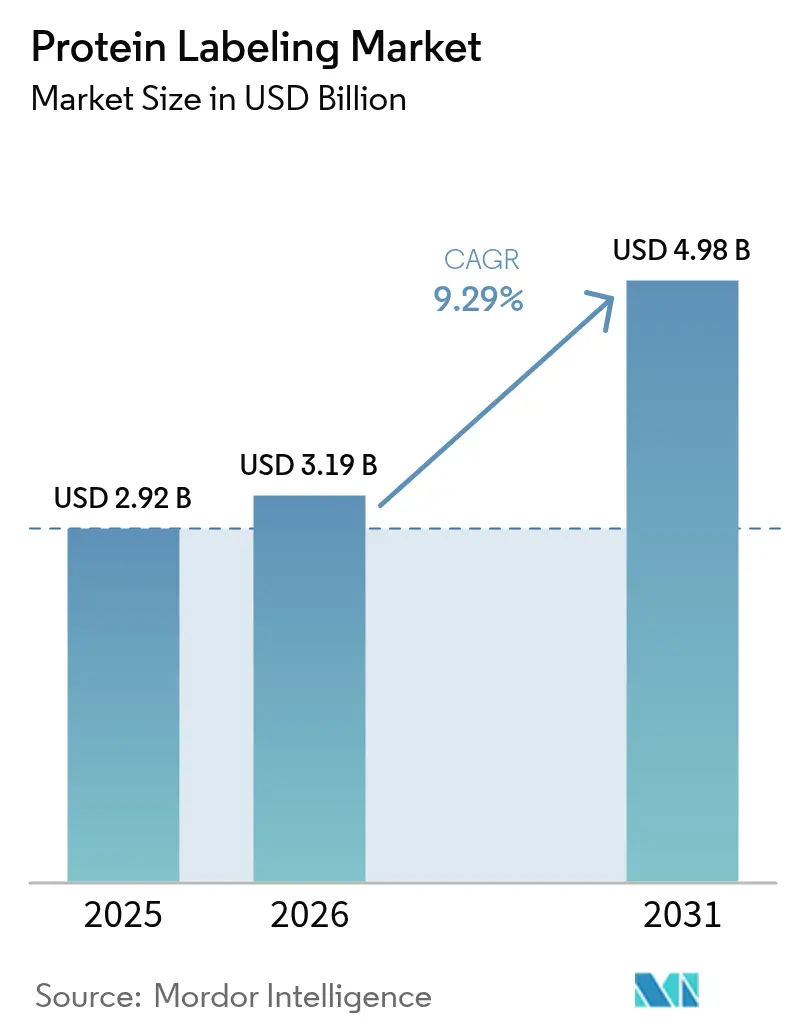
| Market Size (2026) | USD 3.19 Billion |
| Market Size (2031) | USD 4.98 Billion |
| Growth Rate (2026 - 2031) | 9.29% CAGR |
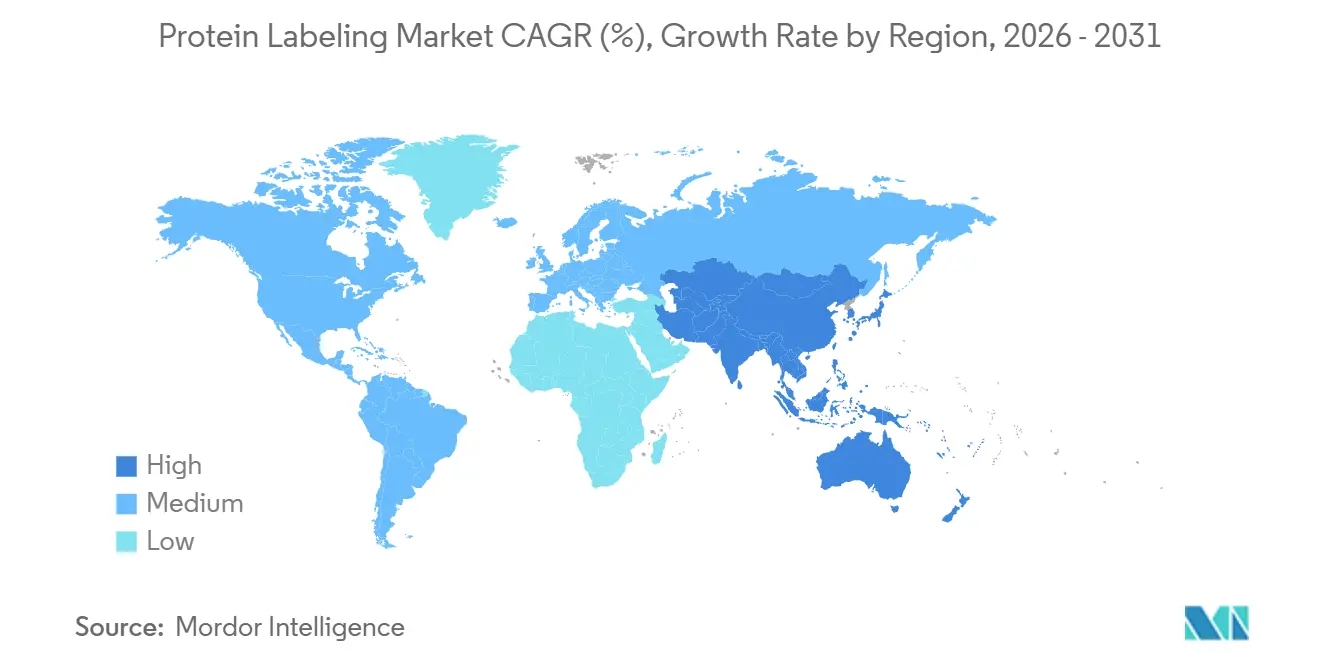
| Fastest Growing Market | Asia Pacific |
| Largest Market | North America |
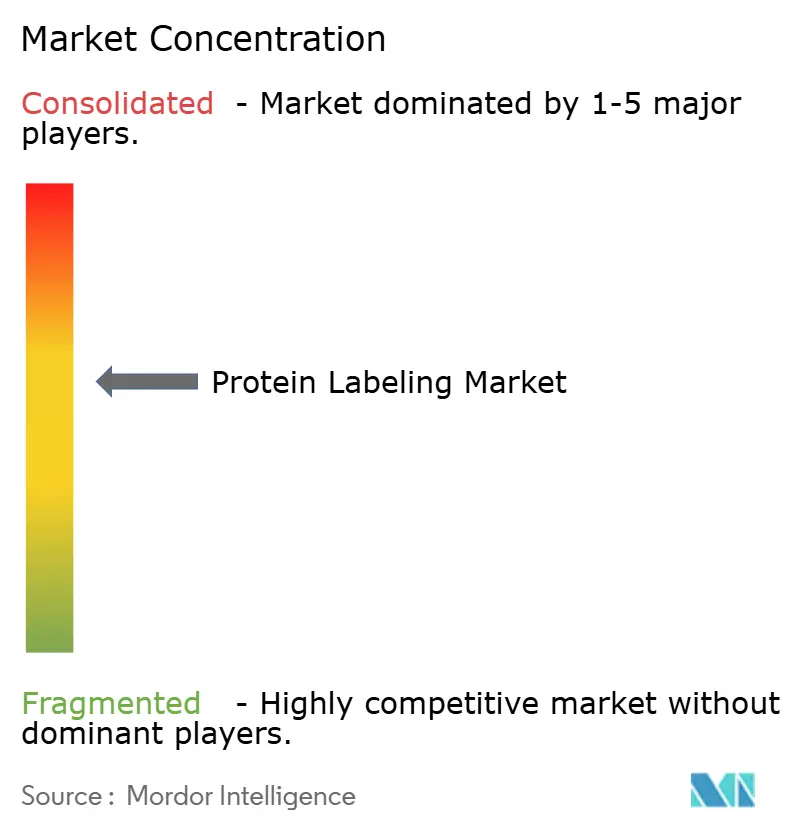
| Market Concentration | Medium |
Major Players *Disclaimer: Major Players sorted in no particular order Image © Mordor Intelligence. Reuse requires attribution under CC BY 4.0. | |
Protein Labeling Market Analysis by Mordor Intelligence
The Protein Labeling Market size is expected to grow from USD 2.92 billion in 2025 to USD 3.19 billion in 2026 and is forecast to reach USD 4.98 billion by 2031 at 9.29% CAGR over 2026-2031.
Demand is propelled by breakthroughs that allow site-specific tags with minimal impact on protein conformation, an essential requirement for today’s advanced proteomics, live-cell imaging, and biotherapeutic workflows. The growing use of artificial-intelligence tools for structure prediction, the expanding pipeline of antibody-drug conjugates, and the migration of complex bioconjugation tasks to specialist CDMOs jointly broaden commercial opportunities. At the same time, capital-intensive analytical platforms and evolving regulations around radio-labelled conjugates remain practical hurdles. Competitive intensity is rising as incumbents look to differentiate via proprietary chemistries, integrated service models, and strategic alliances with drug developers.
Key Take Aways
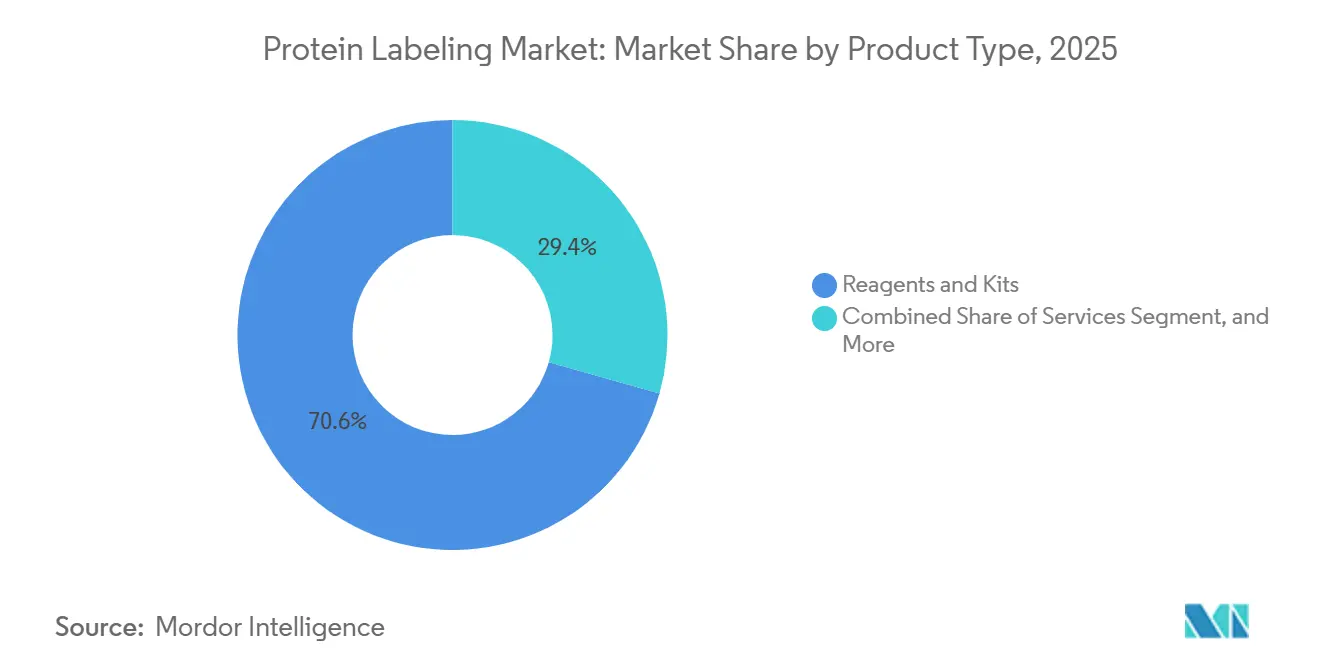
- By product type, reagents and kits accounted for 70.62% of the protein labeling market share in 2025; services are forecast to expand at a 10.31% CAGR through 2031.
- By application, immunological techniques led with 34.05% revenue share in 2025; cell-based assays are projected to grow at a 10.96% CAGR to 2031.
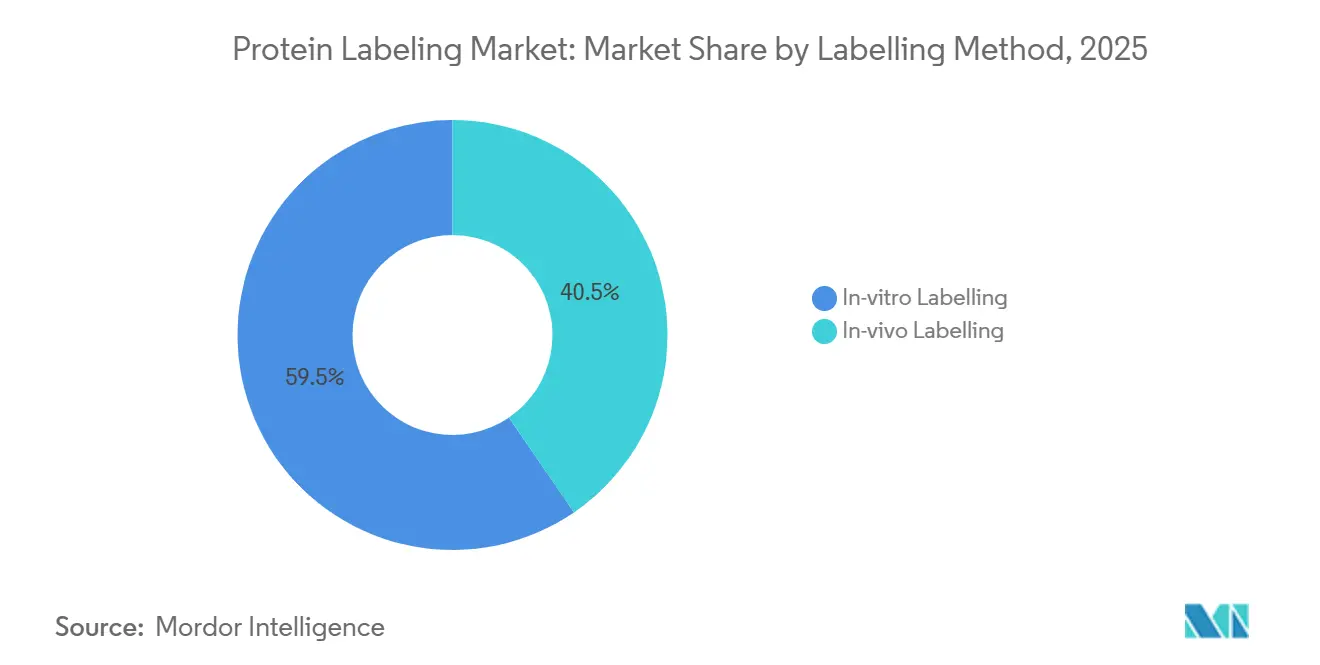
- By labeling method, in vivo approaches accounted for 40.45% of the protein labeling market in 2025 and are projected to grow at a 12.04% CAGR through 2031.
- By end user, CROs and CDMOs are rising at a 12.91% CAGR, outpacing pharma and biotech companies.
Note: Market size and forecast figures in this report are generated using Mordor Intelligence’s proprietary estimation framework, updated with the latest available data and insights as of 2026.
Global Protein Labeling Market Trends and Insights
Drivers Impact Analysis*
| DRIVER | (~) % IMPACT ON CAGR FORECAST | GEOGRAPHIC RELEVANCE | IMPACT TIMELINE |
|---|---|---|---|
| Advances in site-specific tagging technologies | +2.8% | Global, strongest in North America and Western Europe | Medium term (2-4 years) |
| Expansion of proteomics & multi-omics R&D pipelines | +2.1% | Global, led by Europe and North America | Long term (≥ 4 years) |
| Growing application in antibody-drug conjugates & targeted protein degradation | +1.9% | North America and Asia-Pacific | Medium term (2-4 years) |
| Rising outsourcing of complex conjugation to CROs/CDMOs | +1.5% | Asia-Pacific and North America | Short term (≤ 2 years) |
| AI-assisted probe design for ultra-high-multiplex imaging | -0.5% | Emerging markets, smaller research institutions globally | Medium term (2-4 years) |
| Curve & other ultrafast in-tissue labeling platforms enabling single-day 3-D mapping | -0.4% | Global, more pronounced in regions with challenging infrastructure | Short term (≤ 2 years) |
| Source: Mordor Intelligence | |||
Advances in Site-Specific Tagging Technologies
Bioorthogonal click chemistry and the incorporation of unnatural amino acids have evolved into commercial standards. Strain-promoted azide–alkyne cycloaddition now operates at physiological pH without requiring copper catalysts.[1]“Bioorthogonal Chemistry in Live Cells,” Nature, nature.com This development eliminates metal toxicity in live-cell studies and reduces heterogeneity in the production of antibody-drug conjugates (ADCs). Sortase-mediated ligation achieves labeling efficiency exceeding 95% on antibody heavy chains, a precision emphasized in recent regulatory guidance. Systems for unnatural amino acids, compatible with CHO and HEK293 hosts, enable the direct expression of site-labeled proteins. This innovation streamlines the process from five steps to two, reducing costs by approximately 25% for research-grade conjugates.[2]Cell Press, “Spatial Biology Imaging,” cell.com ISO standards recognize site-specific labeling as a best practice for traceability, further driving its adoption.
Expansion of Proteomics & Multi-Omics R&D Pipelines
In 2025, platforms analyzing proteomics and multi-omics data processed over 10 million samples, tripling the volume from 2023.[3]U.S. Food and Drug Administration, “Antibody-Drug Conjugates Guidance,” fda.gov Integrating proteomics with RNA-seq and metabolomics requires reagents compatible with LC-MS workflows, favoring amine-reactive NHS esters over bulkier systems. Blood-based proteomics is emerging as a critical tool in cellular therapy manufacturing. Techniques such as laser microdissection-coupled arrays are profiling over 200 phosphoproteins from tumor tissue, supporting precision oncology decisions. Compliance with regulatory standards is driving laboratories toward validated, kit-based labeling protocols.
Growing Application in Antibody-Drug Conjugates & Targeted Protein Degradation
By early 2026, the global ADC pipeline expanded to over 200 clinical candidates, doubling from 2023 levels. For next-generation constructs, achieving precise drug-to-antibody ratios of 2.0 or 4.0 requires site-specific conjugation. Targeted protein degradation modalities, including PROTACs and molecular glues, advanced to Phase II trials in 2024. These modalities utilize bifunctional linkers that combine a protein ligand with a fluorescent tag, enabling pharmacokinetic imaging. Regulators increasingly view homogeneous conjugation as a risk-mitigation factor, driving demand for precision labeling kits.
Rising Outsourcing of Complex Conjugation to CROs/CDMOs
Pharmaceutical companies are increasingly outsourcing conjugation development to service providers to accelerate timelines. In the first half of 2024, biologics revenue reached significant levels, with conjugation contributing an estimated 15-20%. Service providers expanded their capabilities in 2024, adding facilities specifically for site-specific linker-payload attachment. Between 2024 and 2025, manufacturing capacity for conjugates increased significantly, with major players installing additional bioreactor capacity. National-security reviews in 2024 highlighted a high dependency on certain regions for biologics workflows, prompting initiatives to incentivize onshoring.
Restraint Impact Analysis*
| RESTRAINT | (~) % IMPACT ON CAGR FORECAST | GEOGRAPHIC RELEVANCE | IMPACT TIMELINE |
|---|---|---|---|
| High capital cost of high-resolution MS workflows | –1.2% | Global, acute in emerging markets | Medium term (2-4 years) |
| Regulatory complexity around radio-isotope conjugates | –0.8% | Europe and North America | Long term (≥ 4 years) |
| Limitations associated with protein labelling assays and methods | -0.7% | Global | Medium term (2-4 years) |
| Intracellular crowding-induced steric hindrance reducing labeling efficiency in >20 kda fusion tags | -0.4% | Global, more pronounced in regions with challenging infrastructure | Short term (≤ 2 years) |
| Source: Mordor Intelligence | |||
High Capital Cost of High-Resolution MS Workflows
Instruments such as Orbitrap, Q-TOF, and FT-ICR, each priced over USD 2 million, require annual service contracts ranging from USD 150,000 to 250,000. These high costs restrict their adoption to well-funded core facilities. Agilent’s Life Sciences unit reported a strong USD 1.6 billion in Q4 2024, although sales of MS consumables experienced only modest mid-single-digit growth. Bruker noted extended sales cycles for its BioSpin platforms as laboratories delayed capital expenditures. Additionally, smaller institutions increasingly outsource proteomics to centralized cores, reducing demand for premium labeling reagents designed for ultra-high-resolution analyses.
Regulatory Complexity Around Radio-Isotope Conjugates
Radio-isotope protein conjugates encounter a complex regulatory environment, leading to delays of 12-18 months for EU approvals and requiring separate manufacturing licenses in the U.S. under Nuclear Regulatory Commission regulations. The EMA's 2024 directive emphasizes radionuclide purity and specific-activity testing for each isotope. Similarly, the FDA's 2024 guidance on immunogenicity highlights the risks associated with conjugation heterogeneity. Moreover, cold-chain logistics and half-life limitations confine production to facilities located near cyclotrons, further tightening the supply chain.
*Our forecasts treat driver/restraint impacts as directional, not additive. The impact forecasts reflect baseline growth, mix effects, and variable interactions.
Segment Analysis
By Product Type: Services Outpace Reagents as Outsourcing Accelerates
Reagents and kits accounted for 70.62% of protein labelling market revenues in 2025, underscoring their essential role in day-to-day workflows across discovery, diagnostics, and manufacturing. Ready-to-use chemistries simplify protocol standardisation and support reproducibility, keeping demand resilient even as new techniques emerge. Continuous improvements in dye brightness and click-ready handles sustain incremental pricing power and entice repeat purchases.
The services segment, however, is outpacing headline growth at a 10.31% CAGR. This surge reflects the escalating technical complexity of antibody-drug conjugation, targeted degradation probes and live-animal imaging agents that exceed many in-house capabilities. CDMOs are adding dedicated 1,000–2,000 L suites, such as Lonza’s 2024 expansion in Visp, to accommodate large-scale payload conjugation and fill-finish tasks. The protein labelling market size for outsourced projects is projected to expand steadily as pipeline sponsors seek rapid, GMP-compliant solutions.


By Application: Cell-Based Assays Surge on Proteomics Platform Adoption
Immunological techniques remained the largest slice of the protein labelling market with a 34.05% share in 2025, benefiting from decades of optimisation in ELISA, western blot and immunohistochemistry. High throughput and clinically validated protocols ensure enduring relevance in biomarker verification, lot-release testing and routine pathology.
Cell-based assays, however, record the most rapid advance at 10.96% CAGR as researchers prioritise physiologically relevant readouts in oncology, neurology and regenerative medicine. Fluorescent-probe portfolios from Thermo Fisher enable real-time monitoring of receptor activation, trafficking and complex assembly. The protein labelling market share captured by dynamic live-cell platforms is set to widen as automated imaging and high-content analytics permeate screening laboratories.
By Labelling Method: In-Vivo Techniques Gain as Spatial Biology Expands
In-vitro chemistries continue to dominate with 59.55% of the protein labelling market in 2025, valued for precise stoichiometry and straightforward quantitation. Diagnostics and structural biology still rely heavily on purified-protein modifications that demand controlled environments.
In-vivo labelling registers a faster 12.04% CAGR, driven by advances in genetic code expansion, enzyme-mediated tagging and ultrafast CuRVE labelling that spans intact 3D tissues. These techniques enable researchers to map protein dynamics in native cellular contexts, critical for neurobiology and tumour micro-environment studies. The protein labelling market size attached to real-time intracellular applications will therefore widen progressively through 2031.
By End User: CROs/CDMOs Lead Growth as Biopharma Outsources Complexity
Pharmaceutical and biotech firms held 44.35% of 2025 revenues, validating the centrality of protein tagging from target identification through late-stage development. Rising venture funding, such as Syncell’s USD 15 million Series A to expand its Microscoop spatial-proteomics platform, injects fresh demand for custom reagents and analytics.
Nonetheless, CROs and CDMOs show the sharpest climb at 12.91% CAGR as sponsors externalise conjugation and GMP analytics. Partnerships like GenNext-Thermo Fisher that integrate advanced footprinting and Orbitrap LC-MS combine best-in-class tools with regulatory expertise, cementing the outsourcing model’s appeal. Academic institutes remain essential consumers for fundamental inquiries, while diagnostics labs favour rapid-turnaround immunoassays using pre-validated tagging kits.
Geography Analysis
North America generated 37.35% of 2025 revenues, supported by robust NIH funding, a dense biopharma cluster, and early adoption of next-generation labelling technologies. MIT’s CuRVE breakthrough, capable of labelling tens of millions of cells in a single day, exemplifies regional leadership in disruptive methodology. A high cadence of FDA approvals for ADCs and radio-immunoconjugates further anchors commercial momentum.
Europe ranks second, buoyed by Horizon Europe grants and strong biomanufacturing corridors in Germany, the United Kingdom, and France. Sartorius’ acquisition of Polyplus expanded the continent’s vector production capabilities, necessitating advanced tagging of viral envelope proteins. Regulatory harmonisation is progressing, yet divergent approaches to radio-isotope handling keep market entry costs elevated.
Asia-Pacific is the fastest-growing arena, advancing at an 11.40% CAGR. Chinese CDMOs such as WuXi Biologics report vibrant demand for conjugation formats branded under WuXiBody and associated linker chemistries. National industrial policies, including China’s 14th Five-Year Plan and India’s BIRAC initiatives, funnel capital into proteomic infrastructure, although uneven access to high-end MS platforms persists. South Korea’s rapid scale-up of antibody-drug conjugate facilities, backed by Samsung Biologics, further cements regional ascent.

Competitive Landscape
The top five suppliers collectively capture nearly half of global revenues, pointing to a moderately concentrated field. Thermo Fisher Scientific leads with an end-to-end portfolio of fluorescent probes, click-chemistry kits, microscopes and LC-MS systems. Merck KGaA follows, leveraging its legacy reagent brands to supply high-purity substrates for bioorthogonal tagging. Danaher’s Cytiva and Beckman Coulter units strengthen its position through bioprocess solutions and advanced flow cytometry analytics.
Strategic differentiation hinges on proprietary site-specific chemistries and integrated service offerings. Lonza’s twin 1,200 L conjugation suites allow seamless scale-up from preclinical to commercial batches, while Bio-Rad broadens its super-resolution imaging reagents for multiplex panel design. Recent moves include Sartorius’ launch of the Octet R8e BLI system that captures binding-kinetics data more rapidly than previous models.
Alliances between tech innovators and drug developers continue to proliferate. EditCo Bio’s licensing of Promega’s HiBiT, HaloTag, and NanoLuc platforms streamlines CRISPR knock-in workflows, shortening build-test iterations. Prism BioLab’s tie-up with Elix integrates AI-driven compound design with peptide-mimetic screening, expanding the addressable client base for selective PPI inhibitors.
Protein Labeling Industry Leaders
Thermo Fisher Scientific Inc
Merck KGaA
Perkinelmer Inc
Danaher Corporation
F. Hoffmann-La Roche Ltd.
- *Disclaimer: Major Players sorted in no particular order

Recent Industry Developments
- April 2026: Vertex received US FDA approval for protein label extensions of ALYFTREK and TRIKAFTA, significantly expanding the availability of these treatments to approximately 95% of individuals with cystic fibrosis (CF) in the United States.
- July 2025: Max Planck Institute unveiled a next-generation protein labeling tool that outperforms the legacy SNAP-tag in live-cell imaging.
- May 2025: GenNext Technologies partnered with Thermo Fisher to integrate AutoFox footprinting with Orbitrap LC-MS solutions.
- April 2025: EditCo Bio licensed Promega’s HiBiT, HaloTag and NanoLuc technologies to enhance CRISPR knock-ins.
- April 2025: Prism BioLab and Elix launched an AI-accelerated peptide-mimetic discovery collaboration.


Research Methodology Framework and Report Scope
Market Definitions and Key Coverage
Our study defines the protein labeling market as all commercial sales of reagents, ready-to-use kits, and fee-based custom conjugation services that covalently or non-covalently tag proteins in vitro or in vivo for detection, purification, or functional studies across academic, biopharma, diagnostic, and contract research laboratories.
Scope exclusion: Bulk commodity amino-reactive chemicals sold for downstream manufacturing and fully label-free detection platforms are outside the count.
Segmentation Overview
- By Product Type
- Reagents & Kits
- Services
- Other Products (Spin Columns, Resins)
- By Application
- Immunological Techniques
- Cell-based Assays
- Fluorescence Microscopy
- Protein Microarrays
- Mass Spectrometry
- By Labelling Method
- In-vitro Labelling
- In-vivo Labelling
- By End User
- Pharmaceutical & Biotechnology Companies
- Contract Research & Manufacturing Organisations (CROs/CDMOs)
- Academic & Research Institutes
- Clinical Diagnostics Laboratories
- By Geography
- North America
- United States
- Canada
- Mexico
- Europe
- Germany
- United Kingdom
- France
- Italy
- Spain
- Rest of Europe
- Asia-Pacific
- China
- India
- Japan
- Australia
- South Korea
- Rest of Asia-Pacific
- Middle East and Africa
- GCC
- South Africa
- Rest of Middle East and Africa
- South America
- Brazil
- Argentina
- Rest of South America
- North America
Detailed Research Methodology and Data Validation
Primary Research
Mordor analysts conducted structured calls and short surveys with bench scientists, procurement managers at CRO/CDMOs, and regional distributors across North America, Europe, and Asia. These conversations clarified typical kit replacement cycles, emerging labeling workflows (e.g., click-ready unnatural amino acids), and average selling prices, which were pivotal for stress-testing desk assumptions.
Desk Research
We began by mapping export codes for biochemical reagents in UN Comtrade, reviewing NIH RePORTER grant outlays, and extracting assay kit shipment data published by bodies such as Europe's CORDIS and Japan's METI. Patent activity on site-specific chemistries was pulled from Questel, while pricing and volume cues came from SEC-filed 10-Ks, investor decks, and open-access journals in Proteomics and Analytical Chemistry. Dow Jones Factiva and D&B Hoovers supplemented revenue splits of privately held dye and tag suppliers, giving us baseline input costs and channel mix. These sources, illustrated above, are not exhaustive; many additional public datasets and gray literature fed into evidence screens and cross-checks.
Market-Sizing & Forecasting
We anchor the top-down model on observed reagent and kit imports plus domestic production, then reconcile totals with a bottom-up roll-up of sampled supplier revenues and channel checks. Core variables include: annual PubMed publications mentioning "fluorescent protein tag," UN Comtrade HS 3822 reagent tonnage, average NHS-ester dye ASPs, count of antibody-drug conjugate clinical trials, and regional R&D spend indexed by OECD biotech statistics. A multivariate regression blends these drivers, and an ARIMA overlay captures cyclical reorder patterns before projecting through 2030. Where bottom-up estimates undershoot or overshoot by over five percent, we iteratively adjust volumes or ASPs until deltas fall within that threshold.
Data Validation & Update Cycle
Outputs flow through three-layer checks: automated variance flags, peer analyst review, and final sign-off. Reports refresh annually; interim events such as large M&A deals or regulatory shifts trigger expedited updates, ensuring clients receive the most current baseline.
Why Our Protein Labelling Baseline Commands Reliability
Published figures often diverge because firms choose different product baskets, extrapolate from dated CAGRs, or refresh data irregularly. Our disciplined scoping, live price sampling, and primary corroboration limit such drift.
Key gap drivers include exclusion of fee-based conjugation services by some publishers, reliance on legacy dye price decks, or use of flat volume growth across high-growth Asian labs. Mordor's model, refreshed each year and stress-tested with on-ground interviews, therefore yields a balanced midpoint.
Benchmark comparison
| Market Size | Anonymized source | Primary gap driver |
|---|---|---|
| USD 2.92 B (2025) | Mordor Intelligence | - |
| USD 2.62 B (2024) | Global Consultancy A | omits custom service revenues and applies static ASP deflators |
| USD 2.67 B (2024) | Industry Journal B | limited primary validation; growth derived from generic proteomics CAGR |
| USD 2.35 B (2024) | Data Tracker C | reagent-only scope; excludes Asia-Pacific outsourcing spend |
In sum, the side-by-side shows that Mordor's carefully bounded scope, variable-based modeling, and yearly refresh cadence produce a dependable baseline that decision-makers can trace to transparent inputs and reproducible steps.


Key Questions Answered in the Report
What is the projected value of the protein labelling market by 2031?
The market is expected to reach USD 4.98 billion by 2031, reflecting a 9.29% CAGR
Which region shows the fastest growth in the protein labelling market?
Asia–Pacific leads with an 11.40% CAGR, fuelled by expanding CDMO capabilities and supportive government initiatives.
Why are CROs and CDMOs gaining traction in the protein labelling industry?
Sponsors outsource complex conjugation to access specialised expertise, reduce capital outlays and compress development timelines, driving a 12.91% CAGR for this segment.
How do site-specific labelling technologies benefit drug discovery?
Precise tags improve homogeneity in antibody-drug conjugates and enable real-time monitoring of targeted protein degradation, thereby enhancing therapeutic efficacy.
What technical advances underpin the rise of in-vivo labelling?
Genetic code expansion, enzyme-mediated chemistries and MIT’s CuRVE method allow rapid, uniform tagging in living tissues without disrupting protein function.
Which restraint most significantly limits wider adoption of advanced protein labeling tools?
High capital costs for top-tier mass-spectrometry platforms remain the chief barrier, particularly in emerging markets with constrained research budgets.
Page last updated on:


