Market Overview
| Study Period | 2020 - 2031 |
|---|---|
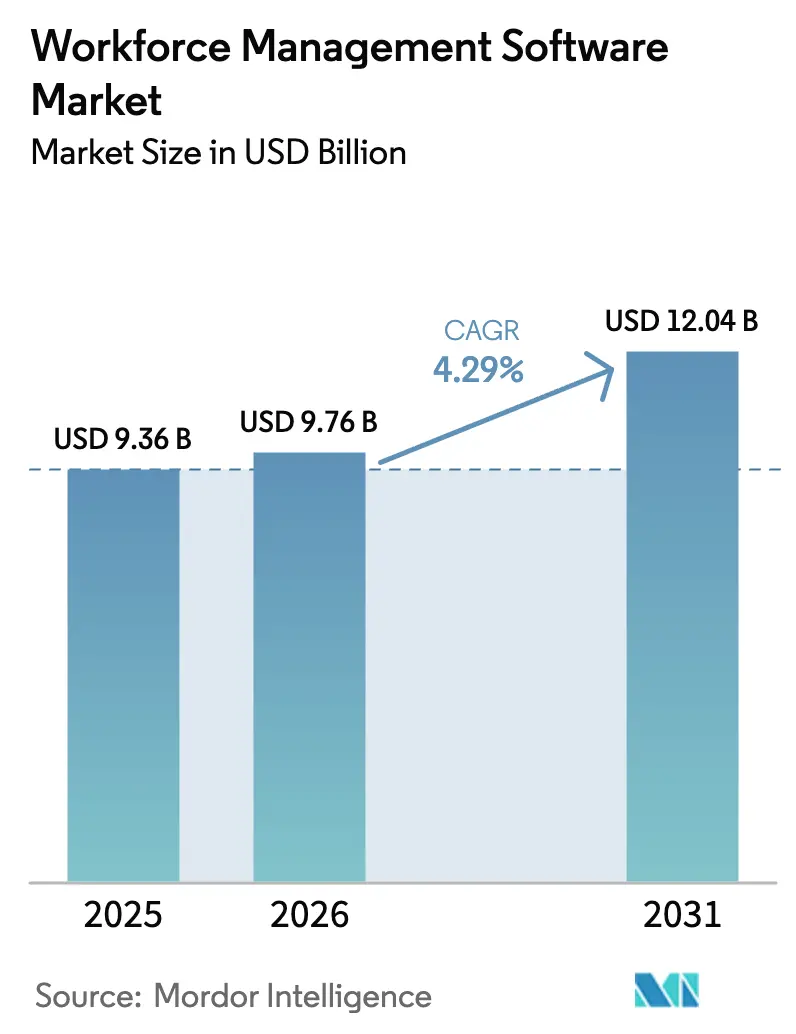
| Market Size (2026) | USD 9.76 Billion |
| Market Size (2031) | USD 12.04 Billion |
| Growth Rate (2026 - 2031) | 4.29% CAGR |
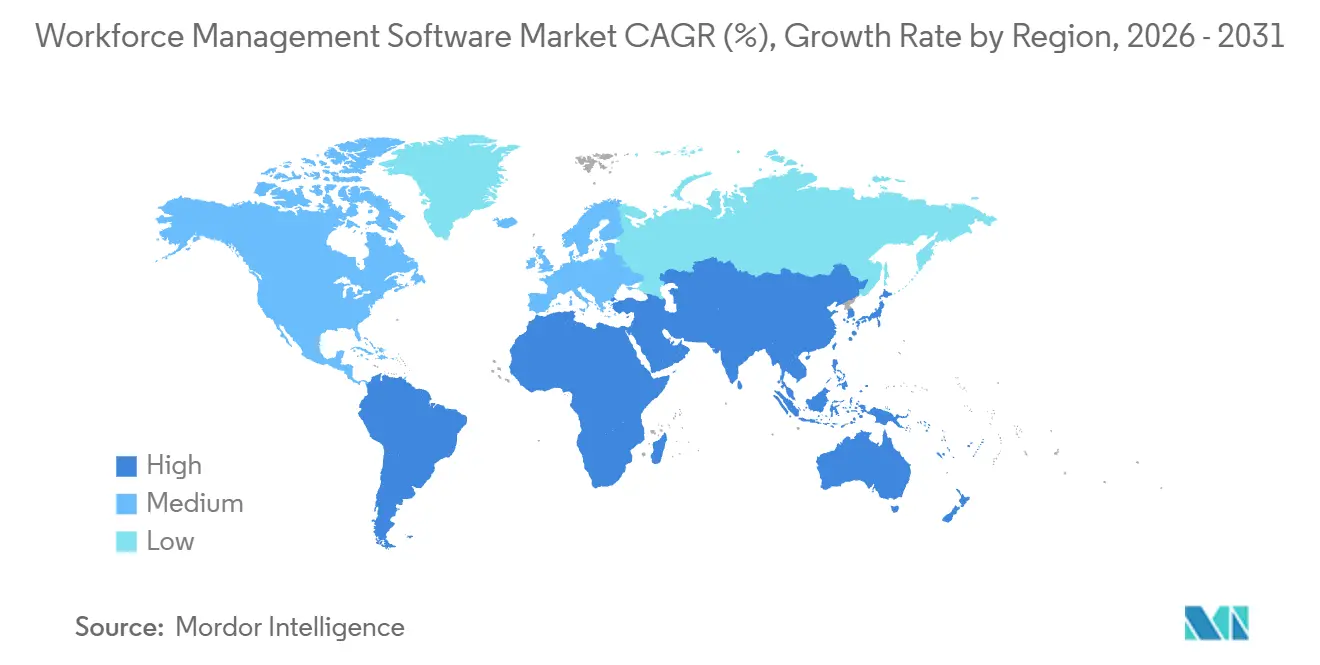
| Fastest Growing Market | Asia Pacific |
| Largest Market | North America |
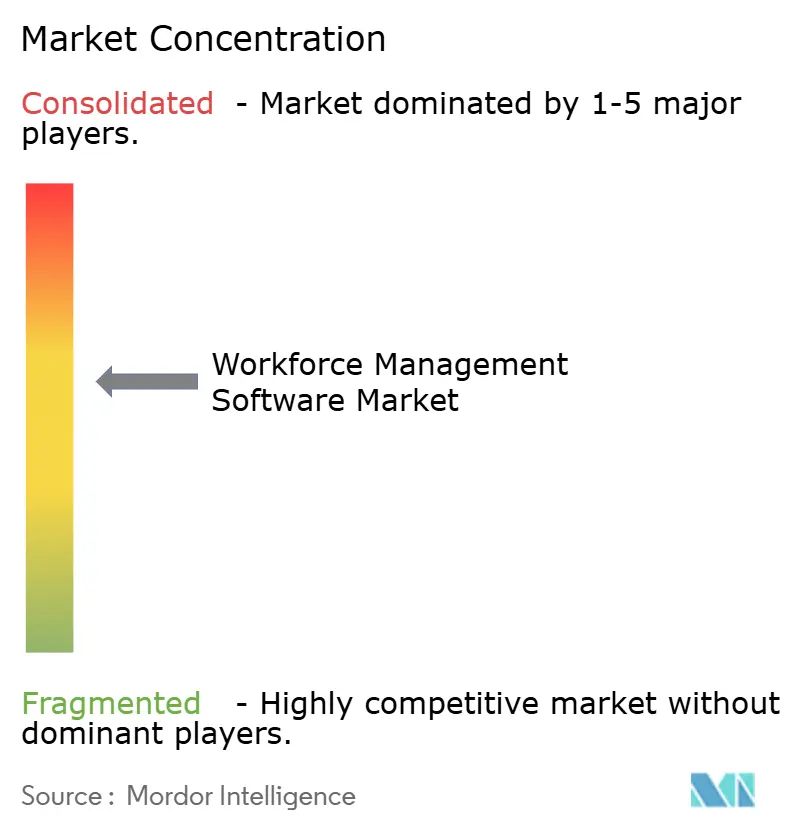
| Market Concentration | Medium |
Major Players *Disclaimer: Major Players sorted in no particular order Image © Mordor Intelligence. Reuse requires attribution under CC BY 4.0. | |
Workforce Management Software Market Analysis by Mordor Intelligence
The Workforce Management Software Market size is expected to increase from USD 9.36 billion in 2025 to USD 9.76 billion in 2026 and reach USD 12.04 billion by 2031, growing at a CAGR of 4.29% over 2026-2031. Uptake of generative AI copilots, real-time payroll-tax engines, and mobile-first applications is reshaping labor operations, turning a formerly back-office tool into a compliance and risk-mitigation platform. Vendors are embedding audit-ready analytics to meet regulations such as Australia’s Single Touch Payroll Phase 3 and France’s Article L1222-4, helping enterprises avoid monetary penalties.[1]Australian Taxation Office, “Compliance Report 2024,” ato.gov.au Cloud migration also accelerates as organizations seek to eliminate hardware outlays and reduce upgrade cycles, with cloud deployments already accounting for 63.81% of overall revenue in 2025. Regionally, North America leads in share, but Asia Pacific records the fastest expansion, benefiting from mobile workforce management penetration in Southeast Asian retail and Gulf Cooperation Council healthcare staffing initiatives.
Key Report Takeaways
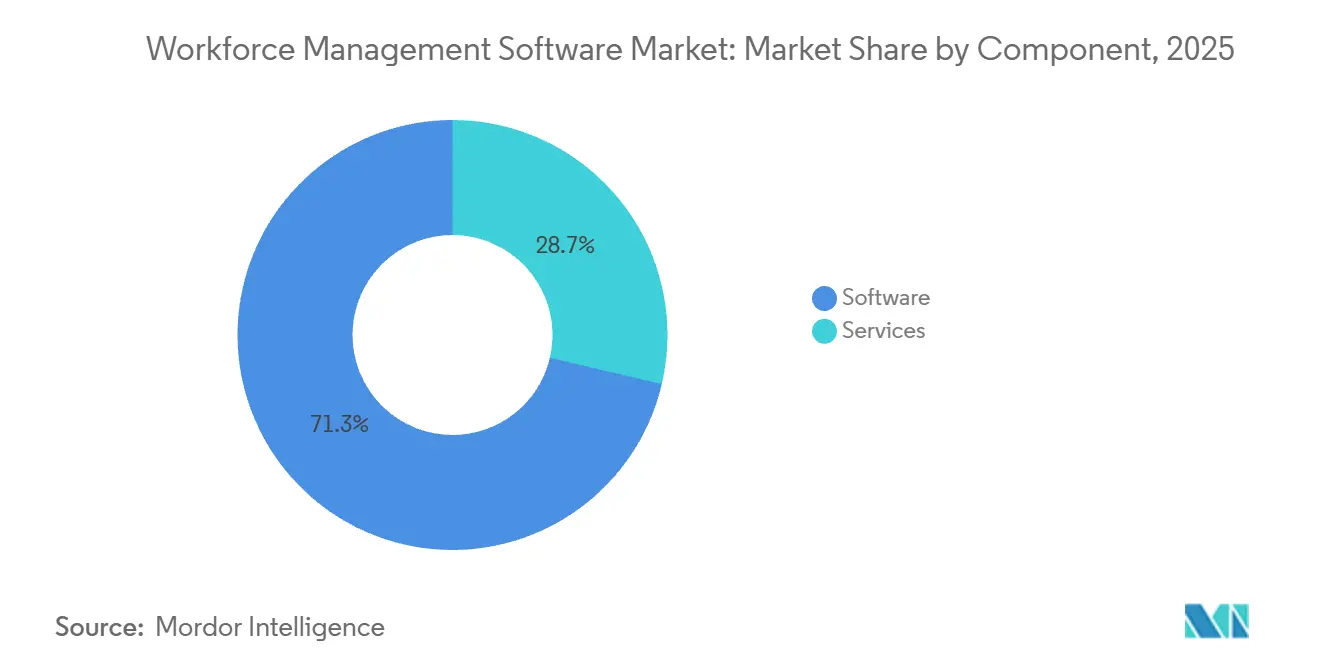
- By component, software retained a 71.34% revenue share in 2025; services are advancing at a 5.61% CAGR due to stronger demand for AI-tuning support.
- By software type, Time and Attendance Management held 29.63% of the revenue in 2025; Workforce Analytics is expected to compound at a 6.81% CAGR through 2031.
- By deployment mode, cloud held 63.81% of the workforce management software market share in 2025 and is projected to expand at a 5.94% CAGR through 2031.
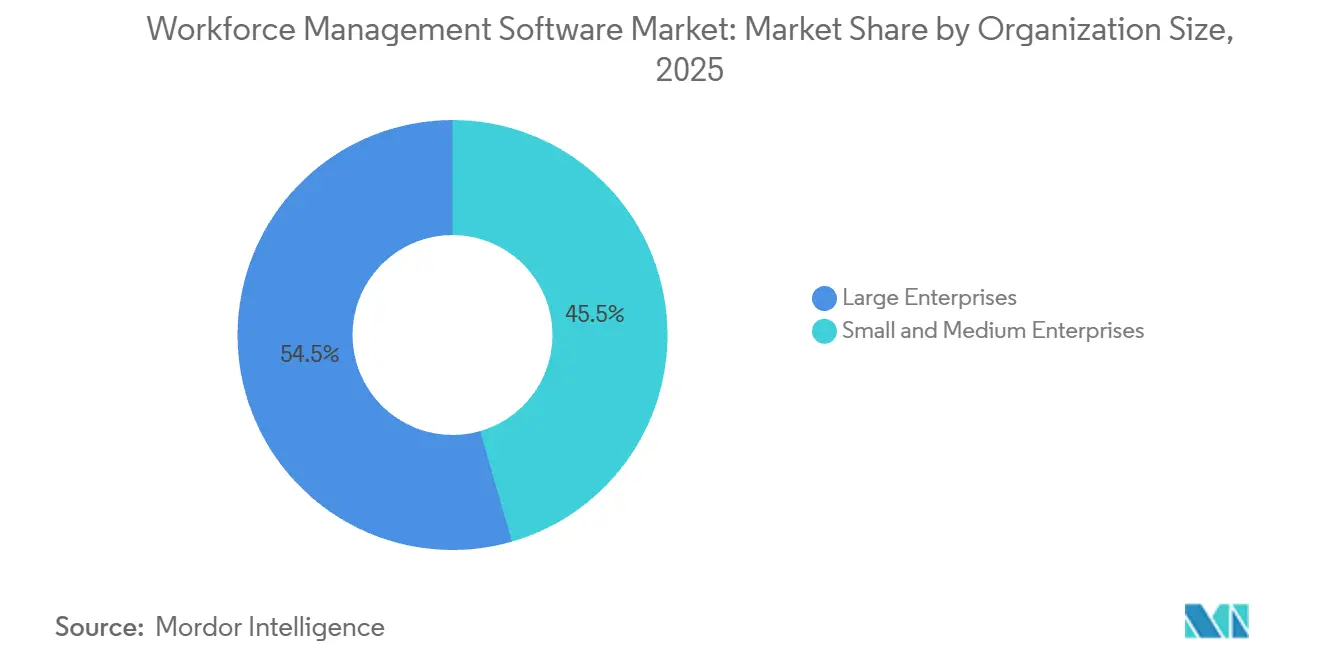
- By organization size, Large enterprises contributed 54.46% of revenue in 2025, whereas small and medium enterprises are scaling adoption at a 6.44% CAGR through 2031.
- By end-use industry, healthcare posted the highest growth trajectory at a 5.46% CAGR, while consumer goods and retail commanded 18.73% of the workforce management software market size in 2025.
- By geography, North America led with 38.91% of the workforce management software market size in 2025; Asia Pacific is forecast to climb at a 6.17% CAGR to 2031.
Note: Market size and forecast figures in this report are generated using Mordor Intelligence’s proprietary estimation framework, updated with the latest available data and insights as of January 2026.
Global Workforce Management Software Market Trends and Insights
Drivers Impact Analysis*
| Driver | (~) % Impact on CAGR Forecast | Geographic Relevance | Impact Timeline |
|---|---|---|---|
| AI-Driven Labor Forecasting Pilots Accelerate Adoption in EU Shift-Based Industries | +0.8% | Europe (Germany, France, Netherlands, Nordics) | Medium term (2-4 years) |
| Mobile-First WFM Penetration in Southeast Asian Multi-Site Retail Chains | +0.6% | Southeast Asia (Indonesia, Thailand, Vietnam, Philippines, Malaysia) | Short term (≤ 2 years) |
| GCC Healthcare Staffing Shortages Spur Cloud-Based WFM Investments | +0.5% | Middle East (UAE, Saudi Arabia, Qatar, Kuwait) | Medium term (2-4 years) |
| Real-Time Payroll Tax Reporting Mandates in Australia and New Zealand | +0.7% | Australia and New Zealand | Short term (≤ 2 years) |
| Biometric Time and Attendance to Curb Payroll Fraud in South American Logistics Hubs | +0.4% | South America (Brazil, Argentina, Chile, Colombia) | Medium term (2-4 years) |
| Adoption of Generative AI Copilots for Frontline Scheduling Optimization | +0.9% | Global, led by North America and Western Europe | Long term (≥ 4 years) |
| Source: Mordor Intelligence | |||
AI-Driven Labor Forecasting Pilots Accelerate Adoption in EU Shift-Based Industries
European manufacturers and logistics operators utilize machine-learning models that ingest point-of-sale and weather data to enhance hourly labor forecasts by 15-20% compared to static templates.[2]SAP SE, “Digital Manufacturing Survey 2024,” sap.com Workday’s Skills Intelligence feature matches certifications to shift requirements, reducing dependence on temporary agencies. EU Platform Work Directive provisions require algorithmic transparency, pushing vendors to build auditable scheduling trails. Deloitte’s 2024 survey found that 68% of shift-based employers in Germany, France, and the Netherlands plan to pilot AI forecasting by the end of 2025, up from 42% in 2023. SAP and ATOSS respond by bundling predictive scheduling compliant with works council rights. Competitive pressure now outweighs transparency concerns, accelerating the roll-out of solutions.
Mobile-First WFM Penetration in Southeast Asian Multi-Site Retail Chains
Retailers with 50-500 stores across Indonesia, Thailand, and Vietnam are abandoning desktop systems for smartphone apps that enable managers to approve leave and broadcast callouts in minutes. Telkomsel cited 47% growth in enterprise mobile data in 2024, driven by workforce applications. Boston Consulting Group reported that schedule-change cycle times fell from 48 hours to under 4 hours among adopters, improving responsiveness during Ramadan and Lunar New Year. The ASEAN Digital Economy Framework reduces cross-border compliance costs, while 72% of regional CEOs rank workforce productivity as the top operational priority. Deputy and Roubler localize Bahasa Indonesia and Thai, integrate with payroll providers, and undercut legacy vendors on price.
GCC Healthcare Staffing Shortages Spur Cloud-Based WFM Investments
Saudi Arabia aims for 3.5 hospital beds per 1,000 residents by 2030; however, staff supply lags, so ministries are mandating nurse-rostering platforms that can dynamically reallocate clinicians. Philips’ 2024 Future Health Index revealed that 64% of Saudi hospital administrators identified scheduling inefficiencies as a key driver of burnout. Deloitte projected a 250,000-worker shortfall across GCC healthcare by 2030. AI-driven tools that consider skill, acuity, and ratio rules now create compliant rosters in under 10 minutes. Oracle ME’s 2025 Abu Dhabi cloud region eases sovereignty worries, and UKG and Workday partner with local integrators to tap a USD 200-300 million addressable market.
Real-Time Payroll Tax Reporting Mandates in Australia and New Zealand
Australia’s Single Touch Payroll Phase 3 enforces one-day reporting of superannuation contributions, exposing errors instantly. MYOB found that 89% of small businesses with standalone time clocks faced compliance incidents, compared to 23% using integrated suites. The Australian Taxation Office recovered AUD 1.2 billion (USD 0.8 billion) in unpaid liabilities during 2024 audits. New Zealand’s 2025 PAYE updates mirror these rules, creating a trans-Tasman corridor favoring dual-country vendors. Workday’s Adaptive Planning module now forecasts daily accruals, enhancing cash reserve planning. Oracle and ADP added auto-filing modules that shrink reliance on third-party bureaus.
Restraints Impact Analysis*
| Restraint | (~) % Impact on CAGR Forecast | Geographic Relevance | Impact Timeline |
|---|---|---|---|
| Legacy MES/ERP Integration Costs among German Mittelstand Manufacturers | -0.5% | Germany, Central Europe | Medium term (2-4 years) |
| China’s Data Residency Rules Limiting Foreign SaaS WFM Deployments | -0.6% | China | Long term (≥ 4 years) |
| Unreliable Broadband Infrastructure Hindering Cloud Adoption in Sub-Saharan Africa | -0.3% | Sub-Saharan Africa (ex-South Africa) | Long term (≥ 4 years) |
| French Union Pushback Against Algorithmic Shift Scheduling | -0.2% | France, Belgium, Luxembourg | Medium term (2-4 years) |
| Source: Mordor Intelligence | |||
Legacy MES/ERP Integration Costs among German Mittelstand Manufacturers
Many German firms still run Siemens SIMATIC or SAP ECC from early 2000s vintages that lack modern APIs, incurring EUR 200,000-500,000 (USD 225,000-565,000) in integration bills and 12-18 month timelines.[2] SAP’s 2024 survey noted 62% of sub-1,000-employee manufacturers remain on-premise. Rockwell Automation reported that 47% cited integration complexity as the key barrier, over cost and security. VDMA found Mittelstand IT budgets average just 3.2% of revenue, limiting large-scale digital projects. Pre-built connectors help, but often require customization, which sustains manual data transfer and slows cloud migration.
China’s Data Residency Rules Limiting Foreign SaaS WFM Deployments
Revised 2024 cross-border data rules force employers to store attendance and leave data on mainland servers, compelling multinationals to deploy separate China-only environments or select domestic vendors. Security assessments for transfers last 60-90 days and cost USD 50,000-100,000 annually, boosting total ownership. Oracle, SAP, and Workday now operate China data centers yet feature gaps persist because AI training on Chinese data is restricted. Dual systems inflate licensing costs and hinder global analytics, trimming near-term market growth potential.
*Our forecasts treat driver/restraint impacts as directional, not additive. The impact forecasts reflect baseline growth, mix effects, and variable interactions.
Segment Analysis
By Component: Services Gain as AI Customization Demands Surge
Software represented 71.34% of revenue in 2025, primarily driven by multi-year subscriptions that bundle scheduling, time and attendance, and analytics services. Services, however, are growing 130 basis points faster at a 5.61% CAGR because enterprises need outside experts to fine-tune generative AI features. PwC found 67% of organizations deploying AI in HR required consulting to set guardrails and train staff. Large integrators capitalize on this gap, earning USD 1-2 million in services for every USD 0.5 million in software deals. Managed services now command a 20% premium, allowing mid-size hospitals to outsource compliance monitoring.
Software growth remains solid as vendors offer 10-15% discounts on three-year agreements, stabilizing annual recurring revenue. The workforce management software market size for services is on a higher trajectory as AI spreads beyond pilots, ensuring consultant pipelines remain full. Vendors hedge churn risk by stitching services into renewal discussions, locking customers into broader ecosystems.


By Software Type: Analytics Modules Capture Budget as CHRO Influence Grows
Time and attendance accounted for a 29.63% share in 2025, driven by payroll statutes; however, analytics led to growth at a 6.81% CAGR through 2031. McKinsey estimated predictive models cut voluntary turnover 18%, saving USD 3-5 million for a 1,000-employee firm. As 71% of CHROs now report directly to CEOs, board-level visibility drives increased analytics spending. Scheduling software grows roughly in line with the workforce management software market, aided by AI pattern recognition. Fatigue-risk tools are being adopted from aviation into mining and utilities, reflecting broader safety mandates.
The workforce management software market share for analytics is expected to increase as predictive dashboards become a table stake in CFO presentations. Vendors differentiate themselves by incorporating external signals, such as weather and social media, into forecasts that help justify overtime budgets.
By Deployment Mode: Cloud Dominance Solidifies Despite Sovereignty Concerns
Cloud deployment accounted for 63.81% of revenue in 2025 and is expanding at a 5.94% CAGR as firms avoid hardware depreciation and maintenance staffing costs. On-premise solutions remain viable for defense, finance, and public agencies due to strict sovereignty laws. Hybrid approaches emerge where attendance data resides on local servers, while scheduling logic remains in the cloud; however, latency issues impede real-time reporting. Microsoft’s Azure Stack HCI enables vendors to deliver a cloud-like user experience with residency compliance.
The workforce management software market size differential between cloud and on-premise solutions widens annually, with SMEs favoring simple subscription models over the USD 200,000 five-year ownership costs associated with in-house servers. Vendors promote “evergreen” upgrades, ensuring clients always run the latest compliance rules without disruptive downtime.
By Organization Size: SMEs Embrace Tiered Pricing as Vendors Democratize Access
Large enterprises held 54.46% of the spend in 2025, but SMEs are the growth engine, with a 6.44% CAGR. Deputy’s freemium tier for up to five employees and a USD 4.50 per-user premium plan exemplifies low entry barriers. 7shifts reported that 68% of its 2024 sign-ups had fewer than 50 staff members, up from 52% two years earlier. Wage inflation averaging 5% motivates even small retailers with 20 employees to automate scheduling.
Feature expectations diverge: large firms require role-based controls and Okta integration, whereas micro-businesses prioritize a mobile setup within one hour. The workforce management software market continues to fragment along these lines, with horizontal suites serving enterprises, while vertical newcomers pursue niche segments.
By End-Use Industry: Healthcare Leads Growth as Staffing Crises Intensify
Retail and consumer goods retained an 18.73% stake in 2025, reflecting the presence of dense hourly workforces and seasonal peaks. Healthcare clocks the fastest 5.46% CAGR, fueled by nursing shortages. The American Hospital Association identified a 100,000-nurse gap, resulting in 18% of hospitals diverting emergency patients monthly. The Advisory Board found that 79% of chief nursing officers plan to boost their workforce technology budgets for 2025.
Banking firms adopt solutions to track hybrid workers, while manufacturing requires a tight linkage with execution systems to align labor and production. Logistics operators deploy biometric time clocks to curb buddy punching, resulting in a 5-8% reduction in labor costs, according to Inter-American Development Bank data. Collectively, energy, utilities, and automotive represent a quarter of revenue, each governed by unique safety and union rules that cloud vendors are customizing into templated rule packs.
Geography Analysis
North America accounted for 38.91% of the 2025 revenue, driven by early adoption of cloud human capital management and stringent record-keeping laws. Market maturity tempers growth to 3.8% CAGR, yet replacement cycles spur AI upgrades. Mexico’s USD 36 billion near-shoring inflows in 2024 boost bilingual solution demand and profit-sharing compliance.[3]Mexican Ministry of Economy, “FDI Report 2024,” gob.mx Canada’s provincial overtime rules drive niches for region-specific absence trackers.
Europe contributed about 28% and shows mixed dynamics. The U.K.’s 2024 Employment Rights Bill accelerates retail conversions, while Germany’s works council approvals slow full-stack rollouts. Southern Europe outpaces continental averages at 5.2% CAGR as tourism rebounds. Nordic countries, with their generous leave policies, require sophisticated absence management modules that global suites have historically lacked.
The Asia Pacific is the fastest-growing territory, with a 6.17% CAGR. India’s 5.4 million IT-services workforce relies on solutions that combine project billing and state-wise compliance. Japan’s projected 6.4 million labor deficit by 2030 drives the need for AI scheduling among aging staff. South Korea’s 52-hour cap enforces precise time tracking, benefiting vendors integrated with biometric clocks. Australia and New Zealand see tailwinds from payroll-tax mandates that expose compliance gaps in spreadsheet-driven environments.
South America, the Middle East and Africa comprise roughly 15% of revenue but expand at 5.5-6% CAGR. Brazil’s tougher fraud penalties spur biometric adoption, while GCC healthcare bed targets create a USD 300 million opportunity for roster optimization. Sub-Saharan Africa adoption centers on South Africa, Kenya, and Nigeria where mobile-money pay runs circumvent limited banking access. Poor broadband outside capitals means offline-first design is non-negotiable.

Competitive Landscape
The top five suppliers, Oracle, SAP, Workday, UKG, and ADP, hold 45-50% market share, signaling moderate concentration. Oracle and SAP embed workforce management to raise suite stickiness, while UKG and Ceridian defend depth via verticalized features.
Generative AI remains the fiercest battleground; Workday filed 12 scheduling patents and UKG eight natural-language patents in 2024. Strategic themes include acquiring biometric hardware, building in-country data centers to satisfy sovereignty mandates, and targeting micro-businesses with USD 50-per-month bundles.
Vertical insurgents flourish. 7shifts corners the restaurant market, Deputy dominates the hospitality industry, and Skedulo specializes in field service. Technology moats hinge on ingesting unstructured data, weather, and social sentiment to sharpen demand forecasts. Private-equity backing fuels consolidation as UKG absorbs Workforce Software and Ceridian aligns with Microsoft Copilot integrations. Large enterprise suites utilize workforce modules as beachheads to cross-sell ERP, squeezing pure-play vendors to differentiate on usability and time-to-value.
Workforce Management Software Industry Leaders
ActiveOps PLC
NICE Ltd.
Infor Group
Oracle Corporation
UKG Inc.
- *Disclaimer: Major Players sorted in no particular order

Recent Industry Developments
- October 2025: Workday released Workday Illuminate, embedding generative AI across its suite, slashing schedule creation time by 70% in pilot hospitals.
- September 2025: UKG acquired Workforce Software for a reported USD 500 million, boosting fatigue management and union-compliance depth.
- August 2025: Oracle opened the Oracle ME cloud region in Abu Dhabi, granting GCC clients data-sovereign access to Fusion Cloud HCM modules.
- July 2025: SAP added predictive scheduling and S/4HANA integration in SuccessFactors to align labor with production demand.


Research Methodology Framework and Report Scope
Market Definitions and Key Coverage
Our study defines the workforce management software market as every licensed or subscription-based platform that helps employers record time and attendance, forecast staffing needs, create schedules, track leave, and analyze labor costs across on-premise or cloud deployments. Solutions that sit only inside payroll suites without stand-alone scheduling or analytics functions are excluded.
Scope exclusion: payroll-only modules that lack independent scheduling or analytics capability are not counted.
Segmentation Overview
- By Component
- Software
- Services
- By Software Type
- Time and Attendance Management
- Workforce Scheduling
- Workforce Analytics
- Absence and Leave Management
- Fatigue and Task Management
- By Deployment Mode
- Cloud
- On-Premise
- By Organization Size
- Large Enterprises
- Small and Medium Enterprises
- By End-Use Industry
- BFSI
- Consumer Goods and Retail
- Automotive
- Energy and Utilities
- Healthcare
- Manufacturing
- IT and Telecommunications
- Logistics and Transportation
- Other End-Use Industries
- By Geography
- North America
- United States
- Canada
- Mexico
- South America
- Brazil
- Argentina
- Rest of South America
- Europe
- United Kingdom
- Germany
- France
- Spain
- Italy
- Rest of Europe
- Asia Pacific
- China
- India
- Japan
- Australia
- South Korea
- Rest of Asia Pacific
- Middle East and Africa
- Middle East
- Saudi Arabia
- United Arab Emirates
- Turkey
- Rest of Middle East
- Africa
- South Africa
- Kenya
- Rest of Africa
- Middle East
- North America
Detailed Research Methodology and Data Validation
Primary Research
To sharpen assumptions, we interviewed HR tech product managers, regional payroll bureaus, and mid-market HR directors in North America, Europe, and Asia-Pacific. Their insights on typical user-based pricing, cloud migration pace, and contract churn rates guided model calibration and yielded consensus on forecast drivers such as AI-powered scheduling adoption.
Desk Research
Mordor analysts began with reputable public data, scanning labor statistics from the U.S. Bureau of Labor Statistics, Eurostat, and Japan's MIC, alongside trade association briefs from the American Payroll Association and CIPP. We linked those signals with import-export codes for HR software in UN Comtrade, patent filings on AI-driven scheduling captured through Questel, and select company filings parsed via D&B Hoovers and Dow Jones Factiva. Product pricing grids and user counts disclosed in SEC 10-Ks, investor decks, and association white papers helped us set average selling price (ASP) benchmarks and seat penetration ratios. This list is illustrative, and many other sources informed data capture and validation.
Market-Sizing & Forecasting
We first reconstructed the total addressable spending pool through a top-down build that paired enterprise counts by size band with licensed-seat penetration and median ASPs, which are then validated by sampled vendor revenue disclosures and channel checks. Key variables like cloud migration ratio, multi-module attach rates, regional labor-compliance mandates, macro hiring trends, and churn/renewal cycles feed a multivariate regression that projects annual license growth. Bottom-up cross-checks using sampled vendor revenues and regional channel billings flagged outliers and informed final adjustments. Forecasts to 2030 rely on ARIMA smoothing layered on scenario analysis reviewed with primary experts to stress-test upside and downside cases. Data gaps (for example, private-vendor billings in emerging markets) are bridged with scaled proxies drawn from similar GDP-per-capita clusters.
Data Validation & Update Cycle
Model outputs face variance screens against independent spend trackers and quarterly vendor results; any deviation above preset thresholds triggers re-audit by a senior analyst. Reports are refreshed annually, and material events such as major labor-law shifts prompt interim updates. A last-mile pre-publication check ensures clients receive the most current baseline.
Why Mordor's Workforce Management Software Baseline Earns Trust
Published estimates often differ because firms pick varying functional scopes, pricing ladders, and update cadences.
Key gap drivers include narrower functional scope (some studies drop analytics modules), different ASP escalation assumptions, and longer refresh gaps that miss rapid cloud repricing. Mordor's study anchors on 2025 as the base year, uses module-inclusive scope, and applies annually refreshed macro and pricing inputs, yielding a dependable view.
Benchmark comparison
| Market Size | Anonymized source | Primary gap driver |
|---|---|---|
| USD 9.35 B (2025) | Mordor Intelligence | - |
| USD 8.92 B (2023) | Global Consultancy A | Excludes analytics modules; two-year-old baseline |
| USD 9.43 B (2024) | Industry Publisher B | Uses single ASP band; limited primary validation |
Taken together, the comparison shows that when scope breadth, pricing tiers, and update frequency are harmonized, Mordor's balanced blend of validated inputs offers decision-makers a transparent, repeatable baseline they can rely upon.


Key Questions Answered in the Report
What is the workforce management software market size in 2026?
The market stands at USD 9.76 billion in 2026 and is projected to reach USD 12.04 billion by 2031.
How fast is the Asia Pacific region expanding?
Asia Pacific is forecast to grow at a 6.17% CAGR, the quickest among all regions, led by Southeast Asian retail adoption and mobile-first workforce management deployments.
Which deployment mode is leading adoption?
Cloud accounts for 63.81% of 2025 revenue and grows at a 5.94% CAGR, outpacing on-premise installations.
Why is healthcare the fastest-growing end-use segment?
Staffing shortages and regulatory nurse-patient ratios push hospitals to deploy AI-driven rostering platforms, driving a 5.46% CAGR through 2031.
What role does generative AI play in workforce management?
Generative AI copilots cut schedule creation time by up to 70%, interpret union rules, and surface compliance alerts, becoming the top value driver cited by HR leaders.
How concentrated is the competitive landscape?
The top five vendors hold about 45-50% market share, giving the market a moderate concentration score of 6.
Page last updated on:


