United States Mid-Power LED Package Market Size and Share
Market Overview
| Study Period | 2020 - 2031 |
|---|---|
| Forecast Data Period | 2026 - 2031 |
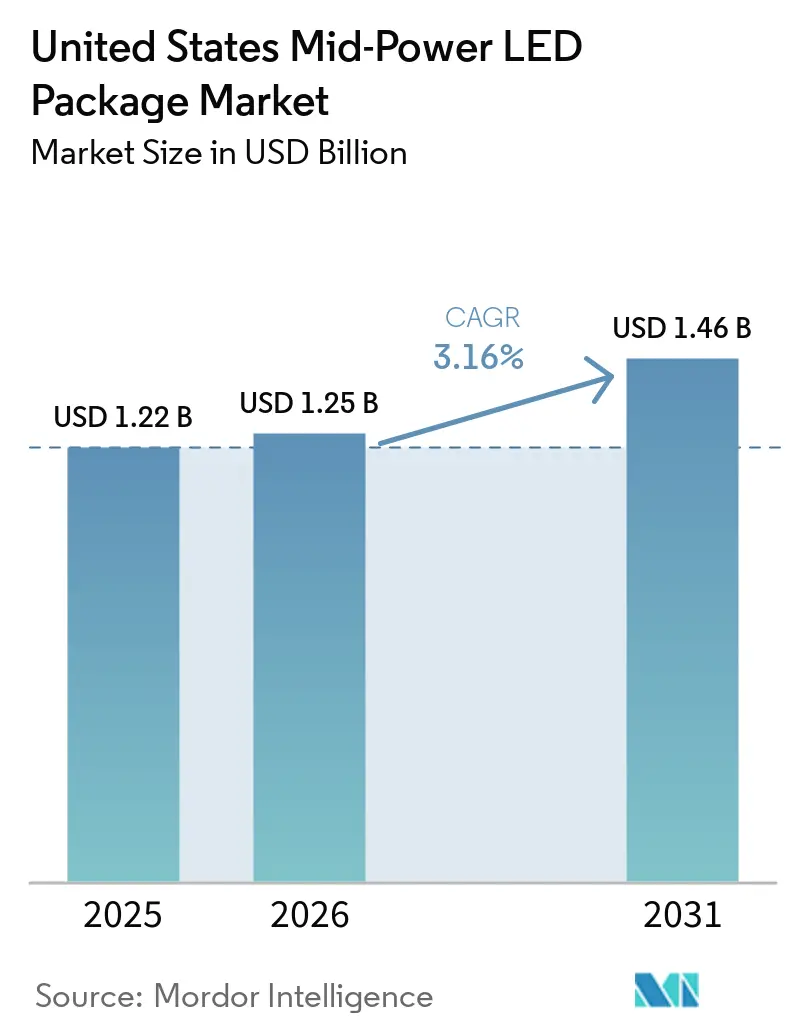
| Base Year Market Size (2025) | USD 1.22 Billion |
| Market Size (2026) | USD 1.25 Billion |
| Market Size (2031) | USD 1.46 Billion |
| Growth Rate (2026 - 2031) | 3.16% CAGR |
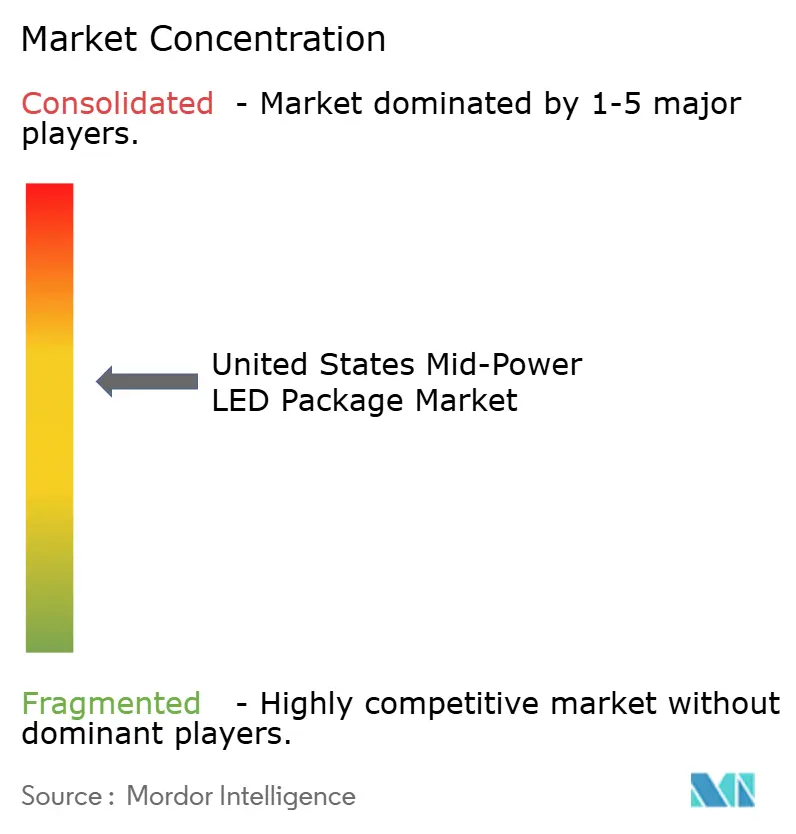
| Market Concentration | Medium |
Major Players *Disclaimer: Major Players sorted in no particular order Image © Mordor Intelligence. Reuse requires attribution under CC BY 4.0. | |
United States Mid-Power LED Package Market Analysis by Mordor Intelligence
The United States mid-power LED package market size is projected to be USD 1.22 billion in 2025, USD 1.25 billion in 2026, and reach USD 1.46 billion by 2031, growing at a CAGR of 3.16% from 2026 to 2031. Steady retrofitting activity in commercial and industrial real estate underpins unit demand, while the CHIPS and Science Act is trimming landed costs for locally assembled packages, narrowing the historical price gap with Asian imports. Surge pricing for indium and gallium, both subject to Chinese export controls, is encouraging dual-sourcing programs that favor domestic suppliers for risk-sensitive contracts. Automotive lighting, miniLED backlighting, and tunable-white office luminaires form the fastest-growing use cases, each requiring tighter wavelength binning and higher reliability than first-generation general-lighting parts. Against this backdrop, U.S. assemblers that couple substrate sourcing agreements with application-specific optical design are securing multi-year frameworks from tier-one OEMs even as commodity price competition intensifies.
Key Report Takeaways
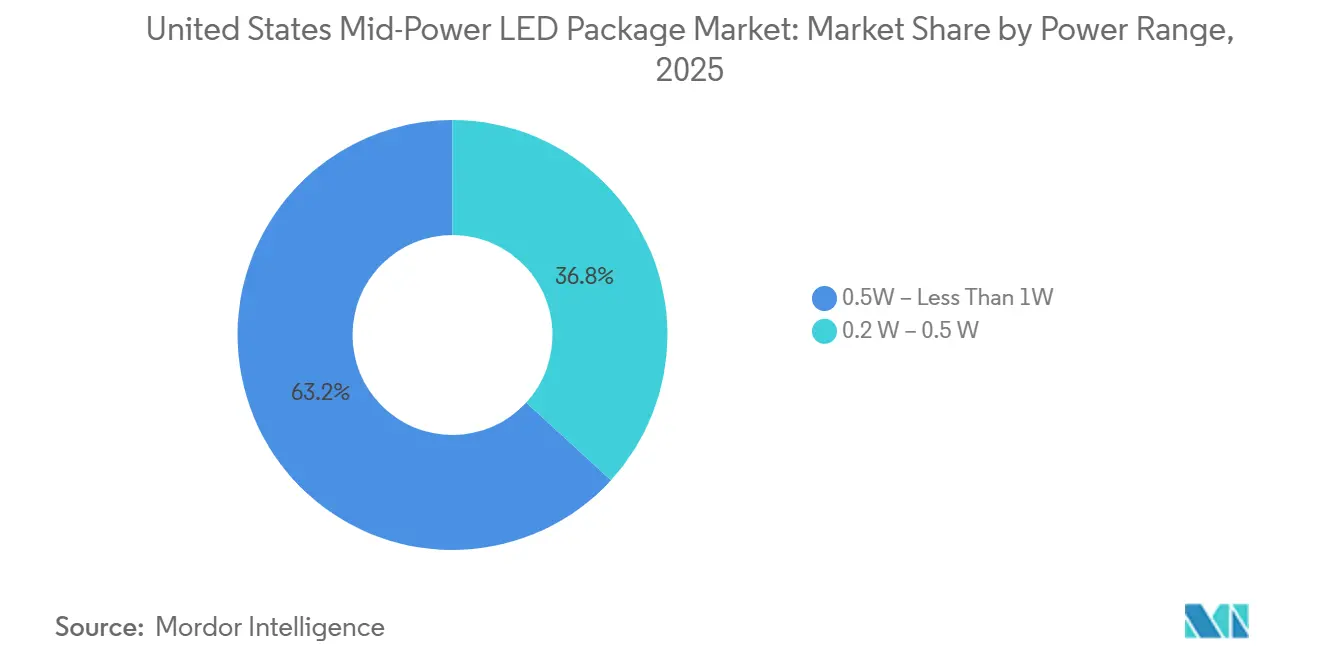
- By power range, the 0.5 W to less than 1 W segment commanded 63.19% of the United States mid-power LED package market share in 2025, and it is projected to expand at a 3.88% CAGR through 2031.
- By package architecture, surface-mount devices held 74.44% of the United States mid-power LED package market size in 2025, whereas chip-scale packages posted the highest forecast CAGR at 4.12% through 2031.
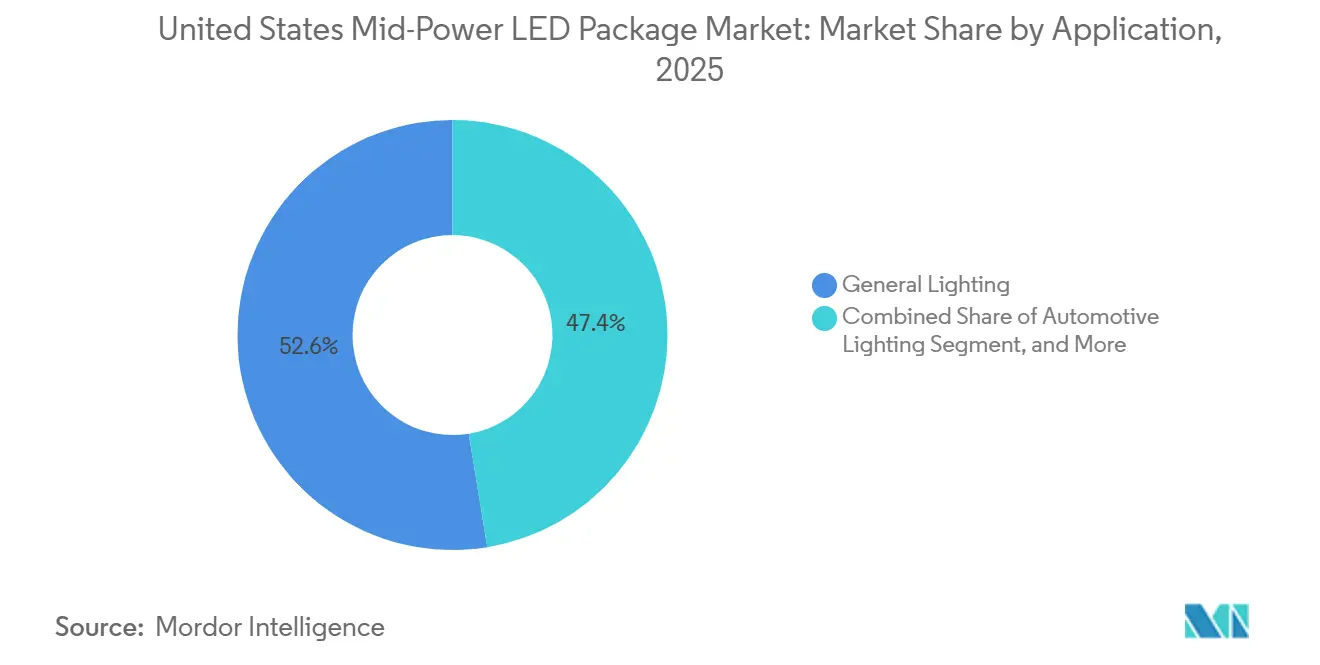
- By application, general lighting generated 52.58% revenue in 2025 and automotive lighting is set to record the fastest growth at a 3.96% CAGR to 2031.
Note: Market size and forecast figures in this report are generated using Mordor Intelligence’s proprietary estimation framework, updated with the latest available data and insights as of January 2026.
United States Mid-Power LED Package Market Trends and Insights
Drivers Impact Analysis*
| Driver | (~) % Impact on CAGR Forecast | Geographic Relevance | Impact Timeline |
|---|---|---|---|
| Rapid Adoption of Energy-Efficient Lighting in Commercial Retrofits | +1.2% | California, New York, Texas metro areas | Short term (≤ 2 years) |
| Increasing LED Penetration in Automotive Exterior Lighting | +0.9% | Michigan and Southern automotive corridors | Medium term (2–4 years) |
| Growing Use of Horticultural Lighting by U.S. Vertical Farms | +0.5% | Ohio, Kentucky, New Jersey, California | Medium term (2–4 years) |
| Federal Incentives for Domestic Semiconductor Packaging Under CHIPS Act | +0.7% | Arizona, Texas, New York | Long term (≥ 4 years) |
| MiniLED Backlight Proliferation in High-End TVs and Monitors | +0.4% | Consumer-electronics hubs nationwide | Short term (≤ 2 years) |
| Emergence of Tunable White Standards in WELL and LEED Buildings | +0.3% | Urban commercial real estate markets | Medium term (2–4 years) |
| Source: Mordor Intelligence | |||
Rapid Adoption Of Energy-Efficient Lighting In Commercial Retrofits
Utility rebate programs now cover roughly three-quarters of U.S. electricity customers, and 2026 expansions added networked luminaires to eligible product lists, pushing building owners toward second-generation LED-to-LED upgrades.[1] DesignLights Consortium, “2026 Technical Requirements Update,” designlights.org The Inflation Reduction Act raised the Section 179D write-off to USD 5.00 per square foot for projects that cut lighting energy by at least 25%, effectively lowering payback to under three years for high-CRI mid-power arrays. Warehouses replacing 400 W metal-halide fixtures with 150 W LED high bays report 60% energy savings and better vertical illumination, while the move to occupancy sensing and daylight harvesting increases emitter count per fitting. Higher emitter density boosts package demand even though total luminaire shipments have plateaued, sustaining the United States mid-power LED package market during a mature construction cycle. Regional programs in California and New York add stretch targets on flicker and chromaticity, driving uptake of premium bin grades that carry healthier margins for domestic suppliers.
Increasing LED Penetration In Automotive Exterior Lighting
Federal Motor Vehicle Safety Standard 108 now allows adaptive driving beams nationwide, prompting Ford, General Motors, and Stellantis to roadmap matrix headlamps across 2027 model-year light-trucks.[2]National Highway Traffic Safety Administration, “FMVSS 108 Final Rule,” nhtsa.gov Each module integrates 40-120 individually addressable mid-power LEDs, typically 0.5 W CSPs, that dim exact zones to avoid glare. LG Innotek targets USD 731 million in annual automotive-lighting sales by 2030 on the back of its Nexlide Pixel platform, which has already booked 146 orders spanning 88 vehicle models. Rear lamps are also migrating to segmented LEDs for animation and vehicle-to-vehicle signaling, doubling package counts versus static arrays. Because automakers require AEC-Q102 and 15-year warranties, ASPs remain insulated from the price compression hurting general-lighting grades, sustaining growth in the United States mid-power LED package market.
Growing Use Of Horticultural Lighting By U.S. Vertical Farms
LED arrays delivering 2.7-3.2 µmol J⁻¹ photosynthetically active radiation are replacing HPS lamps, almost doubling efficacy. Ohio-based 80 Acres Farms raised USD 115 million in 2024 and partnered with Signify to deploy mid-power packages that balance bin cost against canopy uniformity. Federal grants under the 2024 Farm Bill earmarked USD 50 million for controlled-environment research, accelerating acreage that refreshes fixtures every three to five years. Modular grow-light bars housing 200-400 emitters per meter let farmers swap spectral recipes without replacing housings, embedding a recurring pull on the United States mid-power LED package market. Concentration of farms in Ohio, Kentucky, and California provides clustering advantages for local assemblers able to offer short lead times and custom phosphor mixes.
Federal Incentives For Domestic Semiconductor Packaging Under CHIPS Act
The CHIPS and Science Act allocates USD 39 billion in grants plus a 25% investment-tax credit for semiconductor packaging, which expressly covers LED back-end processes. Domestic assembly trims lead times from 12-16 to 4-6 weeks, a decisive edge for automotive and aerospace customers that run lean inventories. Combined with average 40% tariffs on Chinese-origin luminaires, subsidies have reduced the landed-cost delta with Asian packages to below 10% for high-mix orders. Ams OSRAM is scouting U.S. sites after expanding its Premstätten plant by EUR 588 million (USD 640 million) in 2024, aiming to qualify for both U.S. and EU incentive stacks. Early subsidy awards in Arizona and Texas are expected to lift domestic capacity by the end of 2027, shifting a segment of the United States mid-power LED package market toward on-shore solutions.
Restraints Impact Analysis*
| Restraint | (~) % Impact on CAGR Forecast | Geographic Relevance | Impact Timeline |
|---|---|---|---|
| Price Erosion Owing to Intense Asian Competition | -0.8% | All U.S. channels | Short term (≤ 2 years) |
| Thermal Management Challenges in Compact Luminaire Designs | -0.4% | High-bay and automotive segments | Medium term (2–4 years) |
| Supply-Chain Risk From Indium and Gallium Price Volatility | -0.5% | High-CRI and automotive-grade packages | Short term (≤ 2 years) |
| Slow Standardization of CSP Reliability Testing Protocols | -0.3% | Municipal and utility tenders | Long term (≥ 4 years) |
| Source: Mordor Intelligence | |||
Price Erosion Owing To Intense Asian Competition
Average selling prices for mid-power packages fell 30-40% in the four years to 2025 as Chinese makers such as Nationstar and Everlight leveraged vertically integrated sapphire and epitaxy lines to push cash costs below USD 0.02 per 0.5 W part. A January 2026 spot hike for gold and copper wire prompted mainland suppliers to lift list prices by up to 10%, offering temporary relief to U.S. vendors, yet the structural cost gap persists. Luminaire OEMs therefore dual-source, procuring commodity SKUs offshore while reserving domestic suppliers for AEC-Q102 or ISO 13485 projects that carry 15-20% price premiums for traceability and custom binning. The tactic keeps margin pressure acute in retrofit channels, restraining the overall United States mid-power LED package market CAGR despite segment-specific tailwinds.
Thermal Management Challenges In Compact Luminaire Designs
Slimmer housings that fit existing junction-box footprints compress the thermal budget, pushing junction temperatures above 85 °C in enclosed high bays, which accelerates phosphor degradation.[3]IEEE Xplore, Weidman C. et al., “Thermal Stress in High-Bay LED Luminaires,” ieeexplore.ieee.org Flip-chip and CSP architectures shorten the thermal path by 40-50%, but tighter pick-and-place tolerances raise assembly cost 8-12% versus traditional SMDs, slowing adoption in price-sensitive projects. Municipalities that require LM-80 and TM-21 data hesitate to specify CSPs because accelerated-stress protocols remain under development. Until the DesignLights Consortium issues finalized guidance, many utility rebate programs omit CSP-based fixtures, limiting volume growth for these higher-margin parts within the United States mid-power LED package market.
*Our forecasts treat driver/restraint impacts as directional, not additive. The impact forecasts reflect baseline growth, mix effects, and variable interactions.
Segment Analysis
By Power Range: Mid-Tier Wattage Remains Retrofit Sweet Spot
The 0.5 W to Less Than 1 W class accounted for 63.19% of 2025 revenue in the United States mid-power LED package market, and it is projected to expand at a 3.88% CAGR through 2031. Industrial facilities swapping 400 W metal-halide fittings for 150 W LED high bays typically use 24-36 of these mid-tier packages to achieve 18,000-22,000 lumens at 160 lm W⁻¹ while maintaining junction temperatures below 75 °C with passive aluminum heat sinks. Horticultural arrays likewise favor this class because distributing photons across a larger emitter count minimizes canopy hotspots and simplifies spectral tuning via driver settings rather than fixture swaps.
Wearables and edge-lit signage rely on 0.2-0.5 W devices, but that slice is expanding more slowly as consumer miniaturization plateaus and automotive designers consolidate ambient modules into fewer mid-power chips to simplify harnessing. Specialty ultraviolet products are nudging power upward as disinfection protocols demand faster dose delivery. Nichia’s 280 nm NCSU434D at 135 mW output exemplifies how once-low-power niches are converging toward mid-range wattages, reinforcing the core position of this class in the United States mid-power LED package industry.


By Package Architecture: CSPs Narrow The Gap With Long-Standing SMDs
Surface-mount devices represented 74.44% of the United States mid-power LED package market share in 2025, anchored by the ubiquitous 2835 footprint. The 3030 format dominates outdoor area and high-bay fixtures where higher drive currents justify the larger thermal pad, whereas 3014 parts for edge-lit LCDs are losing ground to CSPs that deliver thinner modules.
Chip-scale packages, though only one-quarter of shipments, recorded the fastest growth at 4.12% CAGR and are critical for automotive headlamps that demand tight etendue control. Seoul Semiconductor’s WICOP line achieves >200 lm W⁻¹ without wire bonds, yet municipal buyers hesitate absent third-party LM-80 data. The DesignLights Consortium is drafting new reliability tests for CSPs, and once finalized in late 2026, rebate eligibility is expected to unlock latent demand, especially for utility streetlights seeking longer L70 life, supporting broader uptake and higher ASPs across the United States mid-power LED package market size.
By Application: Automotive Lighting Outpaces A Mature General-Lighting Base
General lighting delivered 52.58% revenue in 2025, but its growth is slowing as the commercial retrofit wave moves into re-lamp cycles rather than first-time LED adoption. Automotive lighting, on the other hand, is forecast to post a 3.96% CAGR through 2031, buoyed by adaptive driving beam mandates and dynamic rear signatures. Each matrix headlamp hosts 40-120 mid-power CSPs, and LG Innotek’s CES-award-winning Nexlide Pixel system, already specified in 88 vehicle models, illustrates the volume potential.
MiniLED backlighting is another bright spot, with premium 65-inch TVs integrating 10,000-25,000 mid-power emitters across up to 2,000 dimming zones to rival OLED contrast. Specialty niches horticulture, UV disinfection, medical phototherapy swing on cap-ex cycles but command above-average ASPs owing to custom phosphor mixes and tighter flux bins, providing margin ballast for suppliers navigating the United States mid-power LED package market.

Geography Analysis
California, Texas, and New York remain the heaviest demand centers, thanks to large footprints of distribution centers, tech campuses, and regulated real-estate markets that favor high-spec lighting. Pacific Coast utility programs offer higher per-fixture rebates than the national median, encouraging faster relamp cycles and inflating local share of the United States mid-power LED package market size. Automotive supply chains clustered in Michigan, Tennessee, and South Carolina are leading adoption of CSP-based exterior modules, pulling in high-reliability packages that carry 40-60% premiums over mass-market SKUs.
The Midwest’s concentration of vertical farms, particularly in Ohio and Kentucky, underpins horticultural demand. Local growers prefer short lead times for spectrum-tuned bars, and regional assemblers located within one-day truck range have leveraged this need to win volume formerly sourced from Asia. In the Northeast, New Jersey’s incentives for WELL-standard interiors are sparking tunable-white installations across health-care campuses, adding incremental volume for high-CRI bins.
Sunbelt states such as Arizona and Texas are emerging as capacity hot spots due to CHIPS Act subsidies. New back-end lines are expected online by 2027, and early offtake agreements with defense and aerospace primes suggest that a portion of federal procurement will pivot to U.S.-origin packages. This regional diversification mitigates coastal port risk and constitutes a structural shift in the geographic dispersion of the United States mid-power LED package industry.
Competitive Landscape
The top five vendors ams OSRAM, Nichia, Seoul Semiconductor, Lumileds, and Samsung control major share of revenue, leaving the remainder to dozens of regional specialists and contract manufacturers. Asian incumbents maintain cost leadership in commodity 2835 and 3030 SMDs by integrating epitaxy through final test, selling at price points 20-30% below Western peers. North American and European suppliers defend margin via application engineering, delivering tight binning, AEC-Q102 qualification, and custom optic design.
Mergers and technology licensing shape strategic positioning. Sanan Optoelectronics’ USD 239 million acquisition of Lumileds in August 2025 couples low-cost epitaxy with a mature North American sales channel, lowering chip costs by roughly 30% inside 12 months. Ams OSRAM divested its non-optical sensor arm to Infineon for EUR 570 million (USD 621 million) in February 2026 to fund its Digital Photonics roadmap, including a microLED platform capable of 3 Gb s⁻¹ per lane optical interconnects. These moves signal a pivot toward higher-value adjacencies that share packaging know-how yet escape price compression in lighting.
Barrier to entry is reinforced by the DesignLights Consortium’s qualified-products list. Suppliers must invest in LM-79 and LM-80 testing to gain rebate eligibility that covers three-quarters of U.S. electricity customers. The cost and time to qualify multiple CCT bins effectively shield incumbents from low-volume challengers, sustaining a moderate but durable concentration in the United States mid-power LED package market.
United States Mid-Power LED Package Industry Leaders
ams OSRAM AG
Nichia Corporation
Seoul Semiconductor Co., Ltd.
Lumileds Holding B.V.
Cree LED
- *Disclaimer: Major Players sorted in no particular order

Recent Industry Developments
- March 2026: ams OSRAM unveiled its EVIYOS microLED, hitting 1 GHz modulation and 3 Gb s⁻¹ per lane data rates for AI optical interconnects.
- March 2026: Nichia debuted μPLS and DominoPLS adaptive lighting solutions at Automotive Lighting and Electronics 2026.
- February 2026: LG Innotek showcased Nexlide Pixel at the Munich DVN Workshop, noting 146 orders across 88 vehicle models.
- February 2026: ams OSRAM closed the divestiture of its non-optical sensor business to Infineon for EUR 570 million (USD 621 million).


United States Mid-Power LED Package Market Report Scope
The United States Mid-Power LED Package Market is witnessing significant growth due to increasing demand across various applications such as general lighting, automotive lighting, and display backlighting. The advancements in LED technology, coupled with energy efficiency and cost-effectiveness, are driving the adoption of mid-power LED packages in the country.
The United States Mid-Power LED Package Market Report is Segmented by Power Range (0.2 W to 0.5 W, 0.5 W to Less Than 1 W), Package Architecture (SMD including 2835, 3014, 3030, and Others; CSP), and Application (General Lighting, Automotive Lighting, Display and Backlighting, Specialty and Niche). The Market Forecasts are Provided in Terms of Value (USD).
| 0.2 W – 0.5 W |
| 0.5 W – Less Than 1 W |
| SMD (Surface Mount Device) | 2835 |
| 3014 | |
| 3030 | |
| Others (3528, 3020, 5050 etc.) | |
| CSP (Chip Scale Package) |
| General Lighting |
| Automotive Lighting |
| Display and Backlighting |
| Specialty / Niche |
| By Power Range | 0.2 W – 0.5 W | |
| 0.5 W – Less Than 1 W | ||
| By Package Architecture | SMD (Surface Mount Device) | 2835 |
| 3014 | ||
| 3030 | ||
| Others (3528, 3020, 5050 etc.) | ||
| CSP (Chip Scale Package) | ||
| By Application | General Lighting | |
| Automotive Lighting | ||
| Display and Backlighting | ||
| Specialty / Niche | ||


Key Questions Answered in the Report
What is the 2026 value of the United States mid-power LED package market?
It is valued at USD 1.25 billion in 2026.
How fast will the market grow between 2026 and 2031?
The CAGR is forecast at 3.16% over the period.
Which power class held the highest share in 2025?
The 0.5 W to <1 W segment captured 63.19% revenue in 2025.
Why are chip-scale packages gaining traction?
CSPs cut thermal resistance by up to 50%, meeting the needs of automotive and miniLED backlighting applications.
How is the CHIPS Act influencing supply chains?
Grants and a 25% tax credit are reducing landed costs and encouraging new U.S. packaging lines that shorten lead times to 4–6 weeks.
Page last updated on:


