United States Fencing Market Size and Share
Market Overview
| Study Period | 2020 - 2031 |
|---|---|
| Forecast Data Period | 2026 - 2031 |
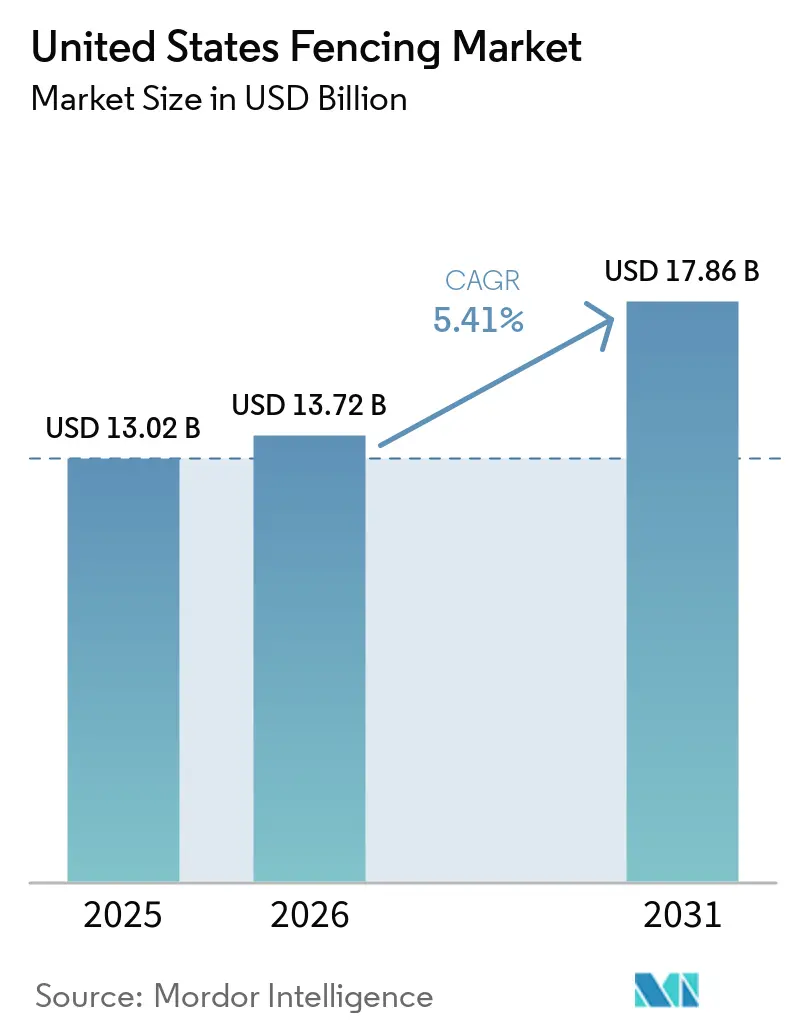
| Base Year Market Size (2025) | USD 13.02 Billion |
| Market Size (2026) | USD 13.72 Billion |
| Market Size (2031) | USD 17.86 Billion |
| Growth Rate (2026 - 2031) | 5.41% CAGR |
| Market Concentration | Low |
Major Players *Disclaimer: Major Players sorted in no particular order Image © Mordor Intelligence. Reuse requires attribution under CC BY 4.0. | |
United States Fencing Market Analysis by Mordor Intelligence
The United States Fencing Market size is expected to grow from USD 13.02 billion in 2025 to USD 13.72 billion in 2026 and is forecast to reach USD 17.86 billion by 2031 at 5.41% CAGR over 2026-2031.
Growth in the United States fencing market is being supported by steady residential expansion in suburban Sun Belt locations, where fencing remains a standard part of new home delivery and replacement demand. Public spending also adds a durable layer of demand, as Department of Homeland Security and U.S. Customs and Border Protection smart barrier awards are supporting large steel fabrication and installation programs that are less tied to housing cycles. Material preference is also shifting, as homeowners and commercial buyers are moving toward composite, polymer, and coated metal systems that reduce maintenance and improve lifecycle value. The United States fencing market is also being reshaped by distributor and installer consolidation, while tariff-led metal inflation, labor shortages, and local zoning limits continue to pressure project timing and pricing.
Key Report Takeaways
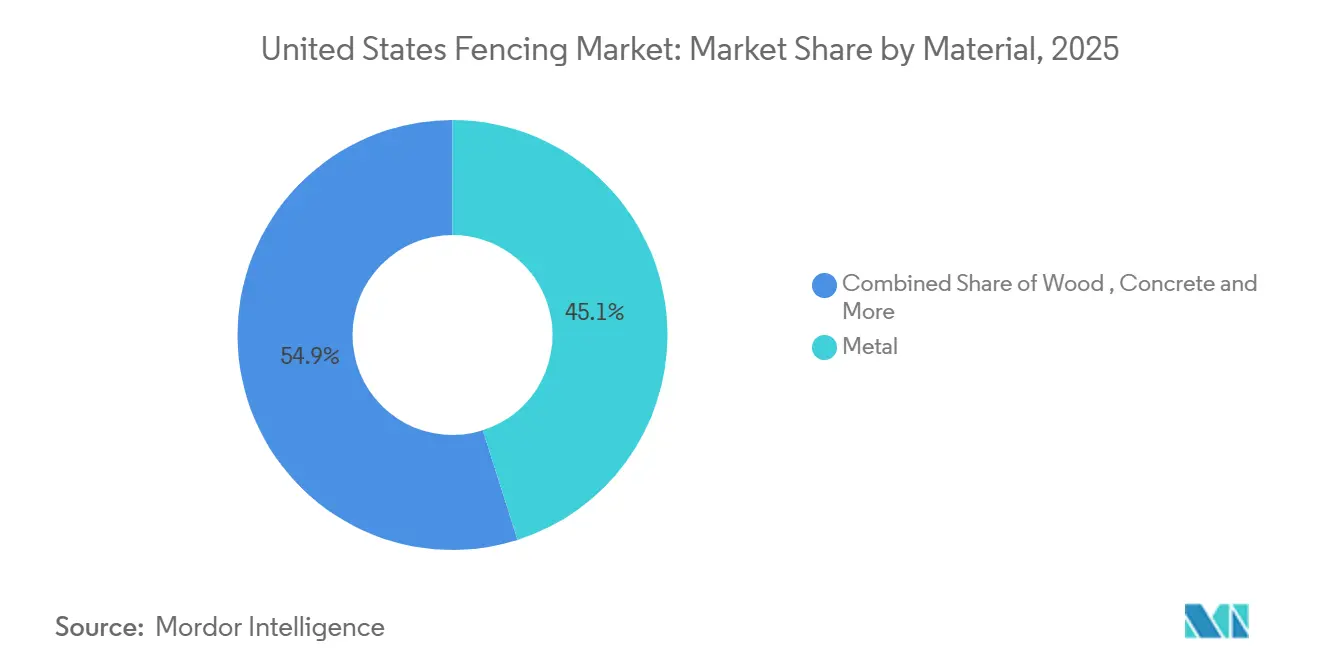
- By material, metal led with 45.1% of the United States fencing market share in 2025, while plastic and composite recorded the highest projected CAGR at 6.21% through 2031.
- By end-user, residential accounted for 38.7% share of the United States fencing market size in 2025, while agricultural is forecast to expand at 6.34% CAGR through 2031.
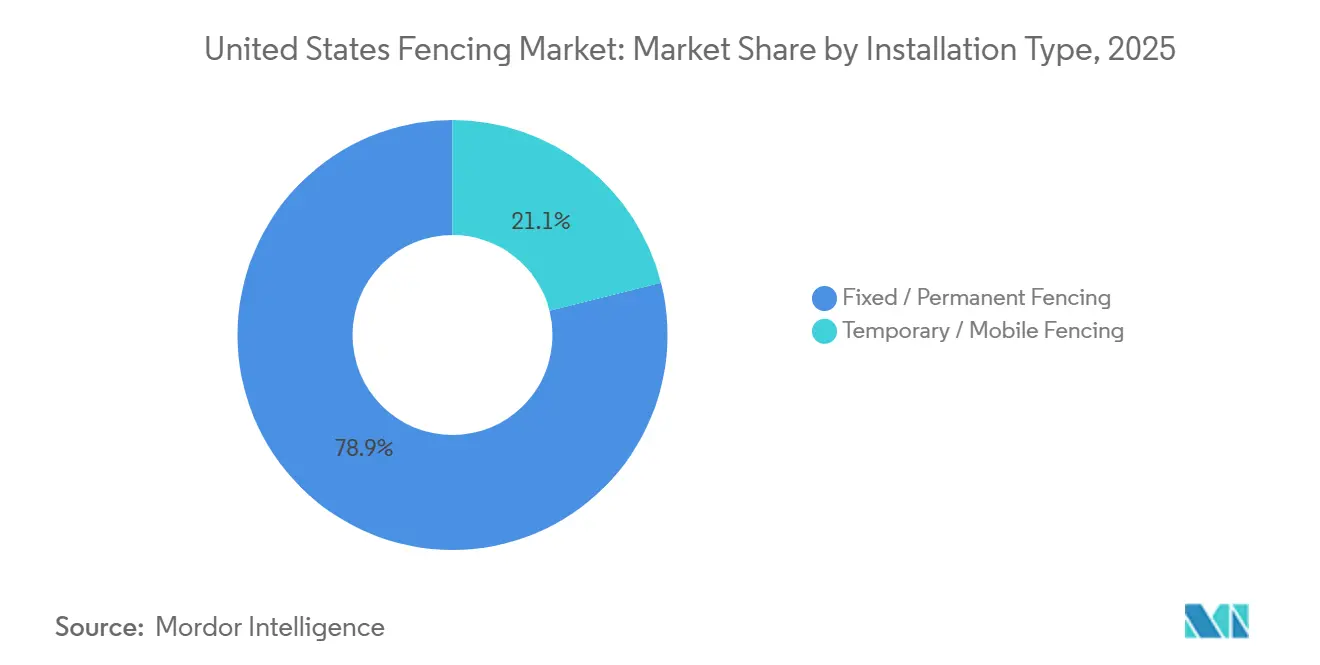
- By installation type, fixed or permanent fencing held 78.9% of market revenues in 2025, while temporary and mobile fencing is projected to advance at 5.87% CAGR through 2031.
- By installation channel, professional contractors held 62.3% of the United States fencing market share in 2025, while DIY and modular kit formats recorded the highest projected CAGR at 5.94% through 2031.
- By state, Texas captured 14.4% of the United States fencing market size in 2025, while Florida is projected to grow at 6.49% CAGR through 2031.
Note: Market size and forecast figures in this report are generated using Mordor Intelligence’s proprietary estimation framework, updated with the latest available data and insights as of January 2026.
United States Fencing Market Trends and Insights
Drivers Impact Analysis*
| Drivers | (~) % IMPACT ON CAGR FORECAST | Geographic Relevance | Impact Timeline |
|---|---|---|---|
| Increasing demand for residential privacy and security fencing across suburban housing developments | +1.60% | National, with concentrated gains in Texas, Florida, and the Carolinas | Medium term (2-4 years) |
| Growth in commercial and industrial construction driving perimeter security fencing adoption | +1.20% | National, with early gains in Sun Belt states and Midwest industrial corridors | Medium term (2-4 years) |
| Rising demand for automated and smart fencing systems in high-security applications | +0.70% | National, with concentrated deployments in Southwest border states and data center hubs | Long term (≥ 4 years) |
| Increasing cross-border migration from neighboring countries driving demand for border security fencing infrastructure | +0.60% | Southwest border states, including Texas, Arizona, New Mexico, and California, with policy-driven procurement spillover to national steel fabrication networks | Short term (≤ 2 years) |
| Growing agricultural fencing needs for livestock management and land protection | +0.40% | Central and Southern United States, including Texas, Oklahoma, Nebraska, and Kansas | Medium term (2-4 years) |
| Increasing focus on wildlife conservation and highway safety driving installation of wildlife fencing | +0.20% | Western and Southern United States, including Idaho, Oregon, Nevada, Florida, and North Carolina | Short term (≤ 2 years) |
| Source: Mordor Intelligence | |||
Increasing Demand for Residential Privacy and Security Fencing Across Suburban Housing Developments
Suburban growth across Sun Belt states has created a durable base of demand for residential fencing in the United States. New single-family communities in areas such as Dallas-Fort Worth, Phoenix, and Tampa often include fencing as standard with the property rather than an optional add-on. Hybrid work patterns have also kept attention on backyard use, which supports both first-time installations and replacement demand in established neighborhoods. Homeowners are moving toward vinyl, composite, and powder-coated aluminum because long-term upkeep matters more than initial purchase price in many projects. Homeowner association rules in fast-growing communities also steer buyers toward approved designs and certified suppliers, which supports higher-value installations and steadier margins.
Growth in Commercial and Industrial Construction Driving Perimeter Security Fencing Adoption
Commercial and industrial construction pipelines continued to support perimeter security demand entering 2026 in the United States fencing market. Logistics sites, data centers, energy assets, and manufacturing facilities all require fencing that can handle higher security standards than standard residential systems. This is lifting demand for anti-climb steel panels, welded mesh, crash-rated barriers, and integrated gate systems across nonresidential projects. Solar farms, battery storage locations, and electric vehicle charging sites are adding another layer of site-specific perimeter demand, especially where owners want both physical protection and controlled access. As project scopes become more complex, fencing suppliers are being pushed toward bundled products that combine barriers, access points, and monitoring features.
Rising Demand for Automated and Smart Fencing Systems in High-Security Applications
Automated and smart fencing is becoming increasingly important in the United States fencing market, where end users include government, military, utilities, and critical infrastructure. The Department of Homeland Security and U.S. Customs and Border Protection awarded USD 4.5 billion in Smart Wall contracts in September 2025, and the One Big Beautiful Bill Act provided an additional USD 46.5 billion for construction and maintenance through 2029[1]U.S. Customs and Border Protection, “DHS, CBP Award USD 4.5 billion in New Contracts Under OBBB for Smart Wall Construction,” U.S. Customs and Border Protection, cbp.gov. These projects combine steel barriers with patrol roads, lighting, cameras, and detection systems, which raises the value of each installed mile. Commercial buyers are also adopting perimeter systems that connect fencing with sensors, surveillance, and controlled entry. This shift favors suppliers that can manage both structural fabrication and system integration, while making it harder for commodity-only vendors to compete in premium projects.
Increasing Cross-Border Migration from Neighboring Countries Driving Demand for Border Security Fencing Infrastructure
Sustained migration pressure along the U.S.-Mexico border through fiscal year 2024 created strong political support for higher spending on border fencing and related infrastructure[2]U.S. Customs and Border Protection, “Southwest Land Border Encounters,” U.S. Customs and Border Protection, cbp.gov. U.S. Border Patrol recorded 140,641 illegal alien apprehensions at the southwest border in February 2024 alone, which helped shape the case for a much larger federal response. The One Big Beautiful Bill Act, signed in July 2025, allocated USD 46.55 billion for border barrier construction and wall system features, making it the largest border infrastructure funding package in the country’s history. That commitment covers 701 miles of primary wall, 900 miles of river barriers, and 629 miles of secondary barriers, which creates a long project pipeline for steel bollards, access roads, and related fencing work through the end of the decade. It also supports demand for temporary products such as concertina wire, razor wire, and chain-link fencing, since these systems are often deployed before permanent barriers are completed. Even though southwest border encounters fell sharply by February 2025, the approved funding means procurement activity is likely to stay elevated through 2029.
Restraints Impact Analysis*
| Restraints | (~) % IMPACT ON CAGR FORECAST | Geographic Relevance | Impact Timeline |
|---|---|---|---|
| High Labor and Installation Costs | -0.5% | National, with acute pressure in urban Northeast and Pacific Coast markets | Medium term (2-4 years) |
| Raw Material Price Volatility in Steel, Aluminum, And Wood | -0.4% | National, particularly affecting metal-intensive fabricators in the Midwest and South | Short term (≤ 2 years) |
| Strict Zoning Laws and Local Restrictions on Fence Installations | -0.2% | Urban Northeast, California, and homeowner association-governed Sun Belt communities. | Long term (≥ 4 years) |
| Source: Mordor Intelligence | |||
High Labor and Installation Costs Increasing Overall Fencing Project Expenses
Labor availability remains a major operating challenge across the United States fencing market. Fence installation still depends heavily on skilled crews for post setting, alignment, gate placement, and finish work, especially in permanent systems. When trained crews are scarce, installers can extend lead times and bid at higher labor rates, which pushes up total project costs across residential, commercial, and agricultural jobs. That cost pressure is encouraging more interest in modular panels and pre-assembled gate units that reduce on-site work time. It also supports consolidation, as larger contractors with better crew access can take on projects that smaller local firms may struggle to staff.
Fluctuating Prices of Raw Materials Such as Steel, Aluminum, and Wood Impacting Product Costs
Raw material volatility remains one of the most direct restraints on the United States fencing market. The Associated General Contractors of America reported that aluminum mill shape prices rose 33.0% year over year through January 2026, while steel mill product prices climbed 20.7% over the same period[3]Associated General Contractors of America, “Double-Digit Increases in Aluminum, Steel and Copper Costs Drive Producer Price Indexes for Construction,” Associated General Contractors of America, agc.org. These increases make it harder for fence fabricators to price long-cycle contracts, particularly when bid terms are fixed, and margin buffers are thin. Smaller regional manufacturers are more exposed because they have fewer options for hedging, contract escalation clauses, or purchasing leverage. Wood pricing has been less extreme than in prior peak periods, but it still adds uncertainty for budget-sensitive buyers who closely compare upfront costs.
*Our forecasts treat driver/restraint impacts as directional, not additive. The impact forecasts reflect baseline growth, mix effects, and variable interactions.
Segment Analysis
By Material: Composite Gains Ground on Entrenched Metal Dominance
Metal fencing held 45.1% of the United States fencing market share in 2025, maintaining its leading position across material categories. That lead reflects strong demand from industrial perimeter, military, and government applications where strength, anti-climb performance, and crash resistance carry more weight than decorative value. Steel remains the primary material for agricultural and industrial work, while aluminum is more commonly used in residential and light commercial projects that require lower maintenance and cleaner finishes. Plastic and composite fencing is the fastest-growing material segment, with a projected 6.21% CAGR through 2031, as more buyers move away from wood toward materials with lower lifecycle maintenance costs.
Composite suppliers are using product longevity and premium positioning to widen their role in the United States fencing industry. Trex highlighted its outdoor living portfolio and reinforced the long-life positioning of composite products at the 2026 International Builders' Show, which supports the appeal of composite fencing in higher-value residential projects. Wood still holds a place in budget residential and rural installations because its upfront cost stays lower, and many homeowners can handle simpler installation work themselves. Concrete remains a niche option for applications such as noise barriers and high-security perimeters. In contrast, other materials, such as recycled polymer mesh and bamboo, remain limited to small, sustainability-focused pockets. The main change in this segment is not the disappearance of metal, but rather the steady shift in premium toward coated, composite, and longer-life products.


By End-User: Residential Demand Holds the Revenue Base While Agriculture Expands Faster
Residential end users accounted for 38.7% of the United States fencing market in 2025, making housing-related demand the largest end-use segment. This position reflects the direct link between single-family housing turnover, suburban construction, privacy upgrades, and backyard improvement spending. Many new homeowners install fencing soon after purchase, while established households continue to replace aging systems as part of outdoor renovation programs. Agricultural fencing is the fastest-growing end-use segment, with a 6.34% CAGR through 2031, supported by conservation-linked installation support and by wider use of smart electric fencing across large-acreage livestock operations.
The agricultural push matters because it broadens the United States fencing market beyond consumer-led demand. The U.S. Department of Agriculture reported a cattle inventory of 94.4 million head in 2024, indicating a large installed base of fencing across livestock operations and a recurring need for repair and replacement. Military and defense users remain important premium buyers because they require crash-rated barriers, taller anti-climb panels, and integrated monitoring systems. Government, mining, petroleum and chemicals, and energy and power users add another layer of non-discretionary demand because fencing in those settings is tied to safety and asset protection rather than appearance. This spread of end users helps the United States fencing industry remain more resilient than markets tied to a single construction category.
By Installation Type: Permanent Systems Dominate While Temporary Rentals Gain Speed
Fixed or permanent fencing accounted for 78.9% of the United States fencing market size in 2025, reflecting the long service life expected across residential, agricultural, industrial, and public installations. Buyers in this category usually specify systems for use over many years, which supports slower but more predictable replacement cycles. Permanent fencing also remains the core of manufacturer and contractor revenue because these projects often involve heavier materials, deeper installation work, and higher labor content. Temporary and mobile fencing is the fastest-growing installation type, at a 5.87% CAGR through 2031, supported by construction sites, event operations, emergency response needs, and short-term perimeter rental programs.
The faster rise of temporary systems does not weaken the permanent side of the United States fencing market. In many cases, the same construction project needs temporary fencing during site work and permanent fencing once the asset is complete. That creates a cross-sell path for integrated installers that can handle both phases within a single customer relationship. Perimeter Solutions Group has been building that broader platform through repeated acquisitions, including its January 2026 move into Southern California through Econo Fence. Safety rules on commercial and infrastructure sites also keep temporary fencing partly non-discretionary, which supports utilization even when discretionary event demand softens.
By Installation Channel: Contractors Lead the Market While DIY Keeps Expanding
Professional contractors retained 62.3% of installation revenues in 2025, confirming that labor skills remain central to the United States fencing market. Many fence jobs still require surveying, post setting, concrete work, gate alignment, and finish adjustments that are difficult to standardize for inexperienced buyers. Contractor-led installation also remains the default for commercial and industrial work because projects often require insurance, certified performance, and schedule coordination with broader site construction. DIY and modular kit formats are the fastest-growing channel, with a 5.94% CAGR through 2031, supported by e-commerce access, pre-cut components, and step-by-step installation guidance.
The United States fencing market is not seeing a full shift away from contractors, but it is seeing a clearer separation between simple and complex project types. Flat-lot residential privacy projects are more likely to move toward DIY kits, especially in vinyl and composite panel systems with simplified assembly. Master Halco remains a strong example of the contractor-led structure, operating through a broad distribution footprint that serves contractors, dealers, and retailers across North America. Commercial jobs, curved terrain, specialty gates, and high-security specifications continue to favor professional installers because the risk of poor installation is higher and the work scope is harder to simplify. This means channel growth is expanding choice rather than replacing the contractor base.
Geography Analysis
Texas accounted for 14.4% of the United States' fencing market in 2025, making it the largest contributor. Its demand base is broad because it combines ranch and livestock fencing, suburban residential growth, Gulf Coast industrial security work, and border infrastructure activity. Residential expansion around Houston, Austin, Dallas, and San Antonio supports both new installations and replacement demand. Oil, gas, and petrochemical assets along the Gulf Coast also sustain higher-value security fencing contracts than standard residential projects. U.S. Customs and Border Protection added to this demand with a USD 70,285,846 contract for around 7 miles of border wall in Hidalgo County in March 2025.
Florida is the fastest-growing state market in the United States fencing market, with a projected 6.49% CAGR through 2031. Population inflows, steady homebuilding, and storm-related property improvement cycles are keeping residential demand firm across the state. California follows a different pattern, with more activity tied to replacement demand, code-driven material choice, and premium low-maintenance systems in dense residential and commercial settings. New York and Illinois remain more weighted toward institutional, transit, logistics, and industrial perimeter requirements than toward broad new-home fence construction.
The rest of the country provides the United States with a wide and resilient demand profile for the fencing market. Western states continue to benefit from wildlife safety and corridor programs, while Plains states maintain steady agricultural replacement demand across ranch and livestock operations. Arizona began work in April 2025 on an Interstate 17 wildlife overpass project that includes more than 8 miles of wildlife fencing, demonstrating how transportation safety projects can create specialized public demand. Utah also received funding in January 2025 for 23 miles of new wildlife fencing along U.S. 40, which reinforces the same theme across western corridors. The Southeast outside Texas and Florida continues to see residential and commercial demand driven by expanding metro areas such as Charlotte, Nashville, and Atlanta. This geographic spread helps the United States' fencing market absorb local slowdowns, as growth drivers differ from one region to another.
Competitive Landscape
The United States fencing market remains fragmented, with large national distributors and integrated manufacturers competing alongside many regional fabricators and local installers. The biggest change is happening at the top of the market, where scale is becoming more important in product breadth, distribution reach, and customer coverage. In January 2025, Oldcastle APG brought seven legacy brands under the Catalyst Fence Solutions name, including Barrette Outdoor Living, ActiveYards, Bufftech, and SimTek, creating a larger platform across vinyl, aluminum, steel, and composite fencing in North America. This move strengthened its position in residential and light commercial channels, where product availability, dealer relationships, and brand recognition matter as much as price.
Consolidation is also moving quickly in installation and perimeter services. Perimeter Solutions Group, or PSG, added Econo Fence in January 2026, marking its ninth acquisition since 2021 and extending its commercial and industrial presence in Southern California. PSG is building a broader national platform that covers permanent and temporary fencing, gate fabrication, bollards, and access control, making it better placed to serve multi-site customers who want a single provider across regions. This is creating a clearer split in the market, where national platforms compete on scale and service range. At the same time, regional specialists continue to win on local relationships, faster response times, and custom fabrication.
Competition is also shifting toward premium materials and technology-linked perimeter systems. Suppliers are moving beyond standard chain-link by offering composite fencing, modular systems, gate hardware, and products compatible with cameras, sensors, and controlled-entry systems. Trex continued to strengthen its premium composite positioning through its broader outdoor product push. At the same time, Master Halco expanded product availability through its vinyl profile distribution partnership with ESC Vinyl Pile, effective from April 2025. Gatemaster’s entry into the American Fence Association in April 2026 also points to growing interest in expanding gate hardware distribution through contractor networks. Smaller companies still have room to compete, especially in specialized areas such as crash-rated barriers, agricultural smart fencing, and wildlife exclusion systems, where technical requirements are higher, and pricing pressure is less severe.
United States Fencing Industry Leaders
Catalyst Fence Solutions
Master Halco
Ameristar Perimeter Security
Bekaert Fencing
Allied Tube & Conduit
- *Disclaimer: Major Players sorted in no particular order

Recent Industry Developments
- January 2026: Perimeter Solutions Group (PSG), a Bertram Capital portfolio company and national commercial and industrial perimeter security provider, acquired Econo Fence, a California-based market leader in commercial and industrial fencing established in 1977. The acquisition marked PSG's ninth since 2021 and its fourth since partnering with Bertram Capital in October 2024, expanding PSG's footprint to 12 physical locations across the United States and extending its integrated perimeter platform into the Southern California market.
- October 2025: Department of Homeland Security and U.S. Customs and Border Protection awarded 10 new Smart Wall construction contracts totaling USD 4.5 billion, covering 230 miles of new steel barriers and nearly 400 miles of advanced surveillance technology deployments across the San Diego, El Centro, Yuma, Tucson, El Paso, Del Rio, and Rio Grande Valley sectors. Major contractors included BCCG Joint Venture and Fisher Sand & Gravel Co., and environmental waivers were issued for sections in California and New Mexico to expedite construction.
- July 2025: The One Big Beautiful Bill Act, signed into law on July 4, 2025, allocated USD 46.5 billion through U.S. Customs and Border Protection for Smart Wall construction and maintenance through 2029, targeting 700 additional miles of border wall, 900 miles of river barriers, and 630 miles of secondary walls. The scale of this authorization created a multi-year pipeline for steel fencing fabrication and installation, directly affecting border-state contractors and national steel conduit manufacturers.
- June 2025: Department of Homeland Security issued three waivers to expedite construction of around 36 miles of new border wall across the El Paso, Tucson, and Yuma sectors in Arizona and New Mexico, supplementing an earlier April 2025 waiver for California's San Diego sector. These waivers were issued under Section 102 of the Illegal Immigration Reform and Immigrant Responsibility Act of 1996 to accelerate physical barrier and access road delivery.


United States Fencing Market Report Scope
| Metal | Steel |
| Aluminium | |
| Wood | |
| Plastic & Composite | |
| Concrete | |
| Other Materials |
| Residential |
| Agricultural |
| Military & Defense |
| Government |
| Mining |
| Petroleum & Chemicals |
| Energy & Power |
| Other End-Users |
| Fixed / Permanent Fencing |
| Temporary / Mobile Fencing |
| Professional Contractor |
| Others – Fabricators, DIY / Modular Kits |
| Texas |
| California |
| Florida |
| New York |
| Illinois |
| Rest of US |
| By Material | Metal | Steel |
| Aluminium | ||
| Wood | ||
| Plastic & Composite | ||
| Concrete | ||
| Other Materials | ||
| By End-User | Residential | |
| Agricultural | ||
| Military & Defense | ||
| Government | ||
| Mining | ||
| Petroleum & Chemicals | ||
| Energy & Power | ||
| Other End-Users | ||
| By Installation Type | Fixed / Permanent Fencing | |
| Temporary / Mobile Fencing | ||
| By Installation Channel | Professional Contractor | |
| Others – Fabricators, DIY / Modular Kits | ||
| By State | Texas | |
| California | ||
| Florida | ||
| New York | ||
| Illinois | ||
| Rest of US |


Key Questions Answered in the Report
What is the 2026 to 2031 growth outlook for fencing demand in the United States?
The United States fencing market is projected to grow from USD 13.72 billion in 2026 to USD 17.86 billion by 2031 at a 5.41% CAGR, supported by residential growth, public infrastructure work, and material upgrades.
Which material category leads current revenue, and which one is growing fastest?
Metal led with 45.1% of revenue in 2025, while plastic and composite are projected to record the fastest growth at a 6.21% CAGR through 2031.
Why is residential demand still the largest part of fencing spending?
Residential accounted for 38.7% of 2025 revenue because suburban homebuilding, home turnover, privacy needs, and outdoor improvement spending continue to support both new installations and replacements.
What is driving faster growth in agricultural fencing?
Agricultural demand is projected to grow at a 6.34% CAGR through 2031, driven by rotational grazing programs, livestock management needs, and the wider adoption of solar-powered smart electric fencing.
Which states matter most for current and future demand?
Texas was the largest state market, accounting for 14.4% of 2025 revenue, while Florida is forecast to grow the fastest at a 6.49% CAGR through 2031.
How is competition changing among suppliers and installers?
Competition is shifting toward larger multi-state platforms and broader product portfolios, as shown by Catalyst Fence Solutions launch and Perimeter Solutions Group's acquisition program. At the same time, regional firms still compete through local service and custom work.
Page last updated on:


