South Africa Fencing Market Size and Share
Market Overview
| Study Period | 2020 - 2031 |
|---|---|
| Forecast Data Period | 2026 - 2031 |
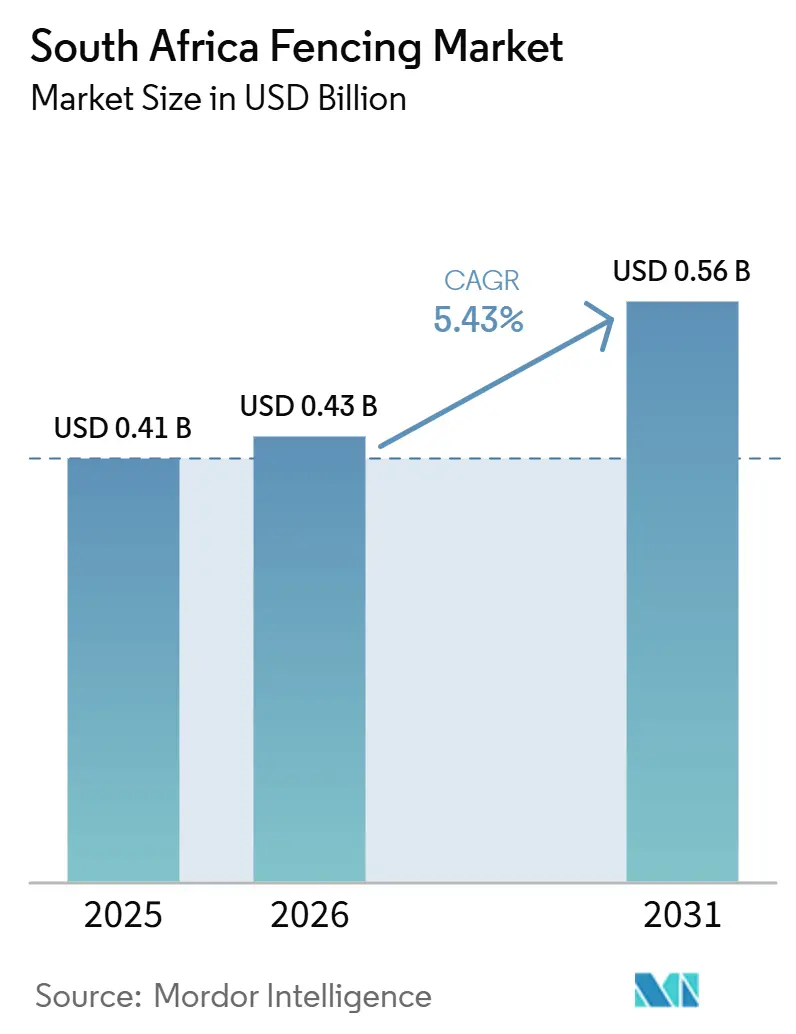
| Base Year Market Size (2025) | USD 0.41 Billion |
| Market Size (2026) | USD 0.43 Billion |
| Market Size (2031) | USD 0.56 Billion |
| Growth Rate (2026 - 2031) | 5.43% CAGR |
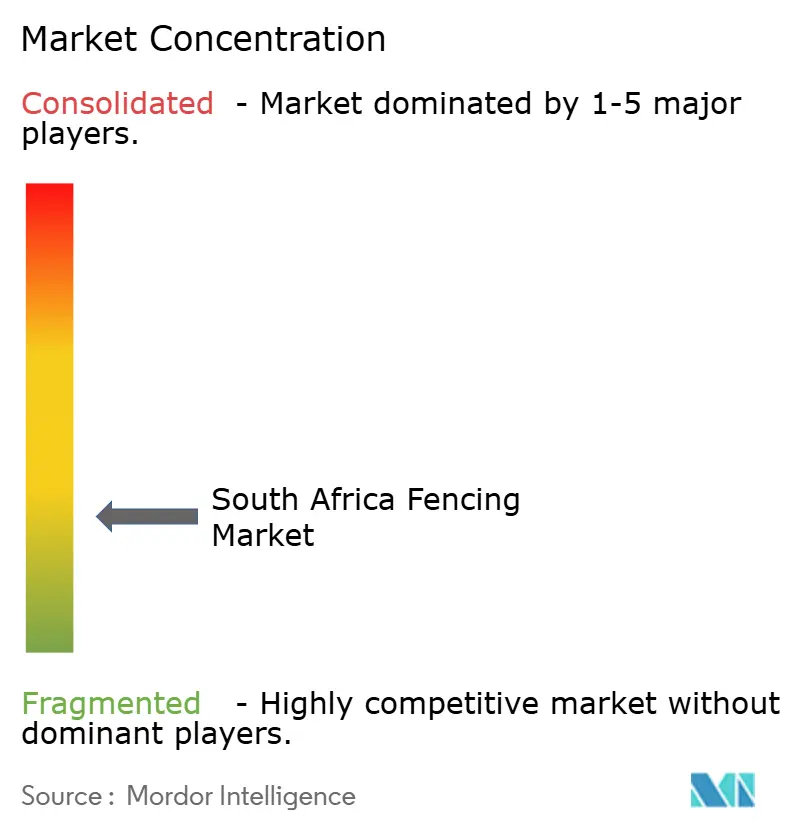
| Market Concentration | Low |
Major Players *Disclaimer: Major Players sorted in no particular order Image © Mordor Intelligence. Reuse requires attribution under CC BY 4.0. | |
South Africa Fencing Market Analysis by Mordor Intelligence
The South Africa Fencing Market size is expected to increase from USD 0.41 billion in 2025 to USD 0.43 billion in 2026 and reach USD 0.56 billion by 2031, growing at a CAGR of 5.43% over 2026-2031.
The South Africa fencing market is being shaped by persistent urban insecurity, which has moved perimeter protection from a discretionary purchase into a basic requirement across residential, commercial, and industrial assets. Demand in the South Africa fencing market also rests on a large private security base, with more than 9,440 registered firms and over 450,000 active security personnel supporting a layered security model in which fencing remains the first physical barrier. A retrofit cycle across aging electric fence systems is adding recurring work in metro residential and commercial properties where older installations no longer meet current compliance expectations, which gives the South Africa fencing market a second revenue stream beyond new builds. The South Africa fencing market is also developing a clearer split between commodity fencing under import price pressure and specification-grade contracts tied to national key point security, local content rules, and certified installation standards. Solar-powered electric fencing is strengthening that higher-value tier by serving both perimeter security and resilience during load-shedding, thereby improving the revenue outlook for suppliers positioned above the lowest-cost segment.
Key Report Takeaways
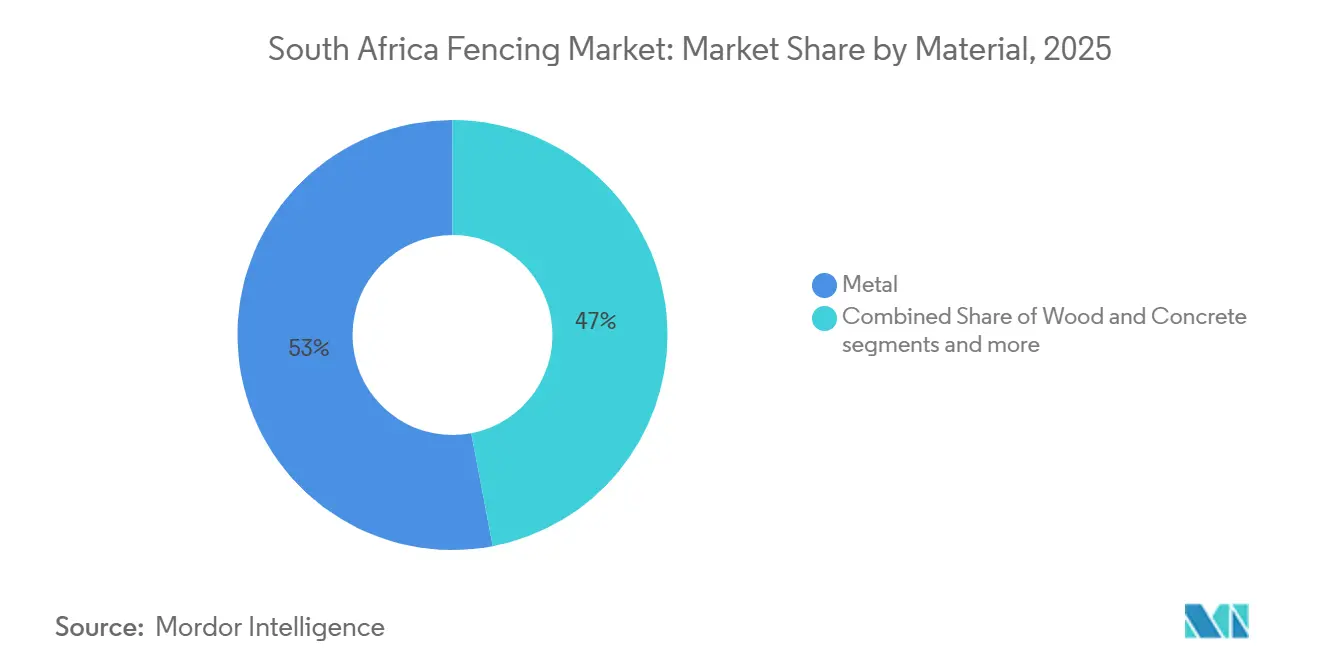
- By material, metal held a 53% share of revenue in 2025, while plastic & composite is forecast to expand at a 6.3% CAGR through 2031 in the South Africa fencing market.
- By end user, residential accounted for 63% of revenue in 2025, while energy & power is projected to record the fastest CAGR of 7.1% through 2031.
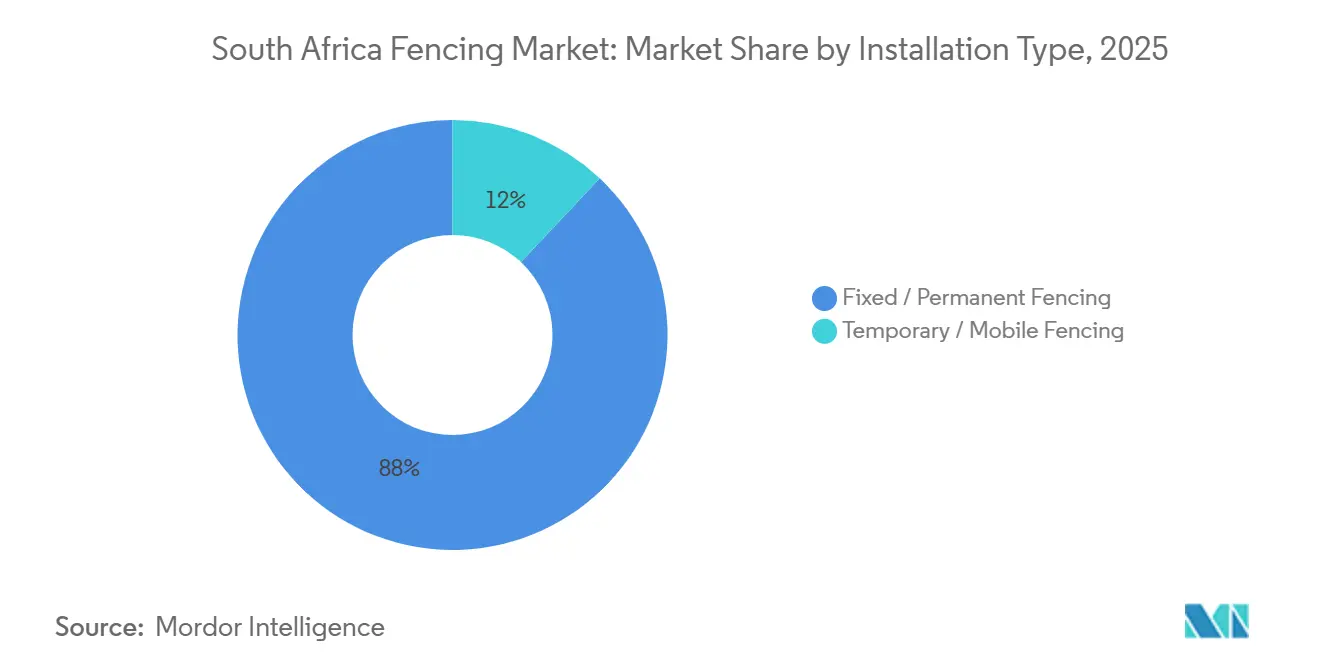
- By installation type, fixed / permanent fencing accounted for 88% of the South Africa fencing market size revenue in 2025, while temporary/mobile fencing is expected to grow at a 6.7% CAGR through 2031.
- By installation channel, professional contractors accounted for 74% share of the South Africa fencing market in 2025, while the others segment (fabricators, DIY / modular kits) is forecast to advance at a 6.1% CAGR through 2031.
- By geography, Johannesburg accounted for 31% of revenue in 2025, while the Rest of South Africa is forecast to grow at a 5.9% CAGR through 2031.
Note: Market size and forecast figures in this report are generated using Mordor Intelligence’s proprietary estimation framework, updated with the latest available data and insights as of January 2026.
South Africa Fencing Market Trends and Insights
Drivers Impact Analysis*
| Drivers | (~) % Impact on CAGR Forecast | Geographic Relevance | Impact Timeline |
|---|---|---|---|
| Security and Perimeter Hardening Across Residential and Commercial Properties | +1.2% | National, with peak intensity in Gauteng and KwaZulu-Natal | Short term (≤ 2 years) |
| Construction, Warehousing, and Logistics Expansion Drives Industrial Installations | +0.9% | Gauteng, KwaZulu-Natal, Western Cape | Medium term (2-4 years) |
| Critical Infrastructure Hardening in Mining, Energy, and Transport | +0.8% | National, concentrated in Limpopo, Mpumalanga, and Western Cape | Medium term (2-4 years) |
| Agricultural and Game-Farm Boundary Protection Boosts Rural Demand | +0.7% | Mpumalanga, Limpopo, Northern Cape, Rest of South Africa | Medium term (2-4 years) |
| Insurance-Driven Security Upgrades for Compliant Electric Fencing Systems | +0.6% | National, concentrated in metro areas and high-value residential estates | Short term (≤ 2 years) |
| Solar-Ready Low-Maintenance Fencing for Remote and Load-Shedding-Prone Sites | +0.5% | Northern Cape, Karoo, Eastern Cape, secondary cities off main grid corridors | Long term (≥ 4 years) |
| Source: Mordor Intelligence | |||
Security and Perimeter Hardening Across Residential and Commercial Properties
Physical perimeter hardening remains the main demand lever in the South Africa fencing market because buyers now treat fencing as part of risk pricing rather than a discretionary property upgrade[1]Germany Trade and Invest, “Sicherheitstechnik in Südafrika Immer Gefragter,” Germany Trade and Invest, gtai.de. South Africa’s crime burden costs the economy at least 10% of GDP annually, and that burden flows into underwriting decisions tied to perimeter compliance and property risk. Anti-climb clearview mesh and 358-profile panels are now standard specifications for estates, commercial parks, logistics depots, schools, data centers, correctional facilities, and lifestyle estates across southern Africa. The demand pattern reinforces itself because each new gated development or security upgrade raises the deterrence threshold for nearby properties that have not yet upgraded, which keeps the South Africa fencing market active in established suburbs as well as new sites. With more than 450,000 active registered security officers working through over 9,440 firms, fencing continues to serve as the base layer in a security stack that electronic tools alone do not replace.
Construction, Warehousing, and Logistics Expansion Drives Industrial Installations
Industrial property delivered a 15.2% total return in the 12 months to December 2024, and industrial rental rates rose 7.3% year on year in the first quarter of 2025, which supported more fenced industrial development in the South Africa fencing market. Logistics vacancies dropped to 0.3% by October 31, 2025, while 76,550 square meters of warehousing were under construction for delivery in 2026, indicating a firm near-term project pipeline for perimeter installation. Each new warehouse footprint requires external perimeter fencing, internal zoning barriers, and electrified deterrence layers, so construction momentum converts directly into fencing demand. The timing matters because industrial fencing typically leads occupancy by 3 to 6 months, which means much of the contracted pipeline is already producing purchase orders in the South Africa fencing market.
Critical Infrastructure Hardening in Mining, Energy, and Transport
Mining, energy, and transport sites are driving a high-specification segment of the South African fencing market, as perimeter threats have become more frequent and costly. Mining companies are responding to illegal mining, cable theft, and vandalism by combining anti-cut and anti-climb fence systems with thermal cameras, radar, and video monitoring rather than relying on standalone fencing. Eskom’s 2025 and 2026 tender activity shows the same pattern because Matimba Power Station and the Mooinooi Concentrator North Complex (CNC) facility require high-grade mesh systems with local content and compliance conditions that push buyers away from basic imported options. Transnet Engineering’s Swartkops depot tender followed the same logic, specifying a 3-kilometer ClearVu perimeter fence, a 30-strand electric overlay, compliance with South African National Standards (SANS), and full CCTV intrusion detection within a 6-month delivery window. This creates a protected sub-market within the South Africa fencing market where procurement rules and performance demands matter more than commodity price competition.
Agricultural and Game-Farm Boundary Protection Boosts Rural Demand
In South Africa, the fencing market is experiencing a surge, driven primarily by the need for boundary protection on farms and game farms. This trend is especially pronounced in rural provinces, where farming and wildlife activities are prevalent. Concerns over livestock security, crop protection, land demarcation, and wildlife containment are driving demand for robust perimeter fencing. As a result, solutions like high-tensile wire fencing, electric fencing, and predator-resistant barriers are becoming increasingly popular. Farm owners are turning to these options not only to deter theft and prevent animal intrusions, but also to comply with wildlife management protocols. Provinces such as Mpumalanga, Limpopo, and the Northern Cape are at the forefront of this demand. These regions are home to expansive cattle farming operations, a booming wildlife tourism sector, and numerous private conservation estates. Furthermore, as eco-tourism flourishes and investments in game reserves rise, there's a notable increase in the installation of high-security, electrified fencing systems. These systems are pivotal for managing wildlife movement and bolstering anti-poaching efforts. Looking ahead, as investments in agricultural infrastructure and rural land security continue, the demand for fencing solutions is poised to remain robust in South Africa's rural and semi-rural locales.
Restraints Impact Analysis*
| Restraint | (~) % Impact on CAGR Forecast | Geographic Relevance | Impact Timeline |
|---|---|---|---|
| Steel and Coating Price Volatility Pressures Manufacturing Costs | -0.6% | National, with greater impact on Gauteng and KwaZulu-Natal manufacturers | Medium term (2-4 years) |
| Low-Cost Fabricators and Imports Intensify Pricing Competition | -0.5% | National, highest exposure in commodity agricultural wire and basic palisade | Short term (≤ 2 years) |
| Compliance Retrofit Costs Under Electric Fence Regulations | -0.3% | National, most acute in high-density residential markets including Johannesburg and Cape Town | Short term (≤ 2 years) |
| Electronics-Focused Security Spending Delays Physical Fencing Investments | -0.3% | Urban commercial centers, primarily Johannesburg and Cape Town | Medium term (2-4 years) |
| Source: Mordor Intelligence | |||
Steel and Coating Price Volatility Pressures Manufacturing Costs
Steel price pressure limits growth in the South Africa fencing market because input costs remain exposed to import competition, exchange rate swings, and potential tariff changes. Primary carbon steel imports reached 1.6 million tonnes in 2025, and stainless steel imports rose 78% year on year, increasing benchmark volatility across the local supply chain[2]South African Iron and Steel Institute, “South Africa's Steel Import Challenge Is No Longer Cyclical, It Is Structural,” SAISI, saisi.org. South Africa also recorded a steel trade deficit of approximately USD 115 million in the first quarter of 2025, while flat steel imports rose 5.6% year on year to 334,667 tonnes, adding pressure on domestic processors and contractors. Exchange rate movements between approximately USD 0.044 and USD 0.055 per ZAR increased the cost uncertainty of imported galvanizing zinc and powder coating inputs used in premium fence finishes. Contractors feel this most on fixed-price infrastructure bids in the South Africa fencing market because long project cycles rarely provide simple material-escalation protection.
Low-Cost Fabricators and Imports Intensify Pricing Competition
Low-cost imports constrain the South Africa fencing market because commodity products such as agricultural wire, diamond mesh, and basic palisade are exposed to an underpriced foreign supply. The South African Iron and Steel Institute (SAISI) expects global excess capacity to reach more than 700 million tonnes by 2027, suggesting that South Africa will likely continue to receive surplus steel-linked product flows from major exporting regions. The broader security technology picture already showed that China supplied 72% of South Africa’s imported security technology as of 2022, supporting the view that imported pricing pressure is structural rather than short-lived. Established suppliers in the South Africa fencing market are responding by leaning on ISO 9001:2015, B-BBEE Level 2 status, South African Bureau of Standards (SABS) markings, and local content declarations that matter in public and parastatal procurement. Companies that cannot anchor themselves in compliance-heavy or specification-grade work remain the most exposed to margin erosion in the commodity tier.
*Our forecasts treat driver/restraint impacts as directional, not additive. The impact forecasts reflect baseline growth, mix effects, and variable interactions.
Segment Analysis
By Material: Metal's Structural Grip Challenged by Composite's Corrosion Advantage
Metal held 53% of South Africa fencing market share in 2025, which kept it in the lead across industrial, mining, and critical infrastructure installations where rigidity and forced-entry resistance remain essential. Within the metal category, steel formats such as hot-dip galvanized, ZincAlu-coated, and thermoplastic-finished welded mesh carried most specification-driven projects at power stations, mines, and logistics parks. Buyers in those locations continue to favor anti-cut performance, anti-climb performance, and multi-decade durability ahead of lower upfront cost, which keeps metal central to the South Africa fencing industry in heavy-duty applications. Aluminum serves a smaller but rising niche in Cape Town and Durban because corrosive coastal conditions can shorten the life of standard galvanized steel systems. Wood still appears in residential landscaping and farm boundaries, but its role is narrowing as welded mesh alternatives offer stronger lifecycle economics and better alignment with modern security expectations.
Plastic & composite is forecast to grow at a 6.3% CAGR between 2026 and 2031, which makes it the fastest-growing material group in the South Africa fencing market. Demand is being supported by solar farm developers, game reserve operators, and coastal logistics sites that seek UV stability, zero galvanic corrosion, and low maintenance over long asset lifespans. That shift matters for industry structure because composite-focused suppliers can enter the South Africa fencing industry without replicating a local steel wire-drawing or mesh-welding plant. Concrete fencing remains a stable but slower-growth option, especially in estate boundaries and farm walls where permanence matters more than flexibility or advanced intrusion performance.


By End-User: Residential Scale Meets Energy Velocity
Residential accounted for a 63% share of the South Africa fencing market size in 2025, reflecting the country’s large installed base of gated communities, walled homes, and perimeter-conscious suburban properties. Households in metro areas form the densest demand pool for clearview mesh, palisade panels, and wall-top electric systems because those formats fit existing security habits and insurer expectations. Energy & power is forecast to expand at a 7.1% CAGR through 2031, giving it the fastest growth profile among end users in the South Africa fencing market. Eskom’s treatment of major power assets as national key points keeps contract specifications high, raising average project values well above the commodity range. Mining remains another significant buyer because operators continue spending heavily on perimeter protection against illegal mining, cable theft, and equipment vandalism.
Government, military, and defense represent steady institutional demand, while petroleum and chemicals sites are increasingly seeking monitored electric fencing tied to wider surveillance systems. Agriculture is the second-largest rural demand block, supported by 35,000 commercial farming units and an expanding game-farm footprint that requires secure boundary control. Gallagher Group’s full acquisition of Gallagher Power Fence South Africa in May 2025 shows that international suppliers view agricultural and game-reserve fencing as a durable growth avenue across Africa and the Middle East. The split between urban residential demand and rural agricultural demand gives suppliers in the South Africa fencing market a practical hedge against fluctuations in either city crime cycles or farm investment cycles.
By Installation Type: Fixed / Permanent Infrastructure Dominates, but Temporary / Mobile Fencing Demand Builds
Fixed / permanent fencing accounted for 88% of installation revenue in 2025, underscoring the South Africa fencing market's continued reliance on long-life perimeter capital expenditure. Transnet Engineering’s May 2025 Swartkops requirement for a 3-kilometer perimeter, a 10-year lifecycle, and at least 7 years of spares availability illustrates the permanence expected in transport and industrial projects. The permanent segment also includes clear specification layers, ranging from residential clearview mesh at 1.8 meters to national key point-grade double-skin 358 mesh at 2.4 meters, with anti-tunneling footings and electric overlays. That tiering creates distinct margin pockets within a single installation class, which helps explain why specification-grade suppliers remain active even when lower-cost fencing prices soften. Industrial, infrastructure, and residential buyers all reinforce this dominance because each group values permanence, system life, and low replacement frequency.
Temporary / mobile fencing is projected to grow at a 6.7% CAGR between 2026 and 2031, making it the most dynamic installation type in the South Africa fencing market. Growth is coming from construction activity, event infrastructure, and modular mining operations where work areas move, and boundaries need regular adjustment. Betafence’s decision in 2026 to introduce ZND as a designated partner for mobile and temporary solutions signals that premium brands see durable opportunity in this niche but want specialist operating models rather than undifferentiated volume. The warehousing build pipeline and the spread of generator and battery storage enclosures are also creating short-cycle temporary orders that were not central to historical demand patterns.
By Installation Channel: Contractor Primacy Meets DIY Disruption
Professional contractors accounted for 74% of installation revenue in 2025, keeping the formal channel dominant across the South African fencing market. Electric fence work sits behind that concentration because installations, repairs, and extensions require a Registered Electric Fence System Installer under the compliance framework tied to SANS 10222-3:2023 Edition 5.1. Public and parastatal contracts reinforce the same pattern because contractor eligibility is filtered through the Construction Industry Development Board (CIDB) grading, with Transnet requiring 5SQ and Eskom Matimba requiring 7CE. The compulsory inspection and Certificate of Compliance cycle provides qualified installers with recurring revenue beyond one-time project work. That structure keeps more complex, electrified, and high-security jobs concentrated with certified and insured contractors rather than open market installers.
The others segment is forecast to grow at a 6.1% CAGR between 2026 and 2031, helped by simpler product formats that reduce installation barriers for buyers outside the formal contractor base. Betafence’s March 2025 e-commerce launch moved pool fences, Pantanet agricultural rolls, and Easyview and Deltaview ranges closer to smaller contractors and property owners, which widened access in the South Africa fencing market without changing the compliance position of electrified systems. Agriculture is the main DIY growth engine because farmers often self-install high-tensile wire systems for livestock and game management with supplier guidance rather than full contractor crews. Nemtek’s April 2025 positioning of lithium battery-powered energizers as the future of portable electric fencing also lowers complexity in remote deployments by removing the need for wired power connections.
Geography Analysis
Johannesburg held 31% of South Africa fencing market share in 2025, which made Gauteng the largest single metro demand center for residential, commercial, and industrial perimeter systems[3]Germany Trade and Invest, “Sicherheitstechnik in Südafrika Immer Gefragter,” Germany Trade and Invest, gtai.de. The city’s concentration of commercial property, industrial parks, and high-density estates keeps fencing demand elevated because security needs remain persistent and highly visible across both older and newer developments. Electrified clearview systems are especially common in dense residential estates and commercial parks, which means each ownership transfer or redevelopment can create compliance-upgrade work as well as new installation demand. Gauteng’s warehousing pipeline adds another near-term layer because Eastport and Longlake projects scheduled for 2026 completion increase the backlog for industrial perimeter contracts. Cape Town ranked second in 2025 and benefited from strong industrial property activity, including Growthpoint’s Phase 2 build at Arterial Industrial Estate valued at USD 21.5 million, to support warehouse demand.
Durban’s demand is tied to KwaZulu-Natal’s logistics corridor and cold-chain expansion, where distribution investment supports both external fencing and higher-performance coatings for humid operating environments. Gqeberha plays a smaller but notable role because the automotive and manufacturing base in Nelson Mandela Bay is complemented by Transnet’s security upgrade requirement for its Swartkops locomotive depot. Against a South Africa fencing market size of USD 0.43 billion in 2026, the Rest of South Africa is forecast to expand at a 5.9% CAGR through 2031, which makes it the fastest-growing geographic block. That growth is coming from secondary-city logistics sites, game-reserve expansion in Mpumalanga and Limpopo, and energy infrastructure security projects such as Matimba Power Station in Lephalale.
The Karoo and Northern Cape solar corridors are also supporting demand for perimeter systems that can operate with limited grid reliability, which strengthens interest in solar-ready electric fencing. These non-metro markets behave differently from Johannesburg or Cape Town because demand is more closely tied to infrastructure programs, land management, and resource protection than to dense urban security patterns. That makes the broader South Africa fencing market more balanced because metro activity is supported by residential and commercial security. In contrast, capital projects and rural boundary control support the rest of the country. It also means growth outside the largest metros is more resilient to changes in crime cycles but more exposed to the timing of infrastructure and energy investment calendars.
Competitive Landscape
The South African fencing market remains fragmented, organized across globally affiliated manufacturers with local presence, domestic specialists with proprietary technologies, and a large base of regional fabricators and installers. Betafence and Cochrane Global compete strongly in specification-grade welded mesh for government, energy, mining, and other critical sites where certification and tender compliance matter as much as product performance. Nemtek anchors the electrification side of the South Africa fencing market through proprietary energizer technology and its Nemtek Connect platform, which supports remote monitoring via GSM, Wi-Fi, and LoRa networks. Meshco stands out because it spans raw wire drawing through finished high-security panels, enabling it to maintain tighter control over costs and product consistency than reseller-only models. Cape Gate holds an important upstream position because its wire rod and fencing wire capabilities influence availability and pricing conditions for downstream producers during periods of import pressure.
A clear gap remains in digitally integrated perimeter solutions for the South Africa fencing market, especially where fence monitoring needs to connect with broader building management or armed-response systems. Nemtek Connect and Gallagher’s F5 and F6 fence controllers both address this direction, but large industrial sites still often need custom integration rather than a fully standardized platform. Transnet’s May 2025 Swartkops tender clearly showed that gap, as fence monitoring software with zone mapping and GSM dispatch was listed as a separate requirement rather than a standard bundled package. That suggests software and system integration still lag hardware in maturity, leaving room for targeted differentiation even in a crowded supplier base.
Strategic activity in 2025 and 2026 also shows that adjacent perimeter categories are consolidating around the South Africa fencing market. Gallagher’s full acquisition of Gallagher Power Fence South Africa gave the group direct control over a larger agricultural and game-farm channel from its Johannesburg base. FAAC’s acquisition of Centurion Systems in May 2025 added gate automation and access control scale, strengthening perimeter integration options around fencing rather than replacing the fencing itself. Emerging solar-electric integrators are adding another competitive layer by combining approved energizers, solar panels, and LiFePO4 battery packs into turnkey grid-independent systems, which supports margins in remote and load-shedding-prone locations without changing the market’s overall fragmented structure.
South Africa Fencing Industry Leaders
Betafence South Africa
Cochrane Global
Nemtek
Stafix Electric Fence and Security Centres
Fang Fences & Guards
- *Disclaimer: Major Players sorted in no particular order

Recent Industry Developments
- April 2026: Eskom Holdings SOC Ltd progressed with Phase 2 security fence upgrades at Matimba Power Station in Lephalale, Limpopo, as part of its broader national key point security enhancement program. The project emphasizes the use of fully locally produced wire products and qualified civil engineering contractors to strengthen perimeter protection infrastructure.
- February 2026: Betafence South Africa hosted Installer Forum events at its Johannesburg and Cape Town offices, focused on product knowledge, industry challenges, and contractor competitive positioning, reflecting a strategic consolidation of its certified installer network ahead of anticipated demand for compliance upgrades under SANS 10222-3:2023.
- May 2025: Gallagher Group of New Zealand completed the full acquisition of Gallagher Power Fence South Africa by purchasing the remaining shares from joint venture partner Iso Lika Nkulunkulu Pty Ltd, consolidating 100% ownership from its Johannesburg base and aiming to expand penetration across agricultural, game reserve, and rural security fencing markets across Africa and the Middle East.
- May 2025: Transnet Engineering advanced perimeter security upgrades at the Swartkops Locomotive Depot in Gqeberha by developing a 3-kilometer ClearVu fencing system integrated with a 30-strand electric fence and CCTV-based intrusion-detection infrastructure. The project represented one of the largest transport-sector perimeter security modernization initiatives announced in South Africa during the year.


South Africa Fencing Market Report Scope
The South Africa Fencing Market is Segmented by Material (Metal, Wood, Plastic & Composite, and more), End-User (Residential, Agricultural, and more), Installation Type (Fixed / Permanent Fencing and Temporary / Mobile Fencing), Installation Channel (Professional Contractor and Others), and Geography (Johannesburg, Cape Town, Durban, and more). The Market Forecasts are Provided in Terms of Value (USD).
| Metal | Steel |
| Aluminium | |
| Wood | |
| Plastic & Composite | |
| Concrete | |
| Other Materials |
| Residential |
| Agricultural |
| Military & Defense |
| Government |
| Mining |
| Petroleum & Chemicals |
| Energy & Power |
| Other End-Users |
| Fixed / Permanent Fencing |
| Temporary / Mobile Fencing |
| Professional Contractor |
| Others (Fabricators, DIY / Modular Kits) |
| Johannesburg |
| Cape Town |
| Durban |
| Port Elizabeth / Gqeberha |
| Rest of South Africa |
| By Material | Metal | Steel |
| Aluminium | ||
| Wood | ||
| Plastic & Composite | ||
| Concrete | ||
| Other Materials | ||
| By End-User | Residential | |
| Agricultural | ||
| Military & Defense | ||
| Government | ||
| Mining | ||
| Petroleum & Chemicals | ||
| Energy & Power | ||
| Other End-Users | ||
| By Installation Type | Fixed / Permanent Fencing | |
| Temporary / Mobile Fencing | ||
| By Installation Channel | Professional Contractor | |
| Others (Fabricators, DIY / Modular Kits) | ||
| By Geography | Johannesburg | |
| Cape Town | ||
| Durban | ||
| Port Elizabeth / Gqeberha | ||
| Rest of South Africa |


Key Questions Answered in the Report
What is the current size and forecast for fencing demand in South Africa?
The South Africa fencing market was valued at USD 0.41 billion in 2025 and is projected to grow from USD 0.43 billion in 2026 to USD 0.56 billion by 2031, registering a CAGR of 5.43% during the forecast period.
What is the biggest growth driver for fencing demand in the country?
Persistent security concerns remain the main driver because fencing now functions as a basic underwriting and perimeter hardening requirement across homes, commercial parks, and industrial sites .
Which material category leads revenue and which one is growing fastest?
Metal led with 53% of revenue in 2025, while plastic & composite are forecast to grow the fastest at a 6.3% CAGR through 2031.
Which end-user group offers the strongest near-term expansion?
Energy & power is the fastest-growing end-user at a 7.1% CAGR, supported by Eskom tenders and wider solar and battery asset security requirements.
Page last updated on:


