Fiber-to-the-Home (FTTH) Market Size and Share
Market Overview
| Study Period | 2020 - 2031 |
|---|---|
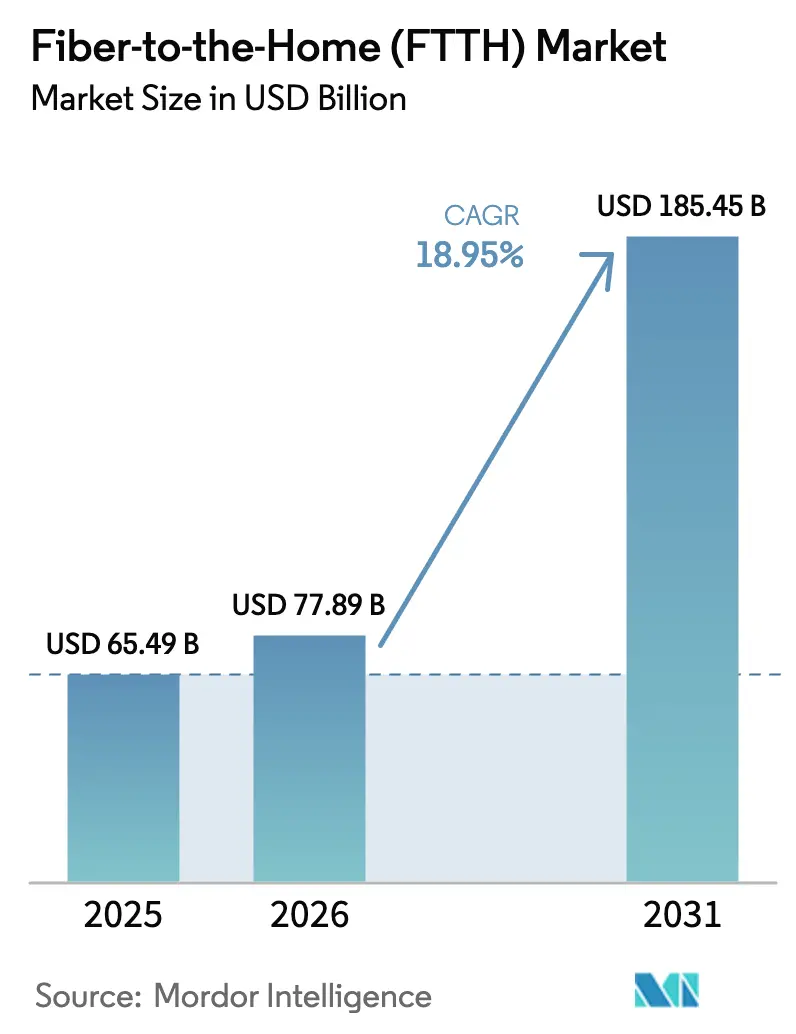
| Market Size (2026) | USD 77.89 Billion |
| Market Size (2031) | USD 185.45 Billion |
| Growth Rate (2026 - 2031) | 18.95% CAGR |
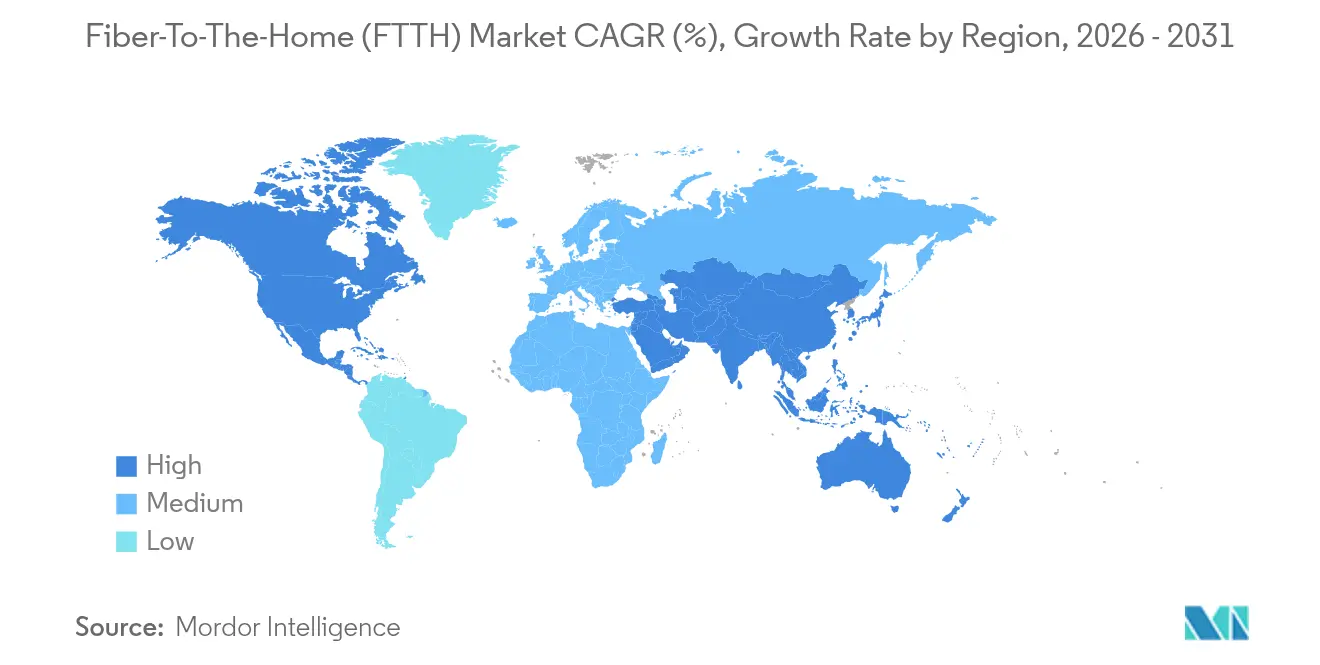
| Fastest Growing Market | Asia Pacific |
| Largest Market | North America |
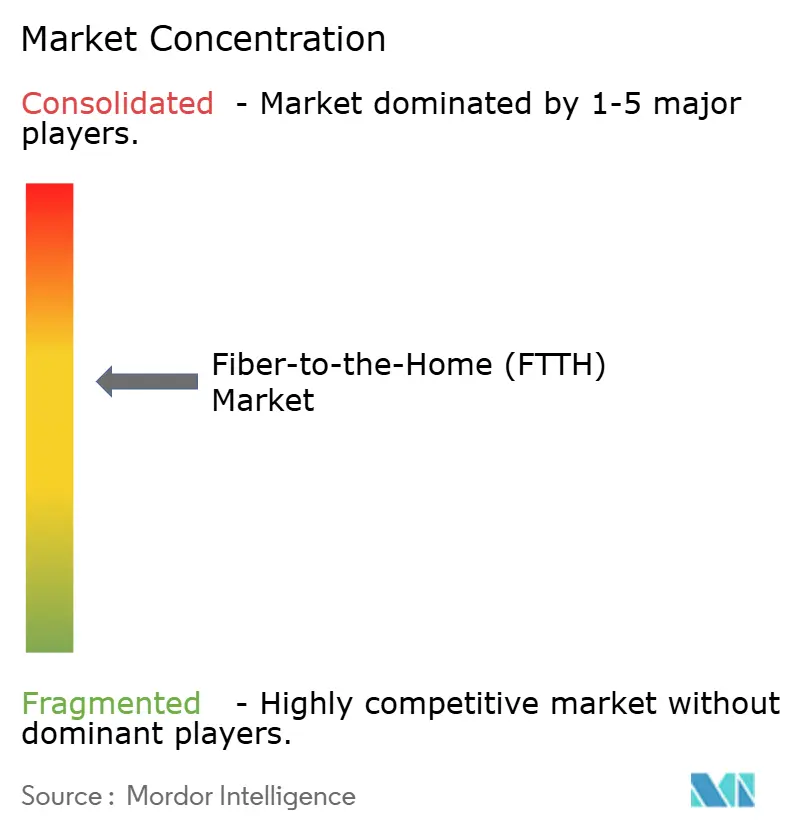
| Market Concentration | Medium |
Major Players *Disclaimer: Major Players sorted in no particular order Image © Mordor Intelligence. Reuse requires attribution under CC BY 4.0. | |
Fiber-to-the-Home (FTTH) Market Analysis by Mordor Intelligence
The Fiber-to-the-Home market size is expected to grow from USD 65.49 billion in 2025 to USD 77.89 billion in 2026 and is forecast to reach USD 185.45 billion by 2031 at 18.95% CAGR over 2026-2031. Growth rests on three pillars: accelerating data traffic, policy targets that define gigabit service as a basic right, and optical-access innovation that lifts network capacity while containing cost. Operators worldwide upgrade from GPON to XGS-PON and prepare for 50G PON to secure symmetrical multi-gigabit speeds that copper or hybrid coax cannot deliver. Power-efficient optics and software-defined access lower total cost of ownership, helping carriers justify capex even as competition from 5G fixed-wireless access (FWA) gains momentum. Asia-Pacific dominates new builds, while the Middle East and Africa leads percentage growth as governments pursue leapfrog strategies built around all-fiber access. Use cases continue to widen beyond streaming: cloud gaming, AI-enabled collaboration, and smart-home automation require deterministic bandwidth that only fiber provides. Sustainability mandates add momentum, with optical access posting 60% lower embodied carbon and more than 90% lower operating emissions than hybrid coax alternatives.
Key Report Takeaways
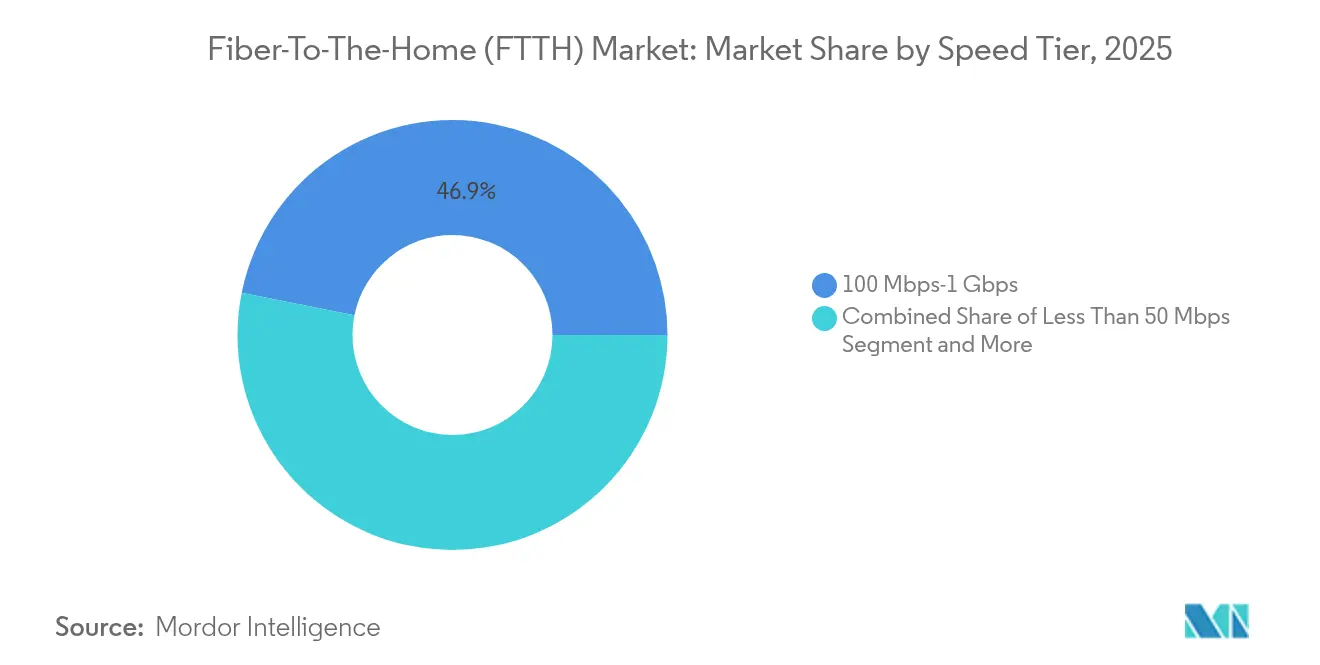
- By speed tier, the 100 Mbps–1 Gbps category held 46.85% Fiber-to-the-Home market share in 2025, while the >10 Gbps tier is projected to grow at a 27.15% CAGR through 2031.
- By application, Internet TV led with 31.90% revenue share in 2025; Cloud/AR-VR gaming is forecast to expand at a 23.8% CAGR to 2031.
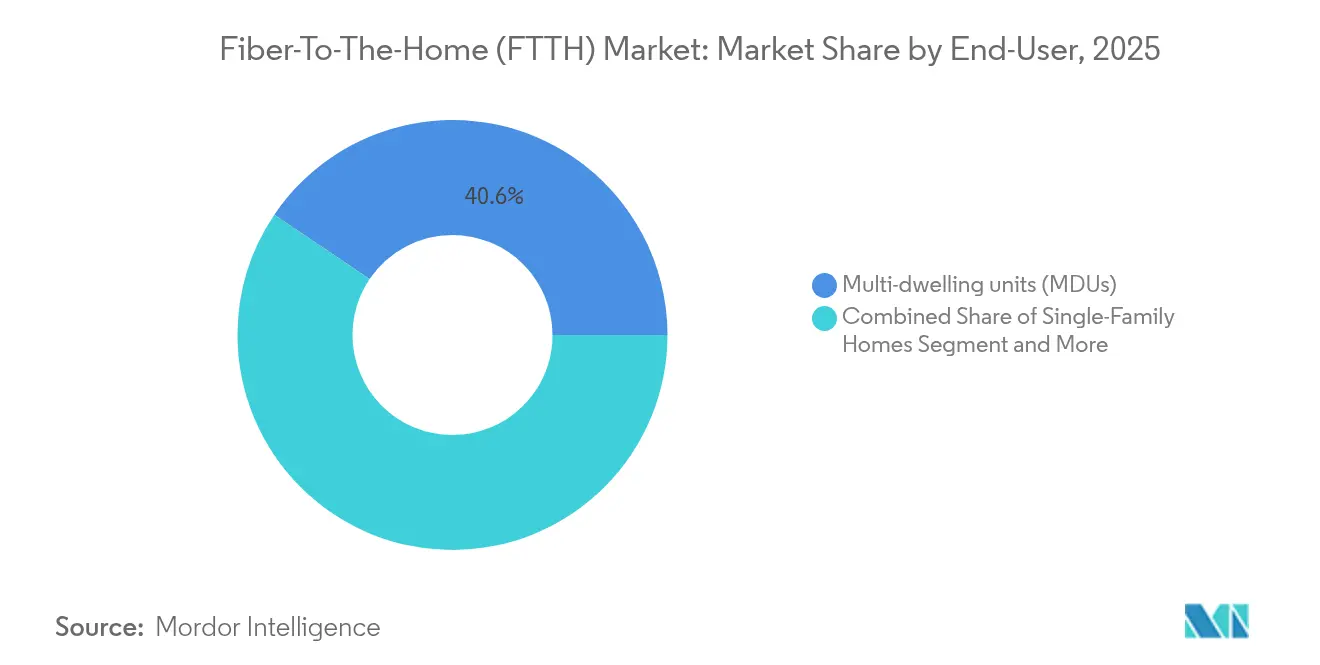
- By end user, multi-dwelling units commanded 40.55% Fiber-to-the-Home market share in 2025, whereas the SOHO segment is advancing at a 25.1% CAGR through 2031.
- By deployment technology, GPON accounted for 53.60% of the Fiber-to-the-Home market size in 2025; NG-PON2 is expected to post a 30.9% CAGR through 2031.
- By geography, Asia-Pacific generated 55.90% of global revenue in 2025; the Middle East and Africa region is set to register a 19.12% CAGR to 2031.
Note: Market size and forecast figures in this report are generated using Mordor Intelligence’s proprietary estimation framework, updated with the latest available data and insights as of 2026.
Global Fiber-to-the-Home (FTTH) Market Trends and Insights
Drivers Impact Analysis*
| Driver | (~) % Impact on CAGR Forecast | Geographic Relevance | Impact Timeline |
|---|---|---|---|
| Surge in high-speed broadband demand | +4.2% | Global | Short term (≤ 2 years) |
| Government gigabit-society targets and subsidies | +3.8% | North America and EU, Asia-Pacific core | Medium term (2-4 years) |
| Smart-home and IoT bandwidth explosion | +3.1% | Global, with early gains in North America, Europe, Asia-Pacific | Medium term (2-4 years) |
| Edge-cloud and AI workload densification needs | +2.9% | Global, concentrated in major data center hubs | Long term (≥ 4 years) |
| Sustainability mandates favoring passive optics | +2.4% | EU, North America, spill-over to Asia-Pacific | Long term (≥ 4 years) |
| Competitive advantage of multi-gig symmetrical offers | +2.0% | Global | Short term (≤ 2 years) |
| Source: Mordor Intelligence | |||
Surge in high-speed broadband demand
Households shifted from burst traffic toward continuous multi-gigabit throughput as 4K streaming, cloud gaming, and concurrent device use became standard. Smart-home ecosystems already call for at least 300 Mbps symmetrical service, making copper upgrades untenable. Operators therefore accelerate Fiber-to-the-Home market roll-outs to capture subscribers ready to pay premiums for reliable multi-gig speeds. Customer-acquisition costs rise, yet revenue per user climbs in line with higher speed-tier adoption, reinforcing fiber as an economic imperative rather than a discretionary upgrade.
Government gigabit-society targets and subsidies
Public funding de-risks capital-intensive projects. The United States BEAD program assigns USD 42.45 billion to underserved locations, and nine of ten funded builds must use fiber[1]Corning Incorporated, “Broadband Equity Access and Deployment Funding Prioritizes Fiber,” corning.com. The EU Digital Decade requires gigabit access for every household by 2030, and countries channel subsidies toward passive optical networks. Such clarity in demand lets carriers lock in low-cost financing and scale procurement, supporting rapid Fiber-to-the-Home market expansion.
Smart-home and IoT bandwidth explosion
Modern homes average 25–50 connected devices, from security cameras to energy-management hubs. Fiber-to-the-Room distribution extends symmetrical gigabit rates to each room while cutting in-home energy use by 30%[2]Fiber Broadband Association, “2025 Fiber Deployment Cost Study,” fiberbroadband.org. Beyond residential settings, industrial IoT depends on deterministic latency that only fiber ensures, turning high-bandwidth connectivity into a premium upsell opportunity for operators.
Edge-cloud and AI workload densification
AI training and inference strain metro and long-haul links. Data-center interconnect bandwidth is expected to grow six-fold by 2030, with traffic bursts requiring 800 Gbps wavelengths. Fiber backhaul becomes critical for edge nodes supporting latency-sensitive AI services. Carriers thus treat 50G PON readiness as a strategic hedge, ensuring networks scale alongside AI adoption.
Restraint Impact Analysis*
| Restraint | ( ~ )% Impact on CAGR Forecast | Geographic Relevance | Impact Timeline |
|---|---|---|---|
| High last-mile build-out CAPEX | -3.5% | Global, particularly rural and low-density areas | Medium term (2-4 years) |
| Fixed-wireless access (FWA) substitution threat | -2.1% | Rural areas globally, urban areas with 5G coverage | Short term (≤ 2 years) |
| Skilled fiber-splicing labor shortages | -1.8% | Global, acute in North America and Europe | Short term (≤ 2 years) |
| Optical-component supply-chain volatility | -1.4% | Global | Short term (≤ 2 years) |
| Source: Mordor Intelligence | |||
High last-mile build-out CAPEX
Underground fiber costs USD 18.25 per foot against USD 6.55 for aerial runs, and labor accounts for up to 80% of totals. Multi-dwelling units add complexity; some markets require fiber even where payback looks marginal, lifting costs 75%. Rural density challenges stretch returns, forcing reliance on grants. Prefabricated optics and pushable fiber trim installation overhead by as much as 50%, but capex remains a gating factor, especially for smaller entrants.
Fixed-wireless access substitution threat
5G-based FWA promises rapid coverage with lower capital intensity. AT&T’s Internet Air forecasts 180,000 net adds per quarter while cable incumbents lose customers. Rural adopters opt for wireless where fiber is delayed. However, FWA performance degrades under congestion and distance; true gigabit symmetry still demands fiber. Providers therefore segment markets, promoting fiber for speed-critical tiers and reserving FWA for budget plans, tempering the restraint’s long-run impact.
*Our forecasts treat driver/restraint impacts as directional, not additive. The impact forecasts reflect baseline growth, mix effects, and variable interactions.
Segment Analysis
By Speed Tier: Multi-Gigabit Services Drive Premium Migration
The 100 Mbps–1 Gbps band held 46.85% of 2025 revenue, cementing gigabit as a baseline expectation. Still, the less than 10 Gbps slice grows at a 27.15% CAGR to 2031 as enterprises and affluent households adopt symmetrical multi-gigabit plans for cloud collaboration and content creation. Altice USA boosted fiber customers 58% after widening multi-gig coverage, aiming for 65% service availability by 2028. Operators view speed tiers as retention levers: churn drops when subscribers upgrade. The greator than 50 Mbps segment fades, while 1–10 Gbps packages target prosumers and campus sites. The Fiber-to-the-Home market size for less than 10 Gbps packages is projected to reach USD 29.24 billion by 2031, reflecting the premium migration trend.
Service providers bundle Wi-Fi 7 gateways and latency-guaranteed options to justify premium tariffs. They exploit existing optical distribution networks by overlaying XGS-PON, optimizing costs yet meeting demand. As applications transition to mixed-reality and cloud rendering, the share of multi-gigabit connections in the Fiber-to-the-Home market is expected to double by 2028, pressuring laggards to accelerate upgrades or risk attrition.


By Application: Cloud Gaming Reshapes Bandwidth Priorities
Internet TV retained 31.90% revenue in 2025 because streamers pushed 4K libraries and sports bundles. Cloud/AR-VR Gaming, at a 23.8% CAGR, draws traffic surges unseen in traditional video. Latency below 20 ms is critical, pushing carriers to prioritize fiber access over FWA or DSL for gamers. The Fiber-to-the-Home market size for gaming could exceed USD 22.26 billion in 2031 as subscription packages pair bandwidth with gaming platform perks.
Remote work and tele-health settled into steady usage, but still require consistent uplink; fiber’s symmetry supports clearer video and faster file sync. Smart-home sensors, interactive security, and virtual private LAN services further diversify demand. Providers market differentiated quality-of-service tiers tuned to each profile, driving average revenue per user up while maximizing passive-optical network utilization.
By End User: SOHO Segment Accelerates Amid Hybrid Work
Multi-dwelling units (MDUs) captured 40.55% Fiber-to-the-Home market share in 2025 thanks to urban density economics. Yet the SOHO category expands 25.1% annually as hybrid work cements itself. Small firms and remote staff require business-grade latency, static IPs, and uptime guarantees once reserved for large enterprises. The Fiber-to-the-Home market size for SOHO connections is on track to reach USD 21.27 billion by 2031, giving operators cross-sell potential for security and collaboration suites.
Single-family homes benefit from subsidy-backed rural builds, while campuses and enterprises deploy dedicated passive optical LANs for security and scalability. Operators craft tiered offers: residential rates for light users, premium SOHO packages with service-level agreements, and enterprise fiber with VLAN segmentation. Versitron notes rising demand for integrated power-over-fiber that reduces electrical cabling in new builds.
By Deployment Technology: NG-PON2 Emerges as Future-Proof Solution
GPON still commands 53.60% of installed lines for cost reasons, but carriers are adopting XGS-PON at scale to enable 10 Gbps symmetry without rebuilding outside plant. NG-PON2, advancing at 30.9% CAGR, introduces tunable wavelengths and time-wavelength division multiplexing, letting one OLT card serve wholesale, enterprise, and residential clients on isolated wavelengths. ZTE’s three-mode Combo PON enables smooth upgrades to 50G PON, targeting commercial readiness in 2025.
Active Ethernet endures in security-sensitive networks that favor point-to-point paths. WDM-PON plays in data-center campus interconnects. Operators balance near-term economics with future scalability: deploying combo optics now avoids stranded plant later. By 2031 more than 44.6% of the Fiber-to-the-Home market is projected to sit on next-generation PON platforms capable of >25 Gbps aggregate downstream per subscriber.
Geography Analysis
Asia-Pacific held 55.90% revenue in 2025, undergirded by national fiber programs. China’s penetration targets place fiber in 90% of broadband lines by 2027, while India’s BharatNet connected 214,000 villages by mid-2025. Japan’s NTT sees JPY 40 billion (USD 270 million) FY2027 profit from FTTH, proving that mature markets still monetize premium tiers. South Korea pairs rural grants with urban densification to sustain universal gigabit objectives. The Fiber-to-the-Home market size for Asia-Pacific is projected to exceed USD 103.15 billion by 2031, anchored by large subscriber bases and domestic optical-component manufacturing.
Europe chases Digital Decade milestones. Average household fiber coverage hit 75%, yet subscriptions linger at 40%, pointing to upside for take-rate campaigns. Germany targets 50% coverage by 2025 but stood at 36.8% mid-2024, slowed by urban permitting issues. The United Kingdom allocates subsidies for rural builds and endorses open-access models to foster competition. Southern Europe, led by Spain and Portugal, already tops 90% coverage and now pushes migration to multi-gig services.
North America relies on the Infrastructure Investment and Jobs Act’s USD 65 billion broadband outlay. The BEAD tranche channels USD 42.45 billion to fiber in underserved zones, promising a step-change in rural availability corning.com. U.S. household fiber serviceability hit 56.5% in 2024 and is projected to reach 80% in 2028. Canada’s Universal Broadband Fund supports remote builds, while electric co-ops in the Midwest bundle power and broadband to boost adoption.The Middle East and Africa logs the fastest CAGR at 19.12%. Gulf states embed fiber in national digitization blueprints, and African regulators create neutral-host wholesale networks to avoid duplication. Governments view all-fiber access as a prerequisite for e-commerce, tele-medicine, and e-government, positioning the region for sustained, albeit uneven, expansion.

Competitive Landscape
The Fiber-to-the-Home market is moderately fragmented. In Asia-Pacific, state-owned giants such as China Mobile control >70% of national lines. North America and Europe feature incumbent telcos, cable operators pivoting to fiber, municipal networks, and private equity-backed altnets. Capital efficiency and deployment velocity separate winners from laggards. Operators leverage aerial strand-mount approaches or micro-trenching to increase homes passed per crew per day, while specialists like Google Fiber concentrate on high-ARPU metros.
Technology differentiation intensifies. Nokia and Google Fiber’s live 50G PON trial in Kansas City demonstrated multi-gig speeds on existing distribution fiber[3]Nokia, “Google Fiber and Nokia Achieve 50G PON Milestone,” nokia.com. Carriers race to deploy XGS-PON capable ONTs that can software-upgrade to 25G or 50G, avoiding future truck rolls. Vendor lock-in risk drives interest in standards-based optics and open OLT management. Meanwhile, nontraditional players such as power utilities enter the Fiber-to-the-Home market, using existing pole rights to string fiber faster and at lower cost.
Strategic focus centers on dense urban builds for rapid cash flow bundled with government-subsidized rural extensions. Altice USA captured 500,000 fiber customers and raised penetration to 18.2% by end-2024, aided by aggressive marketing of 8 Gbps tiers. Deutsche Telekom added 470,000 subscribers in 2024 and plans 2.5 million additional passings in 2025, targeting 8 million rural homes by 2030. Zayo’s USD 4 billion AI-driven long-haul build indicates synergies between metro access demand and hyperscale backbone upgrades.
Fiber-to-the-Home (FTTH) Industry Leaders
China Telecom Corp. Ltd.
China Mobile Ltd.
Verizon Communications Inc.
AT&T Inc.
Orange S.A.
- *Disclaimer: Major Players sorted in no particular order

Recent Industry Developments
- March 2025: Zayo Group announced a USD 4 billion long-haul expansion to link AI data-center hubs with 5,000 new route miles.
- February 2025: Deutsche Telekom reported 470,000 new fiber subscribers in 2024 and plans 2.5 million additional passings in 2025.
- February 2025: Altice USA surpassed 500,000 fiber customers and reached 3 million passings, targeting 65% multi-gig coverage by 2028.
- June 2024: Nokia and Google Fiber completed the first U.S. 50G PON live-network trial.


Research Methodology Framework and Report Scope
Market Definitions and Key Coverage
Our study defines the fiber-to-the-home (FTTH) market as the combined equipment, civil-works services, and recurring access fees generated when optical fiber runs all the way from a central office to an optical network terminal inside a residence or small office. This definition therefore captures outside-plant cabling, passive and active optical components, installation labor, and monthly subscriptions collected by network operators.
Scope exclusion: Solutions that stop fiber at a curb, street cabinet, or building basement without extending it into individual premises are not covered.
Segmentation Overview
- By Speed Tier
- Less Than 50 Mbps
- 50-100 Mbps
- 100 Mbps-1 Gbps
- 1-10 Gbps
- Greater than 10 Gbps
- By Application
- Internet TV
- VoIP
- Interactive Gaming
- Smart-home Applications
- Cloud/AR-VR Gaming
- Remote Education
- VPN on Broadband
- Virtual Private LAN Service
- Tele-health
- By End User
- Single-Family Homes
- Multi-Dwelling Units (MDU)
- Small Office / Home Office (SOHO)
- Enterprises and Campuses
- Public and Municipal Buildings
- By Deployment Technology
- GPON
- XGS-PON
- NG-PON2
- Active Ethernet (P2P)
- WDM-PON
- By Geography
- North America
- United States
- Canada
- Mexico
- South America
- Brazil
- Argentina
- Rest of South America
- Europe
- United Kingdom
- Germany
- France
- Italy
- Spain
- Nordics
- Rest of Europe
- Middle East and Africa
- GCC
- Israel
- South Africa
- Rest of Middle East and Africa
- Asia-Pacific
- China
- India
- Japan
- South Korea
- ASEAN
- Australia
- New Zealand
- Rest of Asia-Pacific
- North America
Detailed Research Methodology and Data Validation
Primary Research
We conducted structured interviews with network planners at incumbent telcos, regional fiber altnets, rights-of-way contractors, and optical-component suppliers across Asia-Pacific, North America, Europe, and the Middle East. These conversations helped us verify rollout velocities, average build costs, and upgrade intentions, letting us close gaps left by secondary material.
Desk Research
Analysts began with authoritative open data from bodies such as the International Telecommunication Union, the Fiber Broadband Association, FTTH Council Europe, the FCC, and national statistics portals. We blended these datasets with company filings, investor presentations, and trade-press releases to map annual passings, subscriber additions, and capital expenditure trends by country.
Next, our team tapped paid intelligence platforms, including D&B Hoovers for operator financials and Dow Jones Factiva for deal tracking, to cross-check ownership changes, shipment values, and price movements of GPON and XGS-PON gear. Many other reliable public sources were also consulted; the list here is illustrative rather than complete.
Market-Sizing & Forecasting
The model starts with a top-down and bottom-up blend. Household counts, broadband-penetration targets, average access tariffs, public-funding awards, homes-passed velocity, take-rate progression, and GPON-to-XGS migration timelines build the initial demand pool. We then validate totals through sampled bills of material, supplier channel checks, and civil-works cost benchmarks. Revenue to 2030 is projected with a multivariate regression tuned to scenario bands reviewed by primary-research experts. Any difference between supplier roll-ups and the top-down baseline is reconciled and documented.
Data Validation & Update Cycle
Outputs pass peer review, variance testing against independent deployment databases, and senior analyst sign-off. Reports refresh every twelve months, with interim updates whenever major funding awards, policy shifts, or mergers materially alter assumptions.
Why Mordor's Fiber-to-the-Home Baseline Commands Confidence
Published estimates often differ because firms pick dissimilar scope elements, apply varied currency conversions, or freeze assumptions for years. Our disciplined annual refresh and clearly disclosed inclusions avoid those pitfalls.
Key gap drivers include whether subscription revenue is counted, how fast GPON price erosion is modeled, and whether in-home CPE is bundled.
Some publishers rely on limited installer surveys or roll forward historic ARPUs without fresh validation, which inflates or depresses totals relative to our evidence-based baseline.
Benchmark comparison
| Market Size | Anonymized source | Primary gap driver |
|---|---|---|
| USD 65.49 B (2025) | Mordor Intelligence | - |
| USD 56.03 B (2024) | Global Consultancy A | Narrower geographic scope; telecom-average ASPs applied |
| USD 62.64 B (2024) | Industry Association B | Excludes in-home CPE; update cadence is biennial |
The comparison shows that, once differing scopes and refresh cycles are considered, our figure sits mid-range and therefore offers managers a balanced, transparent starting point that is traceable to clearly stated variables and repeatable steps.


Key Questions Answered in the Report
How large is the Fiber-to-the-Home market in 2026 and how fast is it growing?
The Fiber-to-the-Home market is worth USD 77.89 billion in 2026 and is forecast to expand at a 18.95% CAGR over 2026-2031 to reach USD 185.45 billion by 2031.
Which region dominates Fiber-to-the-Home deployments?
Asia-Pacific leads with 55.90% revenue share in 2025 thanks to large-scale national fiber programs in China, India, Japan, and South Korea.
What speed tier is growing fastest?
Connections exceeding 10 Gbps are projected to grow at a 27.15% CAGR through 2031 as enterprises and premium residential users migrate to multi-gigabit services.
How are governments influencing market growth?
Programs such as the U.S. BEAD fund and the EU Digital Decade channel billions of dollars toward fiber builds, lowering investment risk and accelerating roll-outs.
What is the main competitive threat to fiber access?
5G fixed-wireless access offers quicker, lower-cost coverage in select rural or sparse markets, but lacks the symmetrical multi-gigabit performance that fiber delivers.
Page last updated on:


