Optical Switches Market Size and Share
Market Overview
| Study Period | 2020 - 2031 |
|---|---|
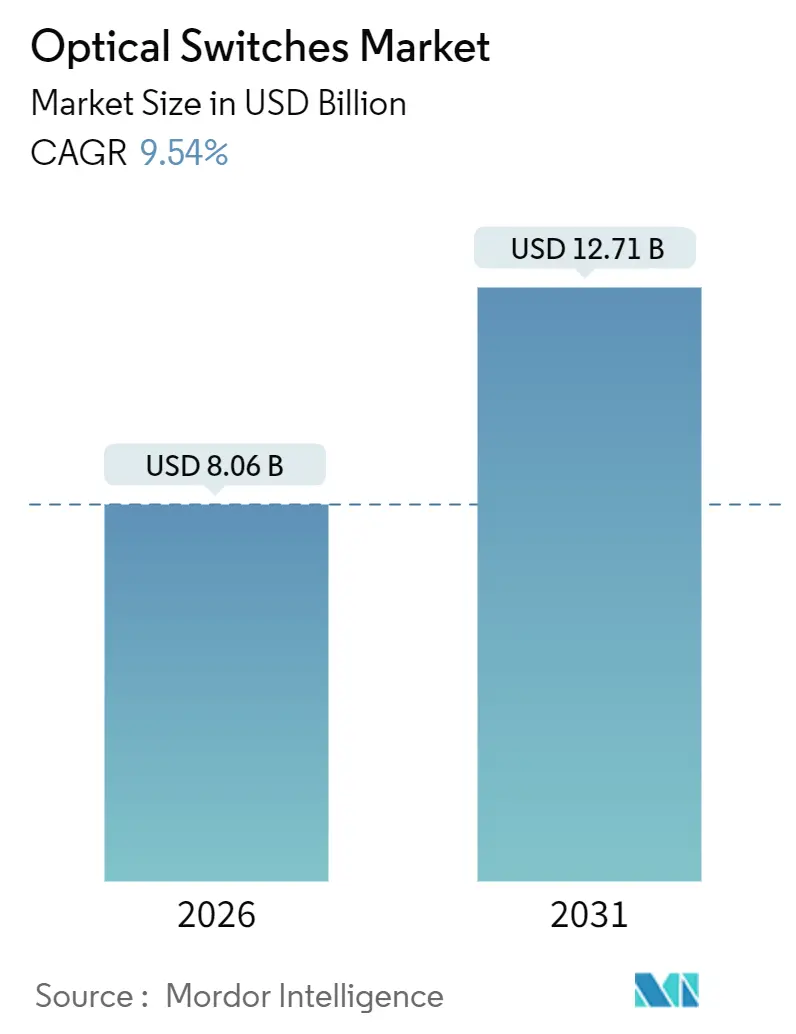
| Market Size (2026) | USD 8.06 Billion |
| Market Size (2031) | USD 12.71 Billion |
| Growth Rate (2026 - 2031) | 9.54% CAGR |
| Fastest Growing Market | Middle East |
| Largest Market | Asia Pacific |
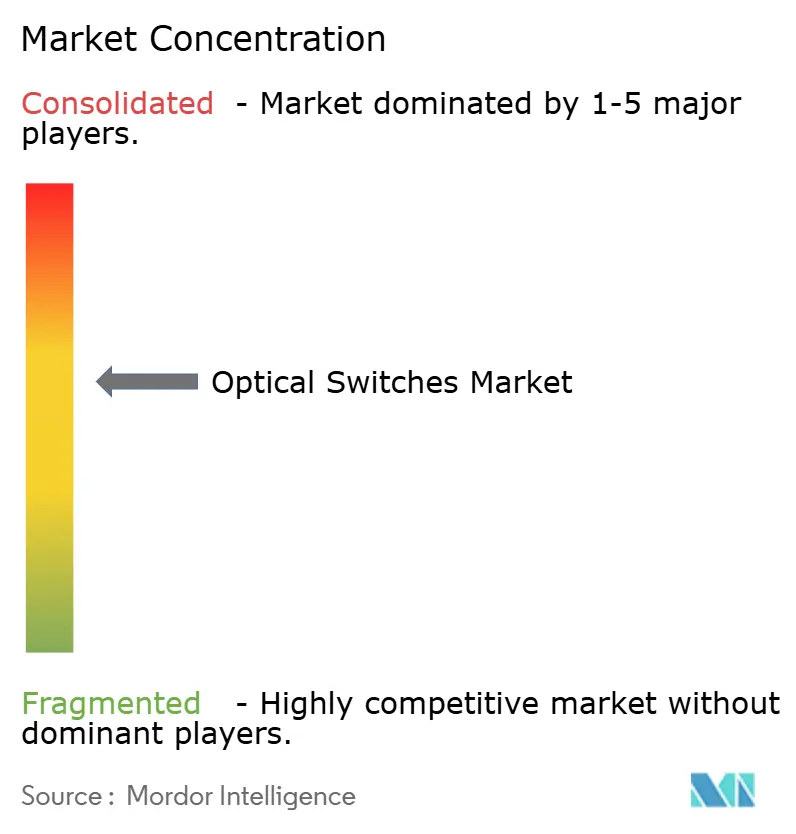
| Market Concentration | Medium |
Major Players *Disclaimer: Major Players sorted in no particular order Image © Mordor Intelligence. Reuse requires attribution under CC BY 4.0. | |
Optical Switches Market Analysis by Mordor Intelligence
The optical switches market size reached USD 8.06 billion in 2026 and is projected to climb to USD 12.71 billion by 2031, advancing at a 9.54% CAGR. The growing deployment of all-optical fabrics in hyperscale data centers, 800 Gbps port migration, and falling silicon photonics costs are the chief growth catalysts. Sovereign AI compute clusters, 5G and soon-to-arrive 6G backhaul densification, and energy-efficiency mandates are pushing operators to abandon electronic leaf-spine topologies in favor of deterministic optical paths. Competitive pressure from vertically integrated hyperscalers is forcing traditional equipment vendors to accelerate MEMS and co-packaged optics roadmaps. Supply-chain diversification into III-V wafers and domestic photonics packaging is also reshaping vendor strategies, while AI-driven network automation is lowering operating expenses and shortening fault-recovery windows.
Key Report Takeaways
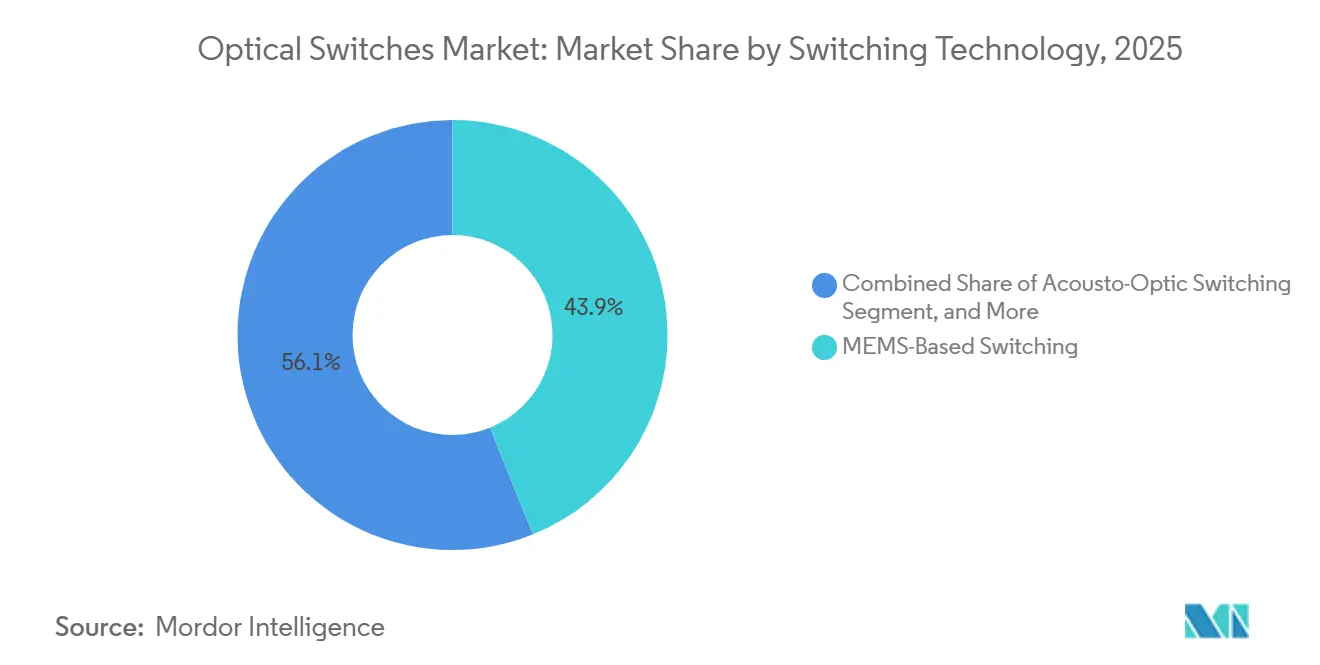
- By switching technology, MEMS commanded 43.89% of the optical switches market share in 2025 and is expanding at a 10.62% CAGR through 2031.
- By port count, 1×8 accounted for 36.71% of revenue share in 2025, whereas 1×16 and above is projected to post a 10.41% CAGR through 2031.
- By data rate, 100-400 Gbps ports captured 39.67% of the optical switches market size in 2025, but ports above 400 Gbps are advancing at a 10.47% CAGR.
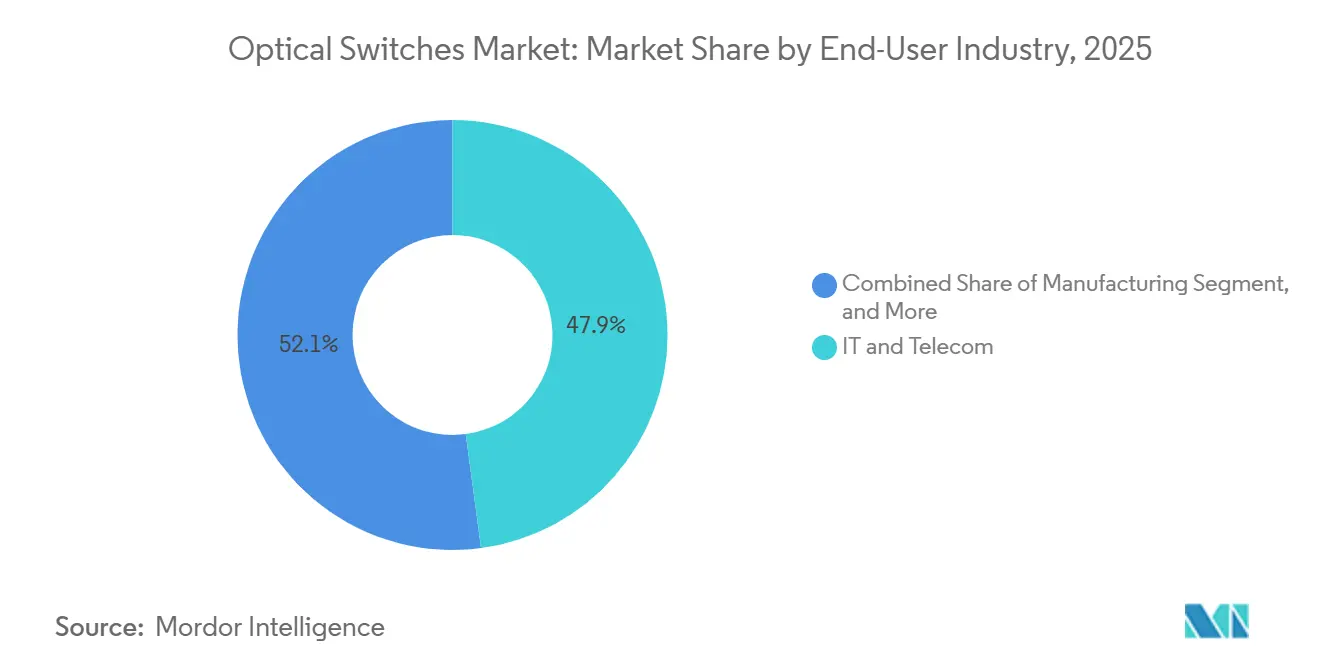
- By end-user industry, IT and telecom accounted for 47.88% of demand in 2025, while BFSI is the fastest-growing segment with a 10.59% CAGR.
- By application, circuit switching led with 41.24% revenue share in 2025, yet testing and monitoring is on track for a 10.56% CAGR.
- By geography, Asia Pacific accounted for 35.79% of 2025 revenue, whereas the Middle East is forecast to register the fastest regional growth at 10.51% through 2031.
Note: Market size and forecast figures in this report are generated using Mordor Intelligence’s proprietary estimation framework, updated with the latest available data and insights as of January 2026.
Global Optical Switches Market Trends and Insights
Drivers Impact Analysis*
| Driver | (~) % Impact on CAGR Forecast | Geographic Relevance | Impact Timeline |
|---|---|---|---|
| Surge in hyperscale data-center buildouts | +2.1% | Global, with concentration in North America, Asia Pacific, and Middle East | Medium term (2-4 years) |
| Rapid 5G and forthcoming 6G backhaul densification | +1.8% | Asia Pacific, Middle East, Europe | Medium term (2-4 years) |
| Silicon-photonics cost curve crossing for ≥400 Gbps ports | +1.6% | Global, led by North America and Asia Pacific | Short term (≤ 2 years) |
| Energy-efficiency mandates favouring all-optical switching | +1.3% | Europe, North America, with spillover to Asia Pacific | Long term (≥ 4 years) |
| Government quantum-network pilot deployments | +0.9% | United States, European Union, China | Long term (≥ 4 years) |
| AI-driven optical network automation and self-healing | +1.2% | Global, early adoption in North America and Europe | Medium term (2-4 years) |
| Source: Mordor Intelligence | |||
Surge in Hyperscale Data-Center Buildouts
Hyperscalers are shifting to optical fabrics to shave power budgets and curb latency spikes. Microsoft rolled out optical circuit switches across 12 Azure zones in 2025 and cut rack-level power draw by 18%.[1]Microsoft Corporation, “Annual Report 2025,” microsoft.com AWS is committed to silicon-photonics co-packaged optics for its next Graviton platforms, eliminating top-of-rack hops. Similar moves by Google and Meta confirmed a structural transition toward deterministic east-west bandwidth. These upgrades concentrate in Virginia, Oregon, Singapore, and the United Arab Emirates, where electricity costs and tax policies are favorable.
Rapid 5G and Forthcoming 6G Backhaul Densification
Mobile operators are inserting optical switches into central offices and edge sites to aggregate traffic from thousands of small cells. China Mobile equipped 47 provincial hubs with MEMS switches, trimming leased-fiber pairs by 29%. Bharti Airtel followed in 18 Indian metro areas, while Vodafone’s Open RAN plan embeds optical cross-connects for real-time fronthaul redistribution. The GSM Association has already positioned optical circuit switching as a baseline for 6G backhaul, underscoring future traffic requirements.
Silicon-Photonics Cost Curve Crossing for ≥400 Gbps Ports
In 2025, co-packaged optics reached price parity with electrical SerDes at 400 Gbps, clearing adoption hurdles. Intel shipped 1.2 million modules after a 31% price drop. Broadcom’s 51.2 Tbps Tomahawk-5 matched the economics of 12.8 Tbps electrical ASICs, catalyzing hyperscale interest.[2]Broadcom Inc., “Investor Presentation 2025,” investors.broadcom.com Standardized 800 Gbps and 1.6 Tbps form factors from the Optical Internetworking Forum should push the curve further down.
Energy-Efficiency Mandates Favoring All-Optical Switching
Regulations under the European Green Deal and California Title 24 incentivize data center operators to reduce thermal overhead by removing electronic packet inspection stages. Operators in Germany, the United Kingdom, and France accelerated optical retrofits during 2025 to align with 2027 compliance deadlines. Similar policies are emerging across the Asia Pacific, creating a long-tail pull for energy-efficient optical fabrics.
Restraints Impact Analysis*
| Restraint | (~) % Impact on CAGR Forecast | Geographic Relevance | Impact Timeline |
|---|---|---|---|
| Persistent premium over electronic leaf-spine fabrics | -1.4% | Global, particularly in cost-sensitive enterprise and SMB segments | Short term (≤ 2 years) |
| Limited field expertise for multi-terabit optical fabrics | -1.1% | Global, acute in emerging markets and smaller service providers | Medium term (2-4 years) |
| Supply-chain exposure to III-V wafer shortages | -0.8% | Global, with highest impact in Asia Pacific and Europe | Short term (≤ 2 years) |
| Cyber-resilience certification lag for mission-critical users | -0.6% | North America, Europe, with spillover to government and BFSI sectors globally | Long term (≥ 4 years) |
| Source: Mordor Intelligence | |||
Persistent Premium Over Electronic Leaf-Spine Fabrics
At 100- and 200 Gbps port tiers, optical switches remain 35-50% more expensive than their electronic peers. Dell’Oro pegged a 32-port optical chassis at USD 47,000 versus USD 31,000 for an electronic equivalent in Q2 2025. Many mid-tier enterprises cannot absorb the three-year payback threshold cited by Arista Networks, slowing penetration outside hyperscale footprints.
Limited Field Expertise for Multi-Terabit Optical Fabrics
Few engineers possess hands-on experience with wavelength management or dispersion budgeting. Cisco reported that professional-services engagements for optical projects averaged 18 months, twice the duration of electronic upgrades.[3]Cisco Systems Inc., “Services Revenue Disclosure 2025,” investor.cisco.com Workforce surveys suggest that only 12% of North American network engineers can troubleshoot reconfigurable optical add-drop multiplexers, resulting in deployment delays.
*Our forecasts treat driver/restraint impacts as directional, not additive. The impact forecasts reflect baseline growth, mix effects, and variable interactions.
Segment Analysis
By Switching Technology: MEMS Pace Sets the Benchmark
MEMS technology accounted for 43.89% of the market in 2025 and is tracking a 10.62% CAGR through 2031. The optical switches market size for MEMS platforms is climbing as hyperscalers specify sub-millisecond reconfiguration for AI workload balancing. Calient’s 1,024×1,024 array, with insertion loss below 2.5 dB, illustrates how high-port-count MEMS is replacing spine routers in pods. Electro-optic lithium niobate variants target nanosecond-switching niches, mainly finance and defense, but their higher power draw curbs mainstream adoption. Thermo-optic devices are winning cost-sensitive metro contracts, while magneto-optic switches stay limited to quantum pilots. Patent filings grew 47% year over year, reflecting brisk R&D in actuation physics.
Second-order effects center on supply-chain shifts. Specialized MEMS fabs in Taiwan and South Korea offer design-to-production services, lowering entry barriers for startups and widening vendor choice for buyers. Compliance with IEC 61753 reliability protocols is now non-negotiable in Europe, spurring vendors to harden products for millions of daily cycles. Collectively, these dynamics entrench MEMS as the benchmark for future competitive benchmarking in the optical switches market.


By Port Count: Density Demands Propel 1×16+ adoption
The 1×8 cohort held a 36.71% revenue share in 2025, owing to broad adoption in access aggregation and test-and-measurement racks. Yet demand is rapidly tilting toward 1×16 and larger matrices, expanding at a 10.41% CAGR as hyperscale operators pursue spine-level mesh fabrics. Lumentum’s newly qualified 1×32 MEMS switch for Meta’s data-center refresh is emblematic. Lower tiers, such as 1×2 latching models, remain vital for protection schemes but generate less revenue.
High-density products enable optical circuit-switched overlays that offload elephant flows without engaging packet silicon, driving step-function latency gains. European research networks, for example, documented a 68% reduction in latency after inserting 1×64 arrays. Given these measurable advantages, large-port switches are expected to eclipse legacy counts before the end of the decade, reinforcing their strategic importance in the optical switches market.
By Data Rate: Above-400 Gbps Configurations Accelerate
Ports in the 100-400 Gbps band still delivered 39.67% of 2025 revenue, but momentum clearly favors the above-400 Gbps tier, posting a 10.47% CAGR. Next-wave ASICs from Broadcom and Coherent integrate 800 Gbps optical engines, removing the fiber-count penalty that hampered early adoption. The optical switches market share for ultra-high-speed ports will rise sharply as hyperscalers standardize on single-wavelength 800 Gbps links to fit AI cluster topologies.
Meanwhile, sub-40 Gbps ports persist mainly in legacy environments where incremental capex is preferable, and the 40-100 Gbps slice remains serviceable for metro backbones. Yet vendor roadmaps, IEEE 802.3ck compliance activity, and skyrocketing 1.6 Tbps test-gear orders indicate the center of gravity is moving inexorably upward in bandwidth.
By End-User Industry: BFSI’s Low-Latency Push
IT and telecom retained 47.88% of spending in 2025, but BFSI’s forecast 10.59% CAGR signals a strategic realignment. Major banks deployed optical circuit switches to shave microseconds from order routing and fraud analytics. JPMorgan Chase trimmed derivatives-execution latency by 23% after deploying optical fabrics in New York and London data centers. Manufacturing, healthcare, and government are also leaning on deterministic optics for robotics, genomics, and secure satellite links, respectively. These vertical-specific performance imperatives underscore why end-user diversification will continue to broaden the optical switches market.
Second-tier verticals such as media and retail are increasingly buying optical capacity for high-resolution streaming and campus-area networks. Though smaller individually, their aggregate demand supports a healthier long-tail vendor ecosystem, preventing over-reliance on hyperscale capex cycles.
By Application: Testing and Monitoring’s Fastest Track
Circuit switching contributed 41.24% of 2025 revenue and remains foundational for data-center and transport fabrics. Nevertheless, testing and monitoring lead growth at a 10.56% CAGR as operators instrument multi-terabit networks for closed-loop automation. Keysight’s 48% sales jump in optical-switch test systems during 2025 affirms the pivot toward instrumentation. Optical performance monitoring baked into switching silicon, such as Ciena’s WaveLogic 6, is blurring lines between active switching and telemetry.
Multiplexing and cross-connect use cases remain steady in metro and cable-landing stations, while niche requirements, such as quantum-safe protection switching, are emerging. Collectively, application diversity spreads risk and sustains continuous innovation within the optical switches market.
Geography Analysis
Asia Pacific generated 35.79% of global revenue in 2025, fueled by China’s quantum backbones, India’s 5G standalone buildouts, and Japan’s post-Olympic data-center boom. China Mobile connected 12 provincial quantum links with optical switches, aiming for 50-city coverage by 2028. Bharti Airtel’s optical fiber rollout across 18 metros reduced backhaul fiber requirements by 31%. South Korea’s 6G roadmap names optical switching as a terahertz fronthaul enabler, while Australia’s National Broadband Network committed AUD 1.2 billion (USD 804 million) to optical upgrades.
The Middle East is projected to grow at 10.51% through 2031 as Saudi Arabia and the United Arab Emirates localize cloud capacity. Saudi Telecom installed MEMS switches to underpin the NEOM smart-city backbone and real-time grid automation. Etisalat integrated optical fabrics into its 5G core, aiming for sub-5 ms latency for industrial IoT.
North America held roughly 30% of 2025 demand, anchored by USD 15 billion in hyperscale retrofits from Microsoft, Amazon, and Google. Europe accounted for nearly 22%, with German and French operators accelerating upgrades to meet energy-efficiency regulations. South America and Africa together contributed under 8%, but they received tailwinds from new spectrum allocations in Brazil and fiber corridor funding in Kenya. Regulatory frameworks, such as the EU’s Network and Information Security Directive 2 and a proposed U.S. FCC interoperability mandate, will shape regional adoption curves by standardizing security and compatibility baselines.


Competitive Landscape
The optical switches market is moderately concentrated: the top five vendors, Broadcom, Cisco, Huawei, Nokia, and Ciena, held roughly 52% combined 2025 revenue. Yet fragmentation is increasing as hyperscalers roll out proprietary fabrics and startups introduce niche photonics. Broadcom bought a stake in a Taiwan MEMS foundry to secure supply, while Cisco and Intel are codeveloping 1.6 Tbps co-packaged optics. Patent filings jumped 34% year over year, especially in China and South Korea, reflecting a land-grab for acousto-optic and thermo-optic IP.
Technical differentiation now hinges on switching speed, port density, and power per bit. Lumentum and II-VI battle on sub-10-ms MEMS actuation, whereas Ciena and Infinera promote coherent-optics integration to remove external transponders. New entrants such as Ayar Labs (chip-to-chip photonics) and Lightmatter (photonic AI processors) target white-space territories that challenge incumbent roadmaps. Standards work inside IEEE 802.3 for 3.2 Tbps and 6.4 Tbps Ethernet could reshuffle rankings by 2028, depending on which vendors execute volume silicon first.
Vendor go-to-market models are also evolving. Smaller companies like DiCon Fiberoptics and Sercalo leverage customization speed to win protection-switch and quantum-network contracts. Meanwhile, larger players double down on services, automation software, and vertical solutions to defend share. This interplay of scale, specialization, and integration will define competitive dynamics for the remainder of the decade.
Optical Switches Industry Leaders
Broadcom Inc.
Cisco Systems Inc.
Huawei Technologies Co. Ltd.
Fujitsu Ltd.
Juniper Networks Inc.
- *Disclaimer: Major Players sorted in no particular order

Recent Industry Developments
- December 2025: Broadcom completed a USD 320 million silicon-photonics expansion in Colorado, aiming for 2 million optical engines yearly by Q4 2026.
- November 2025: Huawei won a CNY 2.8 billion (USD 394 million) China Mobile contract to deploy MEMS switches across 47 provincial data centers.
- October 2025: Lumentum released a 1×32 MEMS switch with sub-5 ms reconfiguration, subsequently qualified by two hyperscalers.
- September 2025: Cisco and Intel committed USD 180 million to joint infrastructure for 1.6 Tbps co-packaged optics.


Global Optical Switches Market Report Scope
The Optical Switches Market Report is Segmented by Switching Technology (Electro-Optic Switching, Acousto-Optic Switching, MEMS-Based Switching, Magneto-Optic Switching, Thermo-Optic Switching, Other Switching Technologies), Port Count (1×2, 1×4, 1×8, 1×16 and Above), Data Rate (Up to 40 Gbps, 40-100 Gbps, 100-400 Gbps, Above 400 Gbps), End-User Industry (IT and Telecom, Government and Defense, Banking, Financial Services, and Insurance (BFSI), Manufacturing, Healthcare and Life Sciences, Other End-User Industries), Application (Circuit Switching, Testing and Monitoring, Multiplexing, Cross-Connects, Signal Monitoring, Other Applications), and Geography (North America, Europe, Asia-Pacific, Middle East and Africa, South America). The Market Forecasts are Provided in Terms of Value (USD).
| Electro-Optic Switching |
| Acousto-Optic Switching |
| MEMS-Based Switching |
| Magneto-Optic Switching |
| Thermo-Optic Switching |
| Other Switching Technologies |
| 1×2 |
| 1×4 |
| 1×8 |
| 1×16 and Above |
| Up to 40 Gbps |
| 40–100 Gbps |
| 100–400 Gbps |
| Above 400 Gbps |
| IT and Telecom |
| Government and Defense |
| Banking, Financial Services, and Insurance (BFSI) |
| Manufacturing |
| Healthcare and Life Sciences |
| Other End-User Industries |
| Circuit Switching |
| Testing and Monitoring |
| Multiplexing |
| Cross-Connects |
| Signal Monitoring |
| Other Applications |
| North America | United States | |
| Canada | ||
| Mexico | ||
| Europe | Germany | |
| United Kingdom | ||
| France | ||
| Russia | ||
| Rest of Europe | ||
| Asia-Pacific | China | |
| Japan | ||
| India | ||
| South Korea | ||
| Australia | ||
| Rest of Asia-Pacific | ||
| Middle East and Africa | Middle East | Saudi Arabia |
| United Arab Emirates | ||
| Rest of Middle East | ||
| Africa | South Africa | |
| Egypt | ||
| Rest of Africa | ||
| South America | Brazil | |
| Argentina | ||
| Rest of South America | ||
| By Switching Technology | Electro-Optic Switching | ||
| Acousto-Optic Switching | |||
| MEMS-Based Switching | |||
| Magneto-Optic Switching | |||
| Thermo-Optic Switching | |||
| Other Switching Technologies | |||
| By Port Count | 1×2 | ||
| 1×4 | |||
| 1×8 | |||
| 1×16 and Above | |||
| By Data Rate | Up to 40 Gbps | ||
| 40–100 Gbps | |||
| 100–400 Gbps | |||
| Above 400 Gbps | |||
| By End-User Industry | IT and Telecom | ||
| Government and Defense | |||
| Banking, Financial Services, and Insurance (BFSI) | |||
| Manufacturing | |||
| Healthcare and Life Sciences | |||
| Other End-User Industries | |||
| By Application | Circuit Switching | ||
| Testing and Monitoring | |||
| Multiplexing | |||
| Cross-Connects | |||
| Signal Monitoring | |||
| Other Applications | |||
| By Geography | North America | United States | |
| Canada | |||
| Mexico | |||
| Europe | Germany | ||
| United Kingdom | |||
| France | |||
| Russia | |||
| Rest of Europe | |||
| Asia-Pacific | China | ||
| Japan | |||
| India | |||
| South Korea | |||
| Australia | |||
| Rest of Asia-Pacific | |||
| Middle East and Africa | Middle East | Saudi Arabia | |
| United Arab Emirates | |||
| Rest of Middle East | |||
| Africa | South Africa | ||
| Egypt | |||
| Rest of Africa | |||
| South America | Brazil | ||
| Argentina | |||
| Rest of South America | |||


Key Questions Answered in the Report
What is the current value of the optical switches market?
The optical switches market is valued at USD 8.06 billion in 2026.
How fast is the market expected to grow?
It is forecast to register a 9.54% CAGR, reaching USD 12.71 billion by 2031.
Which switching technology leads revenue?
MEMS platforms led with 43.89% revenue share in 2025 and continue to expand fastest.
Which vertical is set to grow quickest?
BFSI is projected to post the highest growth, advancing at a 10.59% CAGR through 2031.
Which region will record the fastest expansion?
The Middle East is expected to grow at a 10.51% CAGR as sovereign data-center buildouts accelerate.
What are the main challenges facing adoption?
Upfront cost premiums and shortages of skilled optical-fabric engineers remain key hurdles.
Page last updated on:


