North America Data Center Networking Market Size and Share
Market Overview
| Study Period | 2020 - 2031 |
|---|---|
| Forecast Data Period | 2026 - 2031 |
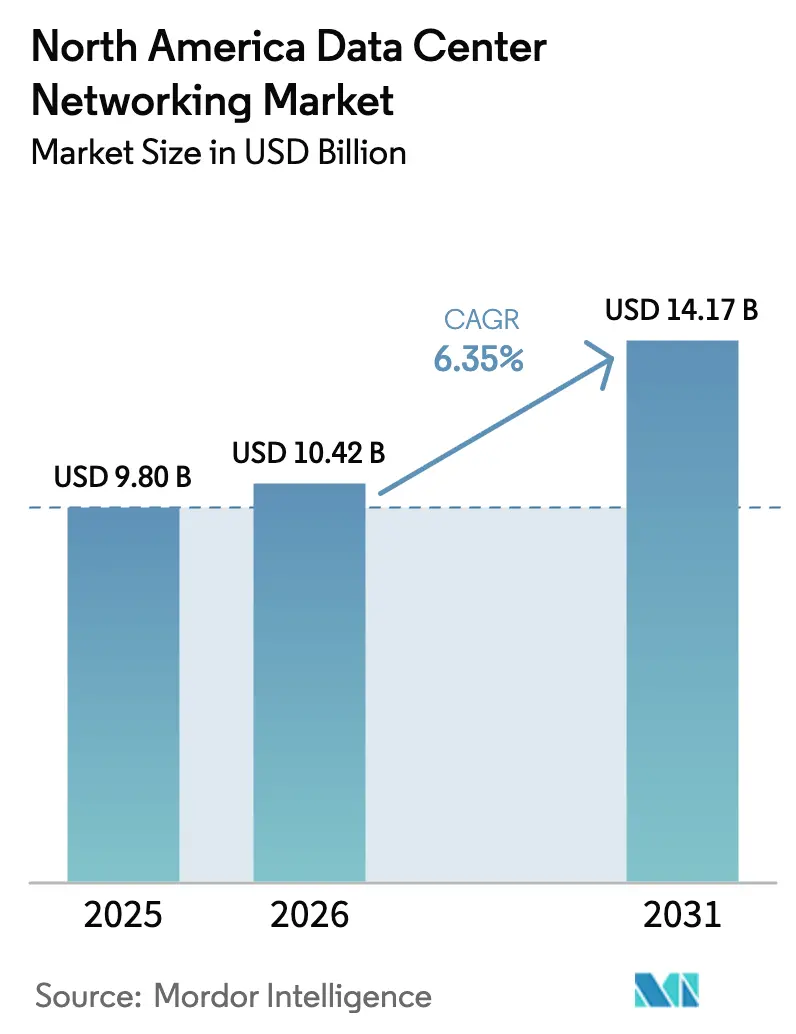
| Base Year Market Size (2025) | USD 9.8 Billion |
| Market Size (2026) | USD 10.42 Billion |
| Market Size (2031) | USD 14.17 Billion |
| Growth Rate (2026 - 2031) | 6.35% CAGR |
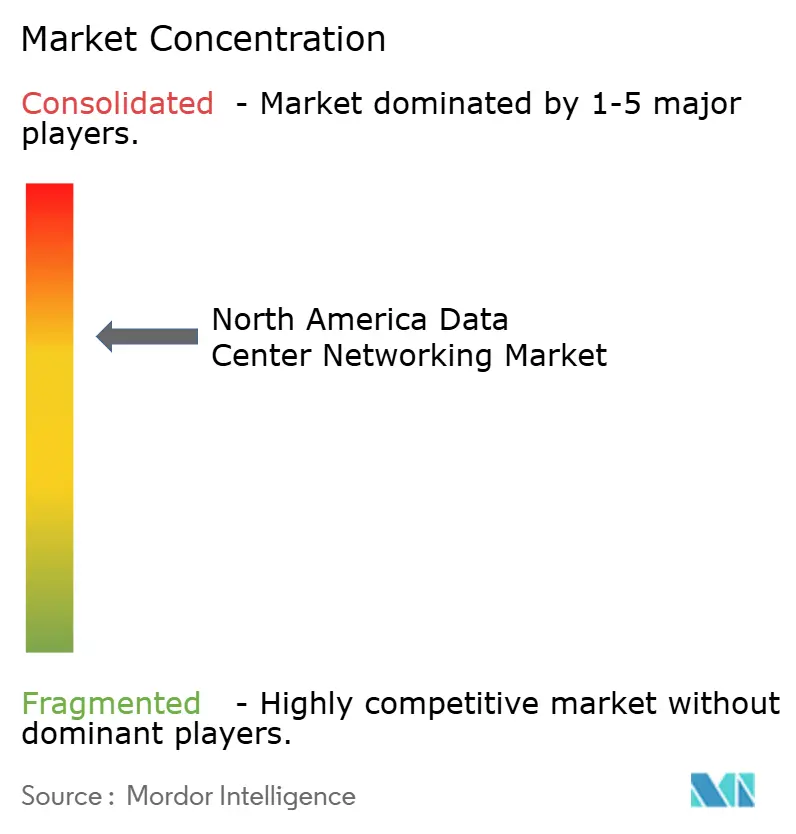
| Market Concentration | Medium |
Major Players *Disclaimer: Major Players sorted in no particular order Image © Mordor Intelligence. Reuse requires attribution under CC BY 4.0. | |
North America Data Center Networking Market Analysis by Mordor Intelligence
North America data center networking market size in 2026 is estimated at USD 10.42 billion, growing from 2025 value of USD 9.8 billion with 2031 projections showing USD 14.17 billion, growing at 6.35% CAGR over 2026-2031. Strong hyperscale investments, a rapid shift to AI-centric workloads, and the push for ultra-low-latency connectivity keep the region at the global forefront of data-center build-outs. Power-hungry AI training clusters, heightened cybersecurity demands, and the mainstreaming of 400 G/800 G Ethernet are reshaping spending priorities. Colocation remains the dominant deployment model, yet hyperscalers lead absolute capacity additions, while edge sites scale quickly to support 5G and IoT services. Vendors differentiate through silicon advances, open-network operating systems, and managed-service offerings that ease multicloud complexity for enterprises.
Key Report Takeaways
- By component, products commanded 71.25% of the North America data center networking market share in 2025; services are projected to expand at an 10.85% CAGR through 2031.
- By data-center type, colocation facilities led with 52.85% revenue share in 2025, while hyperscalers are set to advance at a 14.9% CAGR to 2031.
- By bandwidth, 50-100 GbE configurations accounted for 37.65% of the North America data center networking market size in 2025; links above 100 GbE are rising at a 12.7% CAGR.
- By end-user, IT & telecommunications held 36.90% share of the North America data center networking market size in 2025; healthcare is the fastest-growing segment at 8.85% CAGR.
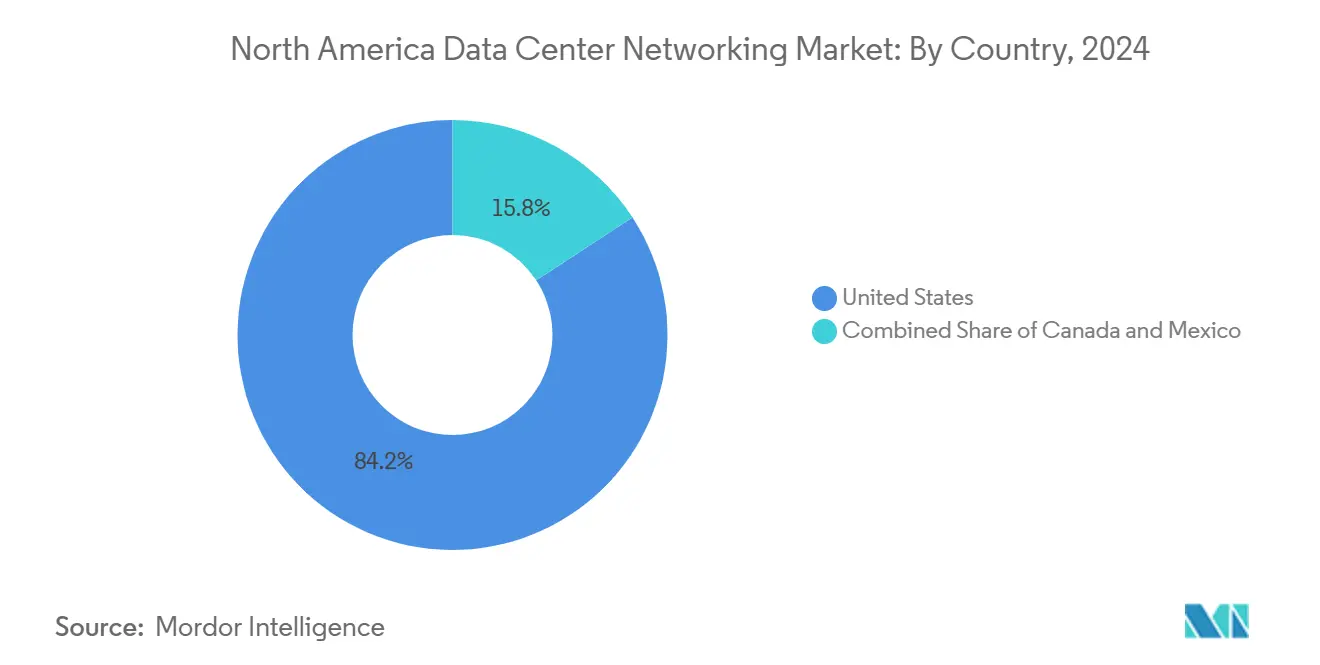
- By geography, the United States contributed 83.75% of the North America data center networking market share in 2025, whereas Mexico is forecast to accelerate at a 9.95% CAGR through 2031.
Note: Market size and forecast figures in this report are generated using Mordor Intelligence’s proprietary estimation framework, updated with the latest available data and insights as of 2026.
Proportional positioning is established by comparing regional contributions against the global total, including that of North america. The data center networking market share in our global report expresses these relative weights.
North America Data Center Networking Market Trends and Insights
Drivers Impact Analysis*
| Driver | (~) % Impact on CAGR Forecast | Geographic Relevance | Impact Timeline |
|---|---|---|---|
| Growing need for cloud storage and low-latency performance | +1.8% | US hyperscale corridors | Medium term (2-4 years) |
| Rising cybersecurity threats and network refresh | +1.2% | North America, EU enterprise cores | Short term (≤ 2 years) |
| AI/ML workloads demanding 400/800 GbE | +2.1% | US West Coast, expanding to Canada and Mexico | Medium term (2-4 years) |
| Edge data-center rollout alongside 5G | +0.9% | Metro areas across North America | Long term (≥ 4 years) |
| Utility-scale on-site generation | +0.7% | US Southwest and Texas renewables clusters | Long term (≥ 4 years) |
| State-level tax incentives | +0.5% | Washington, Georgia, Texas, select Canadian provinces | Short term (≤ 2 years) |
| Source: Mordor Intelligence | |||
AI/ML Workloads Driving Adoption of 400 G/800 G Switching
Demand for model training on thousands of GPUs has doubled the addressable network spend for AI fabric, pushing operators to jump from 100 G to 400 G and 800 G leaf-spine designs. Arista expects its AI-center networking revenue to reach USD 1.5 billion in 2025 as customers deploy ultra-low-latency Ethernet fabrics optimised for distributed learning. Broadcom’s 102.4 Tbps Tomahawk 6 silicon underpins next-generation switches that interconnect more than 1 million accelerators per cluster.[1]Broadcom Inc., “Introducing Tomahawk 6: 102 Tbps Ethernet Switching,” broadcom.com The Ultra Ethernet Consortium is finalising congestion-aware protocols that streamline all-reduce, all-gather, and collective ops typical in deep learning. Silicon photonics further narrows latency and power envelopes, with Taiwan’s foundry network emerging as a critical scale-out supply base.
Rising Cybersecurity Threats Prompting Network Upgrades
Zero-trust adoption has accelerated after CISA reported coordinated attacks on managed service providers that ripple through downstream tenants.[2]Cybersecurity and Infrastructure Security Agency, “Protecting Managed Service Providers,” cisa.gov Financial majors such as J.P. Morgan have rebuilt inter-data-center encrypted channels and refreshed firewalls to satisfy evolving compliance requirements. AI-based threat-detection engines now sit inline on core switches, allowing sub-second anomaly isolation. Healthcare operators extend these controls to edge pods carrying protected health information, incorporating chip-level secure boot and telemetry to meet HIPAA mandates.
Increasing Need for Cloud Storage and Low-Latency Application Performance
Global data creation is on pace to surpass 200 zettabytes by 2025, forcing enterprises to embrace latency below 1 ms for workloads such as trading, autonomous driving, and AR overlays. Storage fabrics are evolving toward 64 G Fibre Channel and NVMe-over-TCP, while spine-and-leaf layouts minimise hop counts and avert head-of-line blocking. Hybrid-cloud strategies amplify these requirements, demanding seamless performance between on-prem and public zones without sacrificing observability.
Edge Data-Center Proliferation Alongside 5G Roll-outs
American Tower has opened micro-sites delivering 1 MW of IT load inside macro-tower compounds, shaving last-mile latency for content caching and private-5G slices. Nokia’s alliance with Andorix shows telco-neutral real estate converging with edge compute for smart-building analytics. Typical edge halls span 500 kW–2 MW, use modular chillers, and tap carrier-hotel cross-connects to interlock with hyperscale regions.
Restraints Impact Analysis*
| Restraint | (~) % Impact on CAGR Forecast | Geographic Relevance | Impact Timeline |
|---|---|---|---|
| Network complexity and multi-vendor integration | -0.8% | Global hybrid clouds | Medium term (2-4 years) |
| High capex for 800 GbE optics and switches | -1.1% | North American hyperscalers | Short term (≤ 2 years) |
| Power-grid interconnection delays | -1.4% | US high-demand zones, extending into Canada | Long term (≥ 4 years) |
| Optical-transceiver supply shortages | -0.9% | Global fab networks, North American assembly lines | Medium term (2-4 years) |
| Source: Mordor Intelligence | |||
Power-Grid Interconnection Delays Lengthening Build Cycles
More than 2,600 GW of generation await grid interconnection in the United States, slowing data-center energisation by up to seven years in congested locales such as Northern Virginia.[3]Lawrence Berkeley National Laboratory, “Queued in: Interconnection Backlogs,” lbl.gov The backlog threatens 20% of planned facilities and could double Virginia’s electricity consumption by 2033. Operators respond by co-locating on-site renewables or adopting micro-grids; Google’s USD 20 billion programme pairs campuses with solar and wind parks that bypass transmission bottlenecks.
High Capex for Next-Gen Optics and 800 GbE Switches
A single 1U 16-port 800 G switch now lists north of USD 30,000, reflecting costly co-packaged optics and high-density ASICs. Lumentum warns that tight EML supply could persist into 2026 even as the firm targets USD 500 million quarterly optical revenue. Celestica’s DS4100 800 G top-of-rack platform underscores the premium paid to unlock 12.8 Tbps non-blocking bandwidth.
*Our forecasts treat driver/restraint impacts as directional, not additive. The impact forecasts reflect baseline growth, mix effects, and variable interactions.
Segment Analysis
By Component: Services Accelerate Despite Product Dominance
Products still account for 71.25% of the North America data center networking market, anchored by Ethernet switches, routers and optical interconnects that underpin hyperscale fabrics. Services, however, are forecast to climb at an 10.85% CAGR as firms outsource design, monitoring and lifecycle support to managed providers. Installation and integration tasks balloon with 400 G/800 G rollouts, while managed network services absorb operational complexity for enterprises lacking in-house skillsets. This pivot toward services echoes the rise of consumption-based models across IT infrastructure.
A maturing installed base amplifies demand for proactive maintenance and AIOps-driven troubleshooting. Training and consulting revenues also rise because AI fabric tuning and silicon-photonic deployments require specialised expertise. The North America data center networking market size for services is set to outpace products in incremental growth even though hardware will continue to dominate absolute spend.


By End-User: Healthcare Emerges as Growth Leader
IT and telecommunications dominate with 36.90% share of the North America data center networking market, reflecting constant backbone upgrades by cloud and content providers. Healthcare and life sciences record the fastest 8.85% CAGR owing to telehealth expansion, genomics data spikes and strict compliance mandates. Hospital groups now ingest petabyte-scale imaging datasets and rely on encrypted, ultra-reliable interconnects for remote surgery support.
Banking, financial services and insurance remain sizeable, modernising with all-photonic backbones that allow live core-system migrations under one-second downtime nttdata. Media & entertainment budgets climb with high-bit-rate streaming, while industrial firms upgrade to enable Industry 4.0 analytics at the edge. The North America data center networking industry thus touches every vertical seeking competitive differentiation through low-latency data flows.
By Data-Center Type: Hyperscalers Drive Future Growth
Colocation sites delivered 52.85% of 2025 revenue, catering to enterprises seeking pay-as-you-go footprints and carrier neutrality. Yet hyperscalers are scaling fastest at 14.9% CAGR, highlighted by AWS’s USD 11 billion Georgia build and Microsoft’s USD 80 billion multiyear campus plan. Operators are also deploying modular edge pods to support 5G densification, with capacities between 500 kW and 2 MW.
Hyperscalers’ dominance reflects the pivot to cloud-native architectures and AI platform launches requiring exascale bandwidth. Colocation keeps relevance through interconnection-rich campuses linking multiple clouds, while edge and micro-data-center models thrive near population clusters where milliseconds matter.

By Bandwidth: Ultra-High-Speed Transition Accelerates
Links in the 50-100 GbE range still comprise 37.65% of the North America data center networking market size, serving mainstream enterprise applications. Ports above 100 GbE exhibit a 12.7% CAGR as operators leapfrog directly to 400 G and 800 G fabrics. Arista’s 51.2 Tbps 7060X6 leaf and 460 Tbps 7800R4 spine exemplify this shift. Broadcom’s Tomahawk 6 further pushes bandwidth ceilings beyond 100 Tbps per chassis.
Legacy ≤ 10 GbE deployments continue to taper, while 25-40 GbE rolls forward as a midway refresh for mid-market operators reluctant to absorb the full capex of 400 G optics. Nonetheless, AI cluster economics increasingly make 400 G the new floor for greenfield builds.
Geography Analysis
The United States retains 83.75% of the North America data center networking market, underpinned by unrivalled hyperscale campus density, leading silicon ecosystems, and a deep talent pool. Northern Virginia added 391.1 MW in Q1 2024 capacity yet faces grid constraints extending energisation timelines to seven years. Federal and state incentives such as revived Washington sales-tax exemptions and Georgia’s equipment credits steer deployment patterns, while the Department of Energy highlights 16 prospective eco-efficient campus zones.
Mexico, while smaller in absolute spend, records the briskest 9.95% CAGR and is emerging as a Latin American interconnection hub. Querétaro hosts 65% of national capacity with 26 active builds, drawing USD 7 billion of new investment for 2023-2027. Cloud majors view the corridor as a nearshoring back-plane to US workloads and a stepping-stone to Spanish-speaking markets. Edgenet’s plan for 30 micro-facilities highlights the push toward nationwide low-latency coverage.
Canada leverages hydroelectric abundance to attract sustainable builds in Quebec and British Columbia. Provincial incentives and proximity to US demand pools position Canadian halls as disaster-recovery and AI inference spill-over sites. Partnerships such as Nokia-Andorix for private-5G edge mesh show the country aligning telco and data-center agendas.
Mordor Intelligence examines the data center networking market across diverse other regional markets as well, including Middle East, Asia, and Europe, while also offering granular country-level perspectives for Canada, United States, Italy, Germany, Norway, and Netherlands and more.
Competitive Landscape
Cisco holds a commanding but gradually eroding 76.13% share of core networking revenue, facing stiff AI-fabric competition from Arista (10.03%) and Juniper (7.27%). Arista’s CloudVision telemetry and super-spine leaf architecture appeal to hyperscalers, while Juniper’s AI-Native Portfolio claims 90% trouble-ticket reductions and 85% opex cuts through self-driving operations. Broadcom remains the silent king-maker, embedding Tomahawk silicon across multiple OEM lines.
M&A reshapes the field: Hewlett-Packard Enterprise is contesting a DOJ suit to seal its USD 14 billion bid for Juniper, aiming to fuse servers, storage, and networking into an open AI stack. White-box integrators such as Celestica and FS attack niche AI clusters with price-performance-optimised 800 G switches. Meanwhile, American Tower, Digital Realty, and Equinix attempt to blur lines between carrier hotels, edge colo, and regional cloud on-ramps, heightening the importance of neutral connectivity fabrics.
Despite moderate consolidation, innovation cycles run brisk: Broadcom’s 102.4 Tbps switch, Dell’s partner rebates for Z-Series, and Google’s renewables-coupled campuses all signal aggressive capex linked to AI economics and sustainability imperatives.
North America Data Center Networking Industry Leaders
Cisco Systems, Inc.
Juniper Networks, Inc.
Arista Networks, Inc.
Dell Technologies Inc.
Hewlett Packard Enterprise Company
- *Disclaimer: Major Players sorted in no particular order

Recent Industry Developments
- June 2025: Hewlett Packard Enterprise CEO Antonio Neri voiced confidence in prevailing over DOJ efforts to block HPE’s USD 14 billion acquisition of Juniper Networks; trial set for 9 July 2025
- June 2025: Broadcom introduced Tomahawk 6 Ethernet switching ASIC offering 102.4 Tbps throughput, calibrated for AI clusters of 1 million accelerators.
- May 2025: Arista posted USD 2.005 billion Q1 2025 revenue, up 27.6% YoY, citing booming AI network demand.
- May 2025: Juniper unveiled AIOps for edge-WAN, cutting trouble tickets by up to 90%.
- May 2025: MUFG Bank and NTT DATA completed live system migration between data centers 50-100 km apart with sub-second downtime using IOWN all-photonic backbone
- February 2025: Dell doubled partner incentives on PowerSwitch Z-Series sales into greenfield accounts.


Research Methodology Framework and Report Scope
Market Definitions and Key Coverage
Our study defines the North America data center networking market as the annual revenue generated by switches, routers, storage-area networking gear, application delivery controllers, software-defined networking controllers, optical interconnects, and associated integration and managed services that connect server, storage, and security nodes inside purpose-built colocation, hyperscale, edge, and enterprise data center facilities across the United States, Canada, and Mexico.
Scope exclusion: Temporary mobile server rooms, campus LANs, and networking hardware dedicated solely to test labs or R&D benches remain outside this scope.
Segmentation Overview
- By Component
- Products
- Ethernet Switches
- Routers
- Storage Area Network (SAN)
- Application Delivery Controllers (ADC)
- Network Security Appliances
- Software-Defined Networking (SDN) Controllers
- Optical Interconnects
- Services
- Installation and Integration
- Training and Consulting
- Support and Maintenance
- Managed Network Services
- Products
- By End-User
- IT and Telecommunications
- Banking, Financial Services and Insurance (BFSI)
- Government and Defense
- Media and Entertainment
- Healthcare and Life Sciences
- Manufacturing and Industrial
- Other End-Users
- By Data-Center Type
- Colocation
- Hyperscalers/Cloud Service Providers
- Edge/Micro Data Centers
- By Bandwidth
- Less Than equals to 10 GbE
- 25–40 GbE
- 50–100 GbE
- Greater than 100 GbE
- By Country
- United States
- Canada
- Mexico
Detailed Research Methodology and Data Validation
Primary Research
Interviews with data center architects, regional fiber carriers, network equipment channel partners, and certification consultants across all three countries helped validate bandwidth mix shifts, average selling prices, and deployment timelines. Surveys of facility operators added color on retrofit cycles and service uptake, confirming secondary signals before final triangulation.
Desk Research
We launched the exercise by screening public data sets from bodies such as the U.S. Energy Information Administration, Statistics Canada, Mexico's SCT, and trade groups like the Open Compute Project to size installed rack capacity and power draw. Supplementary insights were pulled from company 10-K filings, investor decks, patents logged on Questel, and customs shipment logs from Volza. Subscription sources, including D&B Hoovers for vendor financials and Dow Jones Factiva for deal flow, enriched trend baselines.
Our analysts next tagged macro drivers, cloud capex, 100 GbE port shipments, and data center real estate absorption; then extracted five-year historical series to anchor growth curves. The sources listed illustrate our coverage; many other documents informed checks, clarifications, and gap closes.
Market-Sizing & Forecasting
A top-down reconstruction converts government power-in-use statistics into live rack counts, applies verified port-density norms, and derives aggregate interface demand; selective bottom-up roll-ups of leading supplier revenues and sampled ASP × volume checks adjust totals. Key variables like cloud seat growth, 400 GbE penetration, average switch price erosion, hyperscale capex intensity, and rack power density drive the model. Multivariate regression with scenario analysis extends the forecast through 2030, while missing line items, for example, private edge pods, are imputed using proxy ratios agreed upon during expert calls.
Data Validation & Update Cycle
Outputs undergo three-layer reviews: automated anomaly scans, peer analyst cross-checks, and senior sign-off. Models refresh annually, and mid-cycle updates trigger when deals, regulations, or technology leaps materially shift any driver.
Why Mordor's North America Data Center Networking Baseline Commands Reliability
Published estimates often diverge because firms apply different product baskets, currency conversions, and refresh cadences. Our analysts disclose assumptions transparently, letting buyers trace every figure back to observable inputs.
Key gap drivers include whether passive cabling and power shells are bundled, how fast 100 GbE ports are expected to migrate toward 400 GbE, and whether services revenue is recognized at booking or over contract life. Divergences also stem from applying 2023 exchange rates versus rolling averages and from shorter update cycles that we maintain versus multi-year stale baselines elsewhere.
Benchmark comparison
| Market Size | Anonymized source | Primary gap driver |
|---|---|---|
| USD 9.80 B (2025) | Mordor Intelligence | - |
| USD 11.95 B (2024) | Global Consultancy A | Includes broader campus switches and counts full five-year service contracts upfront |
| USD 7.98 B (2024) | Trade Journal B | Excludes managed services and values hardware at factory gate prices only |
Taken together, the comparison shows that Mordor's disciplined scope selection, frequent refresh, and dual-side validation deliver a balanced, repeatable baseline clients can trust for planning and investment decisions.


Key Questions Answered in the Report
What is the current size of the North America data center networking market?
The market stands at USD 10.42 billion in 2026 and is forecast to climb to USD 14.17 billion by 2031 at a 6.35% CAGR.
Which component segment is growing fastest?
Services, spanning managed, integration and consulting offerings, expand at 10.85% CAGR as enterprises outsource complex AI-era network operations.
Why are 400 G and 800 G Ethernet ports gaining traction?
AI/ML training clusters need massive east-west bandwidth; 400 G/800 G fabrics cut training time and slash congestion, driving broad adoption.
How do power-grid delays affect new data-center builds?
Interconnection queues can prolong energisation to seven years in high-demand US regions, forcing operators to invest in on-site renewables and micro-grids.
Which country is the fastest-growing geography in North America?
Mexico leads with a projected 9.95% CAGR through 2031, driven by nearshoring, cloud investments and strategic locations like Querétaro.
Who are the leading networking vendors?
Cisco retains the largest share, but Arista, Juniper and white-box suppliers such as Celestica are capturing momentum through AI-optimised platforms.
Page last updated on:


