
United States Commercial Dishwasher Market Size and Share
Market Overview
| Study Period | 2020 - 2031 |
|---|---|
| Forecast Data Period | 2026 - 2031 |
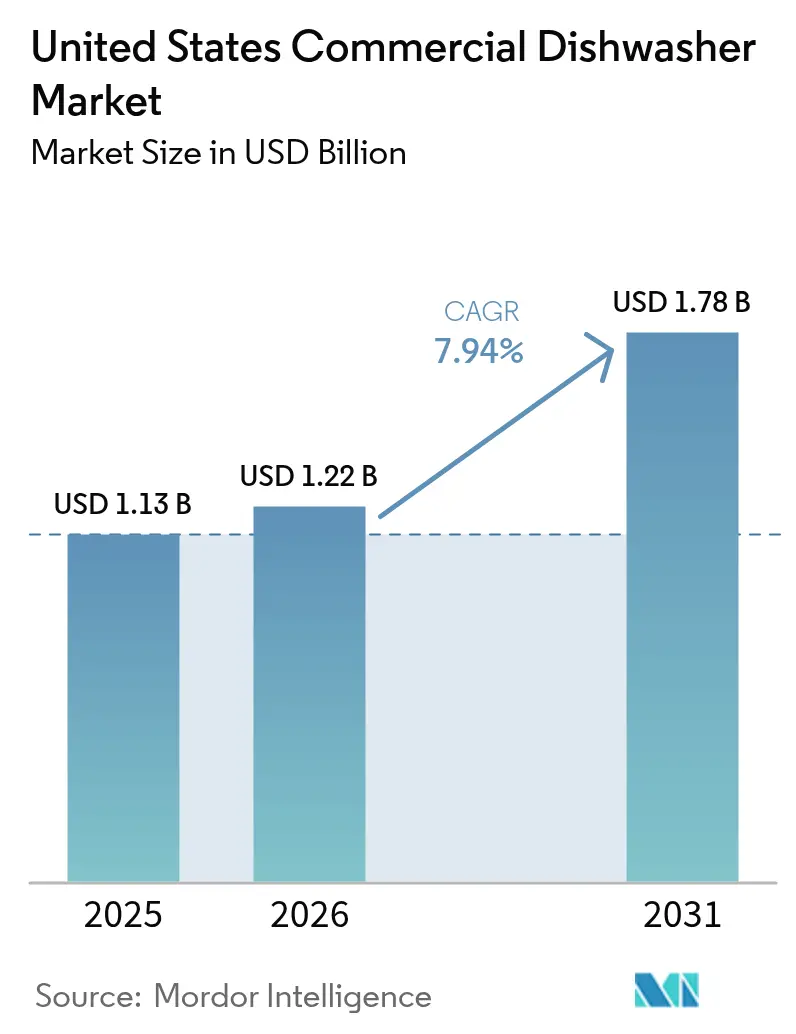
| Base Year Market Size (2025) | USD 1.13 Billion |
| Market Size (2026) | USD 1.22 Billion |
| Market Size (2031) | USD 1.78 Billion |
| Growth Rate (2026 - 2031) | 7.94 % |
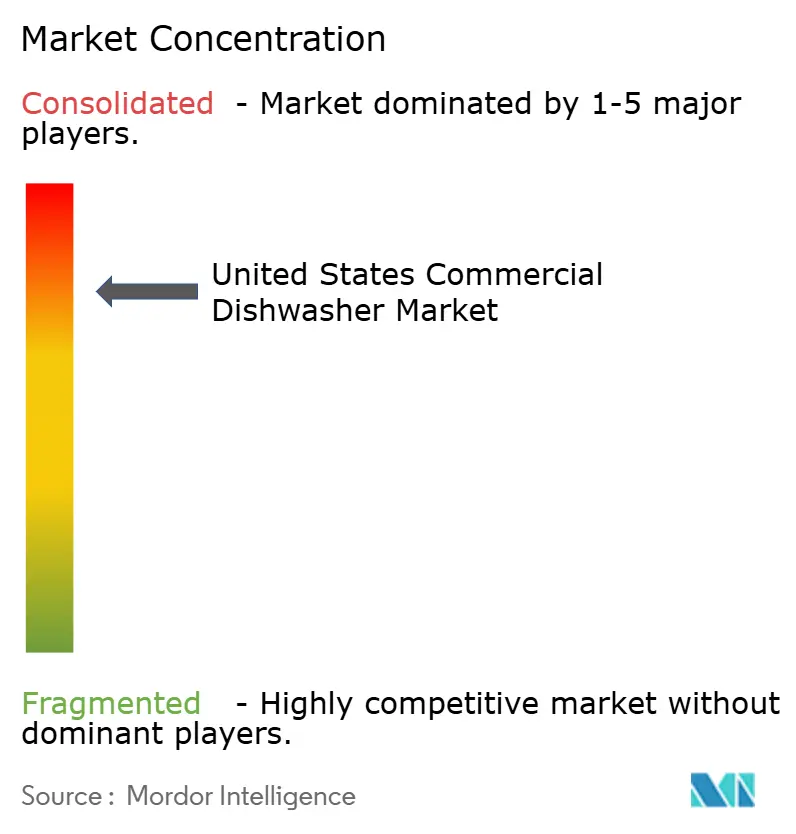
| Market Concentration | High |
Major Players *Disclaimer: Major Players sorted in no particular order Image © Mordor Intelligence. Reuse requires attribution under CC BY 4.0. | |
United States Commercial Dishwasher Market Analysis by Mordor Intelligence
The United States commercial dishwasher market size is expected to grow from USD 1.13 billion in 2025 to USD 1.22 billion in 2026 and is forecast to reach USD 1.78 billion by 2031 at 7.94% CAGR over 2026-2031. Operators continue to confront acute labor gaps that elevate automation from optional enhancement to operational necessity, and this same shortage pushes manufacturers to accelerate innovations that shrink cycle times while slashing manual tasks. Federal and state regulators compound momentum by tightening energy- and water-efficiency thresholds, effectively shortening replacement cycles and ensuring that high-performance models dominate new purchases.
Labor-saving automation emerges as the primary catalyst, with the National Restaurant Association reporting that 45% of operators need more employees to meet customer demand.[1]National Restaurant Association, “2024 State of the Restaurant Industry Report,” KRHA.ORG. A USD 1.1 trillion restaurant revenue base supplies the capital pool that keeps upgrades moving forward even amid margin pressures. Subscription contracts shift budgeting from capital expenditure toward predictable operating expense, broadening access to premium systems among independents. Digital connectivity further cements value by compressing downtime through predictive alerts, thereby maximizing revenue-generating hours. Collectively, these intertwined forces transform commercial dishwashers into strategic infrastructure that safeguards capacity, compliance, and cost control for every brand tier.
Key Report Takeaways
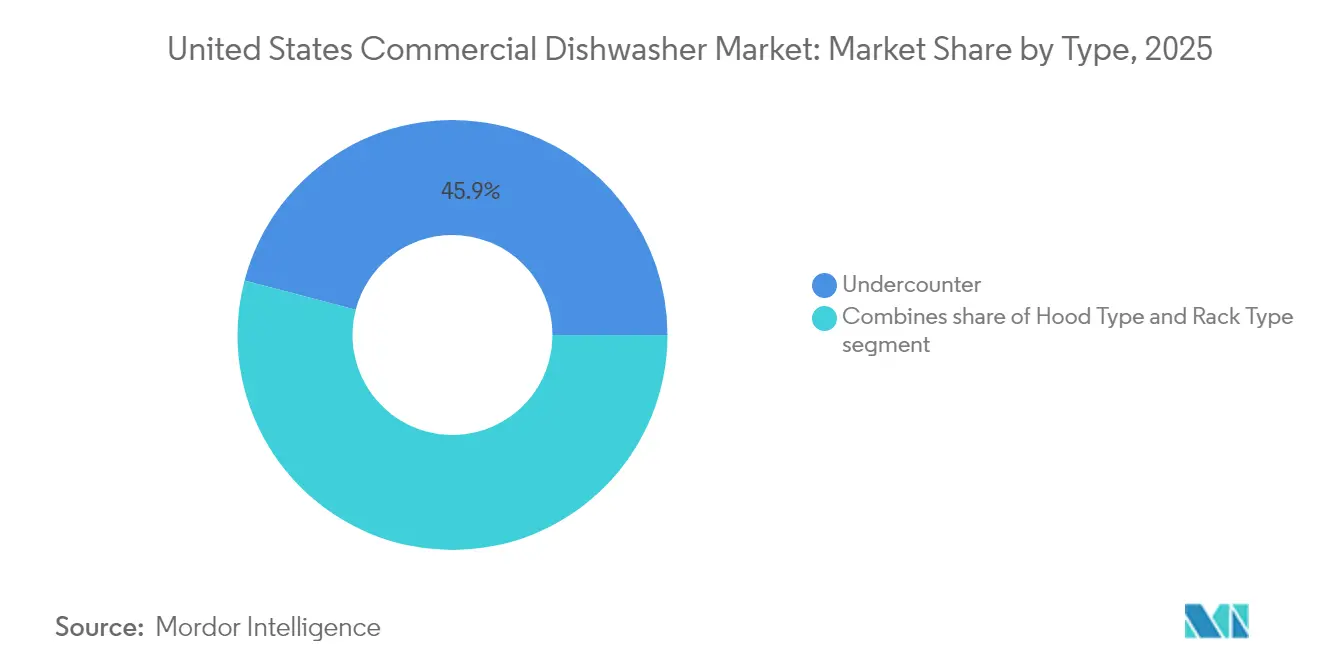
- By type, undercounter units captured 45.92% of United States commercial dishwasher market share in 2025, whereas rack-type machines deliver the fastest 8.07% CAGR through 2031.
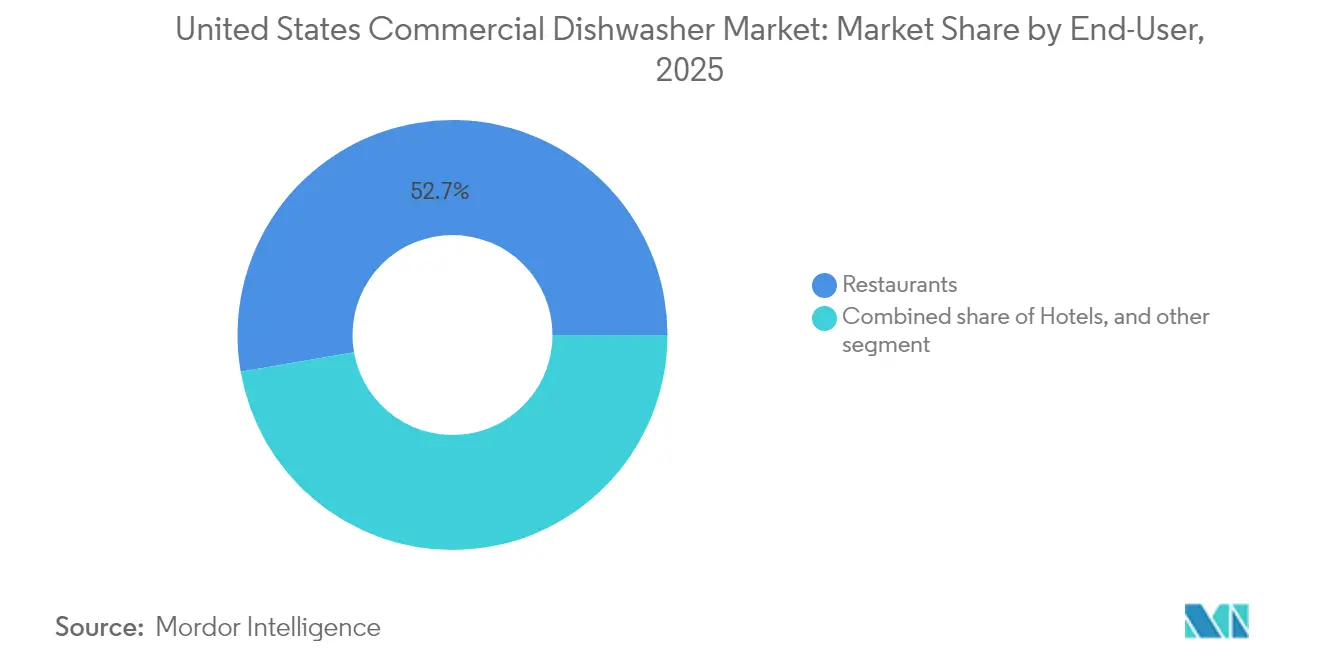
- By end-user, restaurants held 52.74% of the United States commercial dishwasher market size in 2025, while catering services lead growth at an 8.26% CAGR to 2031.
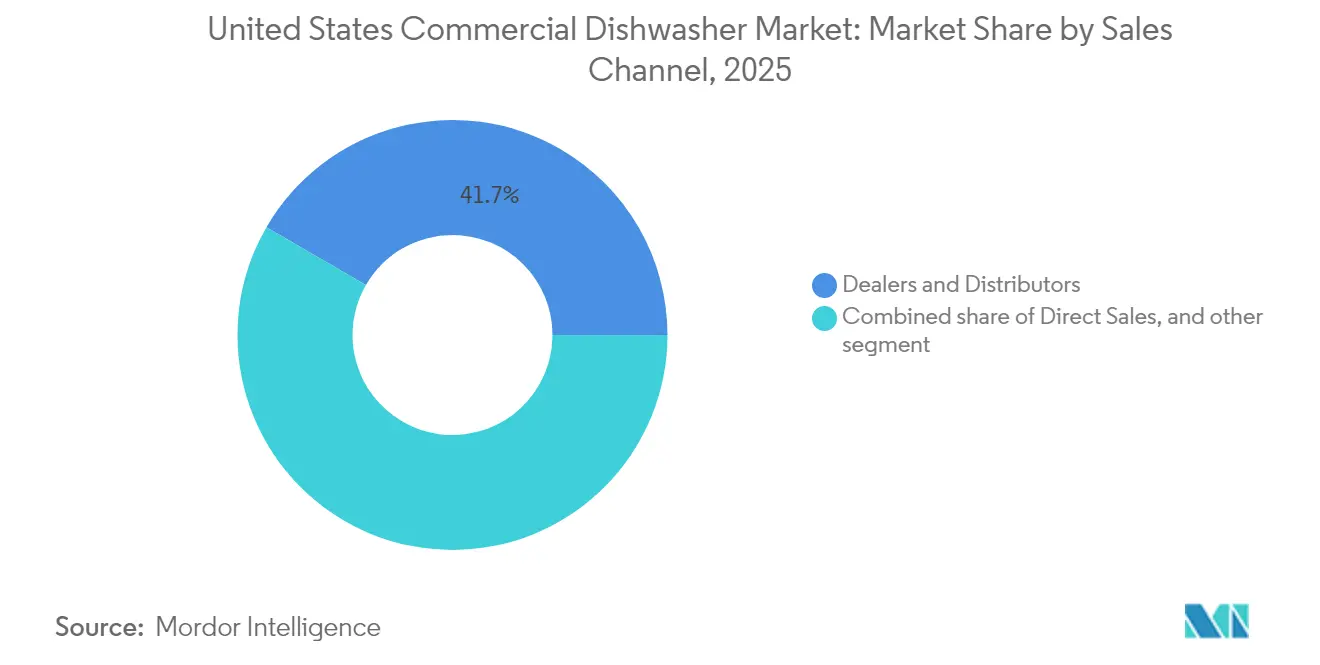
- By sales channel, dealers retained 41.65% share of the United States commercial dishwasher market in 2025, but online retail heads upward with a 9.38% CAGR throughout the forecast period.
- By geography, the South accounted for a 34.05% share of the United States commercial dishwasher market in 2025, and the West expanded fastest at a 8.31% CAGR to 2031.
Note: Market size and forecast figures in this report are generated using Mordor Intelligence’s proprietary estimation framework, updated with the latest available data and insights as of 2026.
United States Commercial Dishwasher Market Trends and Insights
Drivers Impact Analysis*
| Driver | (~) % Impact on CAGR Forecast | Geographic Relevance | Impact Timeline |
|---|---|---|---|
| Surge in labor-saving kitchen automation demand | +2.1% | National, highest in Northeast & West | Medium term (2-4 years) |
| Energy- & water-efficiency regulations (EPA ENERGY STAR) | +1.8% | National, rebate variations by state | Long term (≥ 4 years) |
| Growth of quick-service restaurant chains | +1.5% | National, suburban concentrations | Medium term (2-4 years) |
| Rising back-of-house IoT integration | +1.2% | National, led by chain groups | Long term (≥ 4 years) |
| Shift to ware-washing rental & subscription models | +0.9% | National, metro areas | Short term (≤ 2 years) |
| Increasing labor shortages in foodservice industry | +1.0% | National, especially in urban centers | Short to medium term (1–3 years) |
| Source: Mordor Intelligence | |||
Surge in Labor-Saving Kitchen Automation Demand
The United States commercial dishwasher market benefits directly from the persistent staffing crunch that leaves 45% of operators unable to meet demand. Automated pre-scrap removal, auto-load racks, and self-cleaning filters cut repetitive tasks that typically require two full-time employees in a busy shift. Hobart’s autoLINE system demonstrates tangible outcomes, posting 30% labor savings and 50% shorter cycles that translate into one additional table turn per meal period. Chain operators now write automation benchmarks into their equipment specifications, forcing suppliers to integrate labor-offset features as baseline standards rather than premium add-ons. Independent establishments, long constrained by space and budget, adopt compact automated units that fit beneath counters yet still achieve full NSF compliance. Increased throughput raises daily place-setting capacity, which improves seating efficiency and guest-turn metrics. This chronic workforce gap shows no sign of narrowing, so demand for labor-mitigating dishwashers remains structurally embedded throughout the forecast horizon. The momentum ensures at least two renewal cycles within the projection window, thereby reinforcing revenue resilience for manufacturers.
Energy- & Water-Efficiency Regulations (EPA ENERGY STAR)
Federal mandates effective in 2024 stipulate stringent limits on gallons per cycle and kWh per rack that remove outdated machines from legal operation.[2]U.S. Department of Energy, “Purchasing Energy-Efficient Commercial Dishwashers,” ENERGY.GOV. Operators swapping non-compliant units often realize lifetime utility savings exceeding USD 20,000, easily offsetting higher purchase prices within three years. ENERGY STAR labeling, once a marketing badge, functions today as a minimum qualification for institutional procurement, including all federal facilities. Utility rebates in California, New York, and Massachusetts reduce upfront cost by as much as 15%, magnifying payback speed for energy-recovery rack machines. Manufacturers race to embed heat-pump technology and multi-stage filtration systems that reclaim 90% of rinse water, delivering measurable environmental and cost benefits. Compliance pressure synchronizes replacement cycles nationwide, smoothing demand and reducing the boom-and-bust pattern that historically followed economic swings. Because regulators review thresholds every five years, engineering roadmaps anticipate even stricter 2029 requirements, creating a pipeline of future-ready products.
Growth of Quick-Service Restaurant Chains
The United States commercial dishwasher market gains scale through QSR expansion into second-ring suburbs where drive-through formats dominate. Chains typically standardize undercounter or hood-type equipment that slides neatly into modular kitchen pods, accelerating store openings by trimming design time. Centralized purchasing yields bulk discounts, giving suppliers with nationwide service networks an inherent edge. QSR operating rhythms demand 100-second wash cycles and immediate idle-mode readiness, conditions that older conveyor units cannot satisfy. High service volumes create large loads of trays and lightweight plastics that newer soft-touch jets handle without damage. As delivery and takeout contribute a higher proportion of transactions, dishwashers must also sanitize reusable packaging that many brands introduce to curb container waste. Franchisees favor vendors offering bundled preventive maintenance contracts, ensuring minimal service disruption. Overall, rapid QSR rollout fortifies baseline shipment volumes and strengthens long-term parts revenue for original equipment manufacturers.
Rising Back-of-House IoT Integration (Predictive Maintenance)
Connected architecture converts each dishwasher into a data node feeding performance dashboards, allowing kitchens to transition from reactive to predictive service models.[3]Hobart Corporation, “Food Service Technology, Food Equipment Engineering,” HOBARTCORP.COM. Sensors track cycle counts, temperature stability, and chemical dosing, pushing alerts to mobile apps that prompt pre-emptive action before breakdowns occur. Ecolab’s DishIQ platform links machines to cloud analytics that benchmark consumption versus peer locations, exposing inefficiencies worth up to USD 1,200 annually per store. Operators gain consolidated visibility across multi-unit chains, enabling asset managers to redeploy units or schedule fleet-wide retrofits with minimal downtime. Manufacturers monetize connectivity by selling tiered service subscriptions that guarantee replacement parts within 24 hours, translating into new recurring revenue. Data insights also inform iterative design improvements that shrink energy draw and water usage across successive product generations. Because connected devices seamlessly integrate with other kitchen systems, they pave the way for future closed-loop orchestration that optimizes labor, utilities, and workflow simultaneously.
Restraints Impact Analysis*
| Restraint | (~) % Impact on CAGR Forecast | Geographic Relevance | Impact Timeline |
|---|---|---|---|
| High upfront capital costs for advanced models | -1.4% | National, highest on independents | Short term (≤ 2 years) |
| Skilled technician shortage for maintenance | -0.8% | National, rural & secondary markets | Medium term (2-4 years) |
| Volatility in stainless-steel prices | -0.6% | National, all manufacturers | Short term (≤ 2 years) |
| Slow replacement cycle among small operators | -0.7% | National, especially in cost-sensitive regions | Medium to long term (2–5 years) |
| Source: Mordor Intelligence | |||
High Upfront Capital Costs for Advanced Models
Premium dishwashers featuring heat-recovery coils, dual filtration, and IoT modules cost at least 40% more than entry models, a gap that stretches owner finances during periods of compressed foot traffic. Independent restaurants seldom possess lines of credit comparable to chain operators, so they defer purchases until equipment failure becomes imminent, which can slow unit shipments. Lenders attach higher interest rates to hospitality borrowers, further inflating effective ownership cost. Cooperative purchasing groups mitigate some burden, but participation remains uneven across rural geographies. Dealers respond with promotional rebates that bundle free installation, yet service fees in later years can erode initial savings. Consequently, a portion of demand shifts to refurbished units that satisfy compliance without delivering top-tier efficiency, muting growth potential in the mid-range segment. Subscription pricing and government rebate programs partially counterbalance this restraint, but their adoption pace varies widely by state, leaving gaps where capital cost still hinders modernization.
Skilled Technician Shortage for Maintenance
Complex machines with high-pressure jets and integrated electronics require factory-trained personnel who understand both mechanical and digital diagnostics. However, vocational schools graduate too few technicians to meet rising service calls, particularly outside major metros. Average wait times for repairs in some rural counties now exceed 72 hours, forcing kitchens to revert temporarily to disposables that inflate operating costs. Manufacturers invest in virtual-reality training modules and remote assistance lines, yet those tools cannot replace hands-on expertise during component replacement. Extended downtime erodes operator confidence in adopting cutting-edge models perceived as sensitive to small malfunctions. Dealers prioritize chain clients, leaving independents vulnerable to longer queues, which in turn delays their decision to adopt advanced systems. Although self-diagnostic firmware reduces guesswork, it does not eliminate the need for skilled labor, so technician scarcity remains a material brake on accelerated penetration of sophisticated units.
*Our forecasts treat driver/restraint impacts as directional, not additive. The impact forecasts reflect baseline growth, mix effects, and variable interactions.
Segment Analysis
By Type: Compact Solutions Drive Market Evolution
Undercounter units command 45.92% share of the United States commercial dishwasher market in 2025, validating their role as the go-to solution for space-constrained kitchens that still demand commercial wash performance. Compact footprints as small as 24 inches enable installation beneath prep counters, maximizing back-of-house square footage, and integrated boosters maintain NSF sanitation despite cold-water inputs. Operators upgrading from three-sink setups gain immediate labor relief and consistent temperature control that manual sinks rarely achieve. Meanwhile, rack-type machines, though holding a smaller slice, post the fastest 8.07% CAGR, reflecting rising volumes at casual dining and high-school cafeterias that require 150-plus racks per hour throughput. Manufacturers equip these systems with variable-speed drives that adjust conveyor pace to load variation, eliminating energy waste during midday lulls. Hood-type machines retain loyal followings among mid-volume restaurants that appreciate pass-through ergonomics allowing seamless two-person operation. Collectively, these trends reinforce how ergonomics, energy savings, and space utilization determine buyer preference far more than headline cycle counts.
Rack-type growth reshapes the competitive field as emerging brands challenge incumbents with modular designs that fit through narrow doors and assemble on-site, reducing installation time by 30%. Energy-recovery modules capture exhaust heat to pre-warm incoming rinse water, trimming utility charges and advancing corporate sustainability goals. Auto-Chlor’s AC TALL Space Maker undercounter illustrates how manufacturers blend compact design with high-end filtration, saving 75% more space than legacy equivalents without sacrificing NSF compliance. Flight machines remain specialized to very high-volume sites, yet innovations such as dual-zone drying sections now open use cases in convention halls and sports arenas. The type hierarchy signals a sustained pivot toward solutions that deliver maximum racks-per-square-foot, a metric that now rivals initial cost in purchaser ranking criteria. In every configuration, the United States commercial dishwasher market continues to reward models that pair measurable operating savings with plug-and-play installation simplicity, cementing the strategic value of engineering that balances capacity, compliance, and compactness.



By End-User: Restaurant Dominance Faces Catering Surge
Restaurants generated 52.74% of the United States commercial dishwasher market size in 2025, leveraging industry sales of USD 1.1 trillion and employing 15.7 million workers to anchor baseline equipment demand. Chain operators replace units every six to eight years, keeping a steady flow of repeat orders that shelters suppliers during macro slowdowns. Full-service venues value cycle versatility that accommodates delicate stemware and heavy cookware within the same machine, pushing multiprogram controls to the forefront. Independents, conversely, gravitate toward rugged simplicity and serviceability, prioritizing uptime over premium features. Hotels, representing 18% of demand, integrate dishwashers into broader stewarding systems that include glass washers and pot-scrubbing tunnels. Although steady, hotel purchasing cadences align with renovation cycles, creating predictable yet infrequent spikes every seven to ten years.
Catering units advance at an 8.26% CAGR, outpacing all other segments as event activity rebounds and corporate gatherings shift back to in-person formats. Portable rack machines mounted on casters enable on-site dish turnaround at convention centers, reducing logistical costs tied to off-site washing. Seasonal demand means many caterers prefer rental contracts with guaranteed service swaps, a model that dovetails with emerging subscription offerings. Their workflows involve irregular surges, so high-capacity holding tanks that pre-heat rinse water during transport have gained popularity for lowering setup time. Café and bakery outlets, 11% of demand, use slimline machines that handle diverse bakeware without scorching bakery plastics, reinforcing niche opportunities for low-water-pressure jets. Altogether, end-user dynamics highlight how volume variability, labor mix, and service frequency dictate system selection, prompting manufacturers to diversify portfolios rather than chase one-size-fits-all designs.
By Sales Channel: Digital Disruption Reshapes Distribution
Dealers and distributors captured 41.65% of the United States commercial dishwasher market share in 2025, banking on decades-old relationships and extensive local installation teams that independents trust for turnkey set-ups. Showroom demos and live wash trials provide tactile proof that purely online catalogs cannot replicate, giving dealers a persuasive edge in high-ticket sales. They also facilitate financing by bundling equipment with service plans that roll into a single invoice. Direct sales, at roughly 35% share, cater primarily to QSR chains that demand standardized units across hundreds of stores, allowing manufacturers to optimize logistics and volume pricing. Factory account managers consult on kitchen layout and workflow to embed dishwashers into franchise blueprints early, making later substitution by competitors difficult.
Online retail advances at a 9.38% CAGR, energized by 3-D configurators, instant freight quotes, and crowdsourced reviews that demystify specification nuances for first-time buyers. Marketplaces publish live inventory and ship-date guarantees that appeal to operators facing unexpected breakdowns. Despite digital traction, most e-commerce orders still route through hybrid fulfillment, where local technicians handle delivery and hook-up, reflecting the equipment’s installation complexity. Some manufacturers pilot direct-to-operator portals that bypass traditional distribution, provoking dealer pushback yet underscoring inevitable channel evolution. Subscription models amplify digital’s influence because billing, diagnostics, and service dispatch all flow through cloud dashboards. Ultimately, channel share will hinge on whichever route best minimizes downtime, underscores compliance assurance, and delivers transparent total-cost-of-ownership metrics.
Geography Analysis
The southern United States reinforces its leadership within the United States commercial dishwasher market by aligning demographic momentum with favorable regulatory climates that accelerate restaurant development. Population inflow surpasses national averages, expanding food-service footprints and prompting chain operators to standardize high-efficiency ware-washing units across multiple formats. Florida’s tourism sector recovers faster than other states, and the demand spike for quick dish turnover translates directly into purchases of rapid-cycle rack machines. Texas cities extend permitting incentives that shorten build-out timelines, hastening equipment specification to earlier stages of design. Southern utilities promote efficiency through cash rebates that can reach USD 800 per ENERGY STAR unit, effectively bridging part of the premium price gap and catalyzing faster replacement of legacy systems.
Western operators, on the other hand, channel sustainability culture into measurable procurement requirements, thereby shaping a distinctive sub-market that leans toward heat-pump dryers and gray-water reclaim systems. California’s energy codes anticipate federal rulings, encouraging manufacturers to pilot cutting-edge technologies in West Coast test beds before rolling them nationwide. The region’s high-density urban cores magnify the value of dishwashers capable of squeezing full-size racks into 24-inch cabinets, an innovation proliferating through boutique coffee chains. Widespread acceptance of remote monitoring stems from the broader technology ecosystem, making IoT-ready models the default specification rather than optional upgrades.
The Northeast’s restaurant landscape prioritizes kitchen retrofits that free seating capacity, prompting operators to swap bulky stationary sinks for slim pass-through units that turn racks in under 60 seconds. Legacy buildings often impose electrical constraints that necessitate low-amp units with built-in boosters, spurring a specific niche within manufacturer portfolios. Institutional contracts across Ivy League universities pursue sustainability targets that require energy-recovery dishwashers, influencing bulk tenders whose volumes sway annual shipment tallies. Midwestern demand pivots around large industrial campuses, healthcare systems, and state universities that renew long-term service agreements every five years, anchoring conveyor machine volumes. The region’s central logistics location further stabilizes lead times for replacement parts, reinforcing operator confidence in sophisticated, sensor-rich models.
Regulatory Landscape
The US commercial dishwasher market operates under a dual compliance framework spanning energy and sanitation. On the energy side, the US Department of Energy issued amended dishwasher energy conservation standards with a direct final rule effective August 22, 2024, and mandatory compliance on and after April 23, 2027, which pushes manufacturers and operators to align replacement and product roadmaps to the 2027 deadline. In parallel, the EPA ENERGY STAR Commercial Dishwashers Version 3.0 specification (effective since July 27, 2021) functions as a widely used performance benchmark across undercounter, stationary single-tank door, pot/pan/utensil, conveyor, and flight-type machines, and it is reinforced by federal procurement rules that direct agencies toward ENERGY STAR-qualified or FEMP-designated equipment.
Sanitation and performance compliance is anchored by NSF/ANSI 3 for commercial warewashing equipment, including minimum bacterial reduction requirements and final rinse temperature thresholds (165 F for stationary single-temp rack machines and 180 F for other types). The NSF/ANSI 3:2023 revision adds new testing and performance requirements, including for soil redeposition, rinseability, and bottle-washing functionality, which creates an additional certification transition item for manufacturers and importers. Together, DOE, EPA ENERGY STAR/FEMP procurement, and NSF/ANSI 3 shape product design priorities (water and energy consumption, idle energy controls, and validated sanitization performance) and influence purchasing specifications for institutional and chain operators.
Value Chain Analysis
The value chain runs from raw materials and key components (notably stainless steel, pumps, valves, heaters/boosters, and sensors/controllers) to assembly by OEMs and contract manufacturers, with compliance and test certification (NSF/ANSI) serving as a prerequisite for market access. Go-to-market routes are led by foodservice equipment dealers and distributors, independent manufacturers representatives (including MAFSI-member networks), and direct OEM sales for chain accounts, with installation and commissioning typically tied to local service capability. Aftermarket service and parts distribution is a critical economic layer given uptime requirements and the technician constraints highlighted in the market context, and OEM service programs plus specialized servicers support preventive maintenance, repairs, and chemical integration where applicable.
In 2026, supply-side friction points centered on trade and import compliance and cost pass-through. A NAFEM manufacturer survey identified tariffs as the top business challenge, with most respondents reporting negative impacts and many passing costs to customers, which reinforces sourcing diversification and near/reshore evaluation across the equipment supply base. Separately, port-of-entry compliance and documentation quality, especially around NSF/ANSI standard proof, emerged as a practical bottleneck in the import leg of the chain. This raises the value of embedding certification documentation and conformity checks earlier in procurement rather than treating them as a post-arrival step.
Competitive Landscape
Market concentration remains moderately high, with Hobart maintaining a dominant position in the U.S. commercial dishwasher market. Its strong lead gives the brand significant scale advantages in both manufacturing efficiency and nationwide service coverage. Jackson WWS, CMA Dishmachines, and Champion/Moyer Diebel collectively vie for mid-market customers by tailoring packages that integrate chemical supply and preventive maintenance into finance leases. Smaller innovators exploit white spaces through niche engineering, such as high-clearance hood machines that accept oversized cookware favored by farm-to-table kitchens. Subscription agreements differentiate up-and-coming vendors that lack extensive dealer networks but excel in digital customer support, underscoring how service models weigh as heavily as hardware specs.
Technology leadership manifests through IoT ecosystems like Hobart SmartConnect, which funnels machine telemetry to cloud dashboards, allowing centralized asset management across multistate chains. Ecolab leverages its chemical distribution infrastructure to introduce DishIQ, merging detergent dosing data with performance metrics to optimize operating costs. Competitive intensity now hinges on the ability to turn datasets into actionable operational insights rather than solely on gallons per rack or cycles per hour. Price competition persists in entry-level segments; however, total-cost-of-ownership calculations increasingly favor premium units once utility savings and uptime metrics enter procurement evaluations.
Strategic partnerships surface frequently as equipment makers ally with POS and kitchen-display system vendors to craft unified data platforms. Manufacturers keen to maintain share invest in regional training academies that address technician shortages while deepening dealer loyalty. Aftermarket parts programs grow in importance, contributing double-digit percentages of operating profit and strengthening customer lock-in. Over the forecast period, consolidation among mid-tier players is probable as rising R&D costs and regulatory compliance burdens favor entities with scale to absorb investment. Such consolidation would likely elevate the market concentration score by two points if the top five suppliers together surpass an 80% threshold.
United States Commercial Dishwasher Industry Leaders
Hobart (ITW)
Jackson WWS
CMA Dishmachines
Champion / Moyer Diebel
Meiko USA
- *Disclaimer: Major Players sorted in no particular order

Market Opportunities and Future Outlook
Dishwasher-as-a-service and subscription-led procurement remain a clear whitespace for independents and smaller multi-unit operators facing the report-identified barrier of premium systems costing materially more than entry models. The same connectivity trend described in the market context, including fleet visibility, alerts, and service dispatch workflows, supports pay-per-wash and uptime-guaranteed offerings when the OEM or service partner bundles equipment, monitoring, chemicals (where applicable), and maintenance into operating expense. The model also fits caterers and other variable-volume users who prioritize rapid swap-outs and predictable service response over ownership, while dealers and service organizations can differentiate through bundled preventive maintenance contracts and digitally managed dispatch.
Regulatory and standards transitions also support targeted upgrade and product-development activity rather than relying on generic replacement demand. The DOE compliance date of April 23, 2027 increases the value of upgrade paths that reduce energy and water consumption for installed fleets, while federal procurement rules tied to ENERGY STAR-qualified or FEMP-designated units sustain a defined channel for compliant equipment. On the sanitation side, NSF/ANSI 3:2023 adds explicit momentum for multi-purpose or dedicated bottle-washing functionality, aligning with foodservice efforts to expand reuse and improve sanitization consistency for reusable containers and specialty items. Intertek-issued standards update notices around the 2023 revision further point to how certification-ready designs and test support can accelerate adoption when buyers require validated performance.
Recent Industry Developments
- June 2026: CMA Dishmachines released documentation for its CMA Water Softener System, a non-electric, twin-tank water treatment add-on positioned for use across undercounter, door-type, and conveyor installations. The launch targets a persistent operating pain point in hard-water regions, helping protect wash performance and reduce scale-related downtime, which also supports service-plan attach rates for dealers and servicers.
- February 2026: Hobart unveiled a next-generation hood-type warewasher range positioned around performance and efficiency improvements, including energy-smart features. The refresh reinforces how OEM product cycles are aligning to tighter energy and water thresholds and to operator payback calculations that increasingly factor utility costs alongside labor.
- March 2024: Hobart introduced the CL Conveyor Type commercial dishwasher line with automation and energy-recovery features for high-volume operations. The conveyor update strengthened the competitive benchmark for throughput-focused segments such as institutional dining and large restaurants, where cycle time and repeatable sanitization drive purchase decisions.


Research Methodology Framework and Report Scope
Market Definition and Coverage
For this study, the market covers revenue generated from commercial dishwashers sold and installed for professional kitchens in the United States, across common foodservice and institutional settings, and including related standard equipment configurations that enable commercial warewashing.
Scope exclusions: We exclude residential dishwashers and routine consumables such as detergents, rinse aids, and general-purpose spare parts sold as standalone items.
Segmentation Overview
- By Type
- Hood Type
- Under Counter
- Rack Type
- By End-User
- Hotels
- Restaurants
- Catering Units
- Cafes & Bakeries
- By Sales Channel
- Direct Sales
- Online Retail
- Dealers and Distributors
- By Region
- Northeast
- Midwest
- South
- West
Data Sources, Market Sizing, and Validation
Desk Research
Desk research starts by mapping the demand pool for commercial kitchens, then linking it to replacement activity and new build installations. Public sources such as the US Census Bureau (Business Patterns and construction data), the Bureau of Labor Statistics (foodservice employment signals), the US Energy Information Administration (commercial energy trends), and DOE and EPA programs that publish efficiency rules and water related benchmarks are used to ground the operating context.
We also review non-paywalled association and standards material, including NSF sanitation related standards references and foodservice industry association publications, since these often clarify what equipment is required in real kitchens. Company filings, product catalogs, distributor websites, and reputable trade press are then used to cross-check product positioning, typical price bands, and shipment timing. Select paid subscriptions for company financials, news and financials, and patent databases were used to fill gaps where public disclosures were limited. The sources listed here are illustrative, and other public and paid references were used alongside them for validation and clarification.
Primary Interviews and Surveys
Primary work focused on expert interviews and structured surveys with manufacturers, distributors, service and maintenance providers, and commercial kitchen buyers, so that pricing and replacement assumptions could be tested against field experience. Since this is a United States market, we covered demand conditions across major census regions and different kitchen formats, and we rechecked any large variances through follow-up calls.
Distribution of primary research fieldwork respondents
| Company type | Respondent position |
|---|---|
| Top tier: 36% | CXOs: 16% |
| Mid tier: 44% | Functional/Unit leaders: 27% |
| Smaller Players: 20% | Managers: 57% |
Market-Sizing & Forecasting
Sizing begins with a top-down build that reconstructs the addressable installed base in professional kitchens, then applies replacement cycles and new outlet additions to arrive at annual demand value. To keep the estimate realistic, the model is anchored on observable inputs, such as counts of foodservice establishments, new restaurant and hospitality openings, replacement timing driven by downtime and sanitation needs, and the share shift toward higher efficiency machines linked to energy and water rules.
Once the demand pool is formed, it is converted into value using typical selling price ranges by machine class and purchasing route, and then adjusted for mix changes consistently mentioned in interviews. This includes growth in under-the-counter units for smaller formats and steady demand for rack and hood types in higher throughput kitchens. Selective bottom-up checks are used as a cross-verify step, including sampled ASPs multiplied by unit demand for a set of common machine types, plus distributor channel checks on order patterns. Where coverage is thin for smaller buyers or independent channels, gap handling is done through conservative penetration assumptions, then verified during primary calls.
For the forecast, we use scenario analysis tied to macro and sector variables, including food-away-from-home activity, commercial construction starts for kitchens, labor availability which pushes automation, and expected efficiency-driven replacement. The final growth path is selected after reviewing the variable outlook with industry respondents, then reconciled against observed cycle behavior in the market.
Data Validation & Update Cycle
Outputs are checked in multiple passes so the final numbers do not rely on a single assumption. We compare the modeled value against independent signals, such as the implied unit demand trend, price progression logic, and whether the replacement rate is reasonable for the installed base size. If a jump is seen in any year, it is traced back to the driver inputs, then rechecked with respondents or public indicators before sign-off.
Before publication, the model and assumptions are reviewed by another analyst to catch inconsistencies, unit errors, and any scope slips. Reports are refreshed annually, and interim updates are made when a material event occurs, such as a major regulation change or an unexpected demand shock. Right before delivery, a fresh scan is performed so clients receive the latest updated view.
Mordor Intelligence's United States Commercial Dishwasher Market Size Measured Against Other Published Estimates
Published market sizes for commercial dishwashers in the United States can differ even when publishers appear to cover the same scope. The main reasons are usually scope boundaries, the base year used, and how pricing and replacement timing are converted into yearly revenue.
The table reflects a spread that is often driven by what gets counted as a commercial dishwasher sale versus adjacent categories. It also differs based on whether an estimate follows an installed-base replacement view or a broader shipments approach. Some publishers publish a North America number and readers later treat it as US-only, while others may mix in glasswashers or service revenue, which can move the value quickly. The table points to one key scope difference, and in Mordor Intelligence's model only commercial dishwashers sold into US professional kitchen end users are counted in the market value, without adding detergents, rinse chemicals, or ongoing service contracts.
Benchmark comparison
| Source | Market Size | Gaps in Research Methodology |
|---|---|---|
| Mordor Intelligence | USD 1.13 B (2025) | |
| Industry Research Publisher A | USD 0.66 B (2024) | The figure is presented at a North America level and the year is not clearly tied to a US-only base case in the public summary, which can understate or mis-allocate value when compared with a US-only revenue model. |
| Industry Research Publisher B | USD 2.50 B (2024) | This estimate is discussed under a broader commercial dishwasher and glasswasher framing and uses a regional split view, which can lift totals if adjacent equipment categories are included and if pricing is generalized across regions. |
After aligning for geography, product boundary, and year, most of the gap becomes explainable, and the remaining difference typically comes down to how ASP changes and replacement cycles are treated. With the scope and conversion steps kept explicit, buyers can trace each driver back to a demand signal and rerun the logic when new information becomes available.


Key Questions Answered in the Report
What is the 2026 value of the United States commercial dishwasher market?
The market is valued at USD 1.22 billion in 2026.
How fast will the market grow through 2031?
It is set to expand at an 7.94% CAGR through 2031.
Which product type holds the largest share today?
Undercounter units lead with a 45.92% share in 2025.
Which region is expanding most quickly?
The West registers the fastest 8.31% CAGR through 2031.
What is the main factor driving adoption of advanced dishwashers?
Persistent labor shortages push operators toward automated, high-efficiency systems.
How are upfront capital barriers being mitigated?
Subscription and rental models convert large upfront costs into predictable monthly fees.
Page last updated on:


 Your data is secure and never sold or shared.


