Commercial Kitchen Appliances Market Size and Share
Market Overview
| Study Period | 2020 - 2031 |
|---|---|
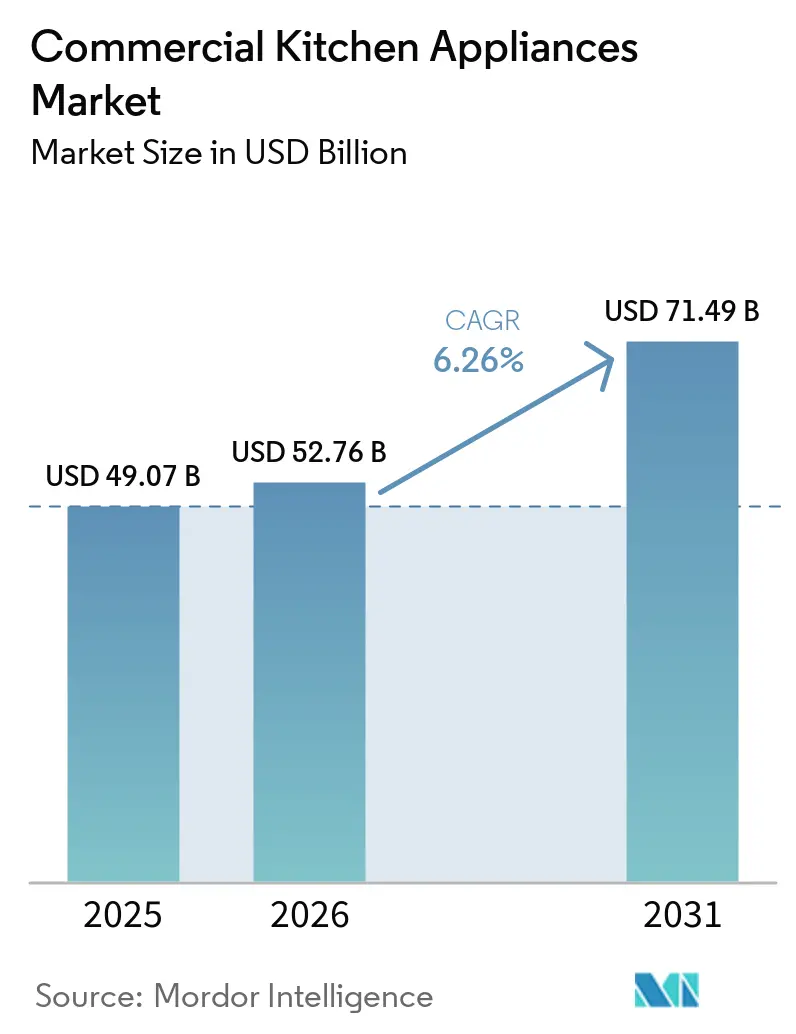
| Market Size (2026) | USD 52.76 Billion |
| Market Size (2031) | USD 71.49 Billion |
| Growth Rate (2026 - 2030) | 6.26% CAGR |
| Fastest Growing Market | Asia Pacific |
| Largest Market | North America |
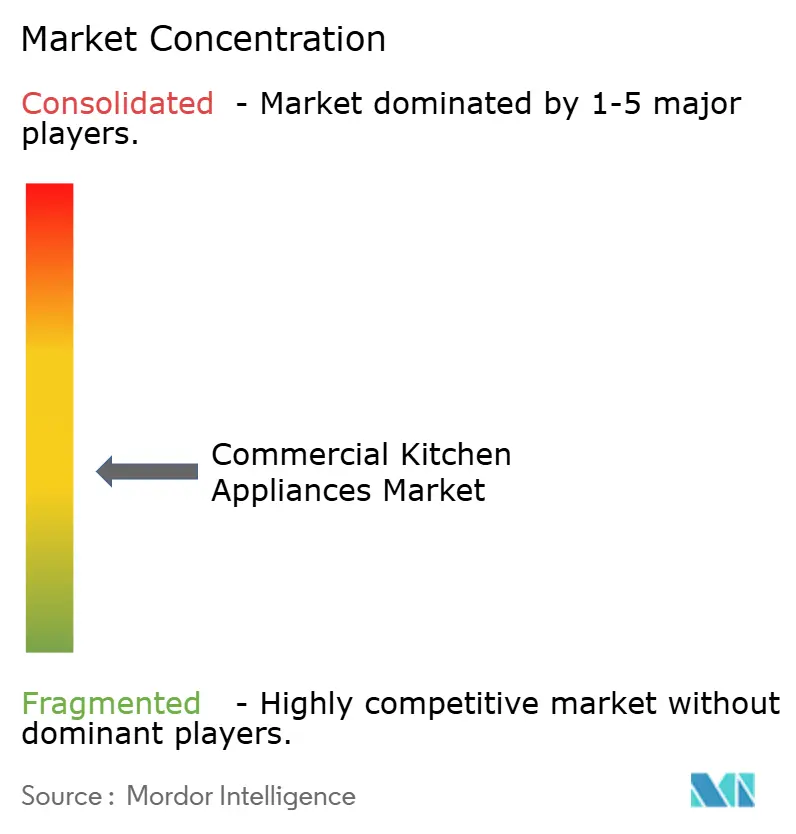
| Market Concentration | Medium |
Major Players *Disclaimer: Major Players sorted in no particular order Image © Mordor Intelligence. Reuse requires attribution under CC BY 4.0. | |
Commercial Kitchen Appliances Market Analysis by Mordor Intelligence
The commercial kitchen appliances market size was valued at USD 49.07 billion in 2025 and is estimated to grow from USD 52.76 billion in 2026 to reach USD 71.49 billion by 2031, at a CAGR of 6.26% during the forecast period (2026-2031). Operators continue to replace legacy setups with multifunctional, connected appliances that reduce space, lower energy costs, and sync with centralized order and service platforms, which is shifting capital allocation away from single-function equipment. Expansion programs by leading quick-service chains remain a strong demand anchor as chains scale standardized, IoT-ready back-of-house systems that raise throughput and compress labor per transaction. In parallel, the fastest-growing application segment is cloud and ghost kitchens, which are on track for a 10.32% CAGR through 2031 as delivery-first formats favor compact, high-throughput cooking, holding, and refrigeration platforms. Distribution models are also evolving as large chains shift to direct procurement to secure volume pricing and bundled lifecycle services, supporting higher resilience to regulatory and supply changes.
Key Report Takeaways
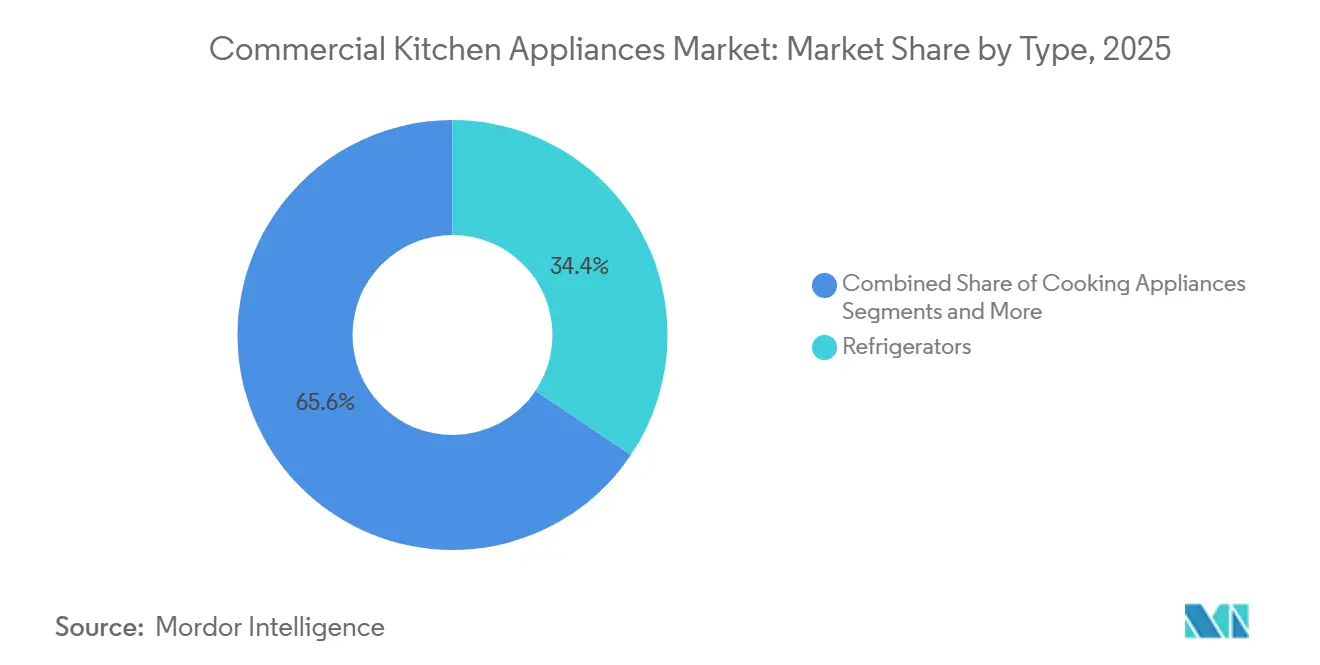
- By type, refrigerators accounted for a 34.36% share of the commercial kitchen appliances market size in 2025, while cooking appliances are forecast to expand at an 8.24% CAGR through 2031.
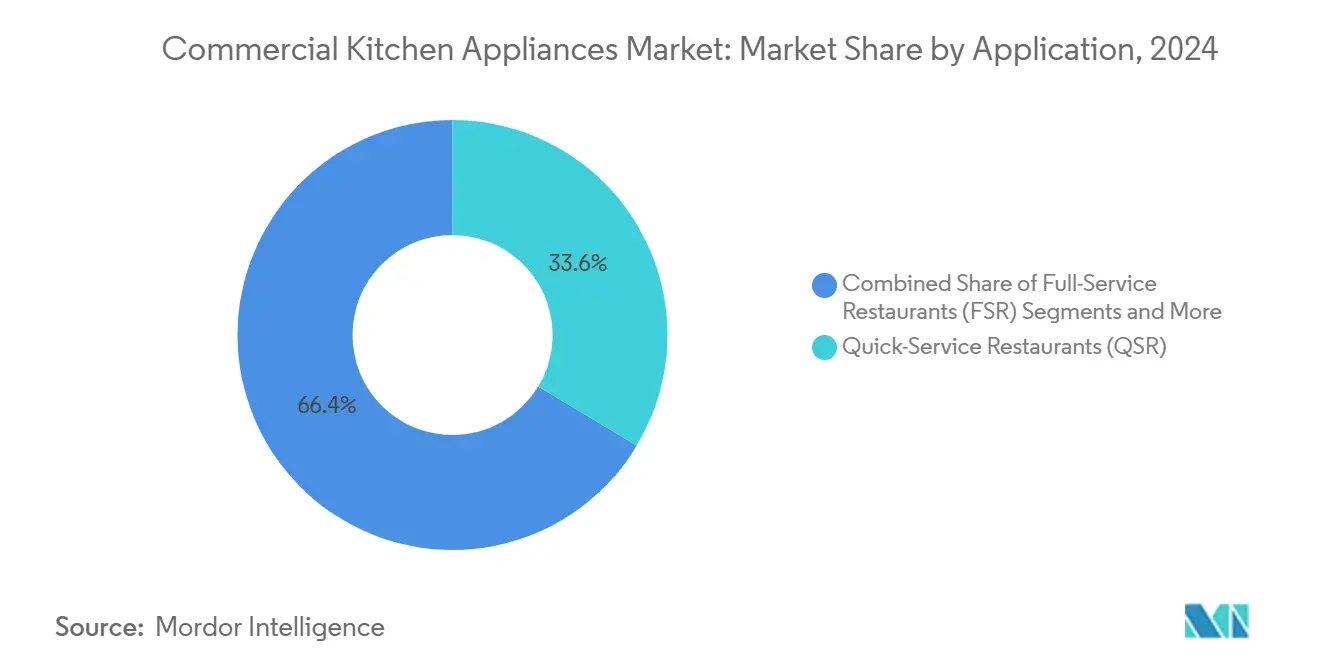
- By application, the QSR segment held 30.44% of the commercial kitchen appliances market share in 2025, and cloud and ghost kitchens recorded the highest projected CAGR at 10.32% through 2031.
- By distribution channel, direct from the manufacturers captured 78% share of the commercial kitchen appliances market size in 2025, while dealers/distributors are projected to grow at a 6.8% CAGR through 2031.
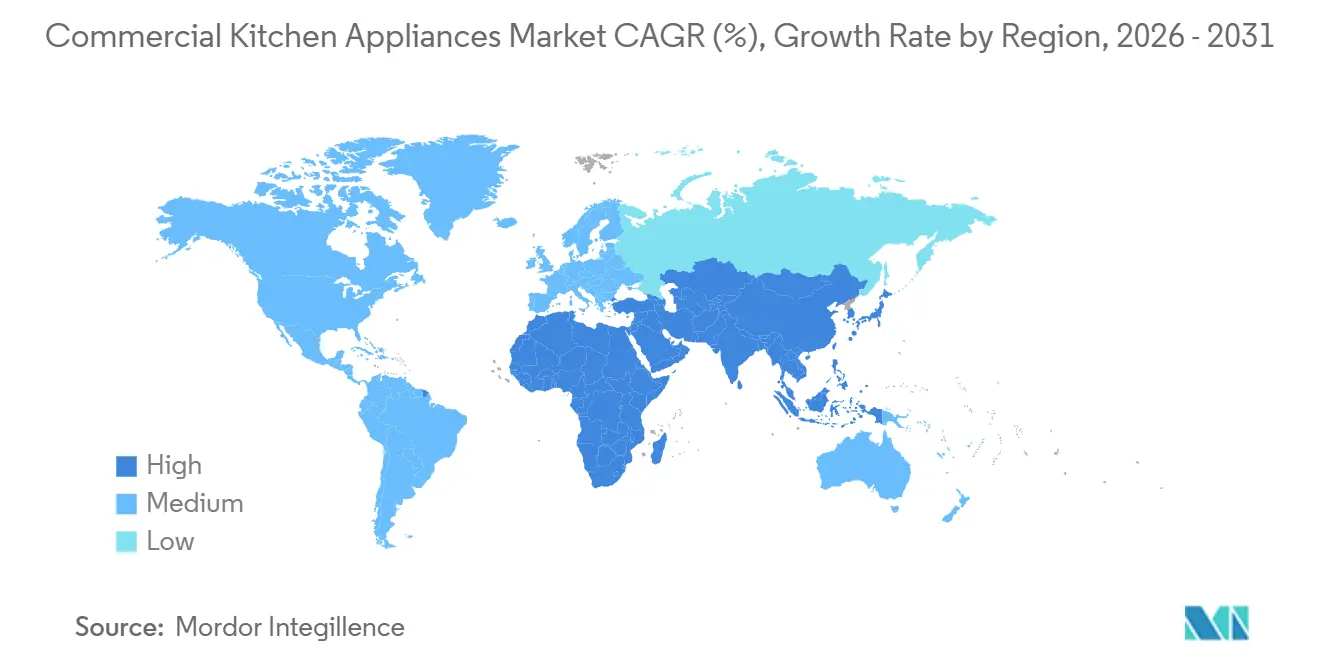
- By geography, North America accounted for a 26.38% share of the commercial kitchen appliances market size in 2025, and Asia-Pacific is forecast to expand at a 6.87% CAGR through 2031.
Note: Market size and forecast figures in this report are generated using Mordor Intelligence’s proprietary estimation framework, updated with the latest available data and insights as of January 2026.
Global Commercial Kitchen Appliances Market Trends and Insights
Drivers Impact Analysis*
| Driver | (~) % Impact on CAGR Forecast | Geographic Relevance | Impact Timeline |
|---|---|---|---|
| QSR Chains and Out-of-Home Dining are Expanding | +1.8% | Global, with the strongest concentration in Asia-Pacific (China, India) and North America | Medium term (2-4 years) |
| Hospitality Sector Is Witnessing a Construction Boom | +1.5% | North America & Europe core, Asia-Pacific (China, Vietnam, India), and the Middle East (Saudi Arabia, UAE) spill-over | Medium term (2-4 years) |
| Kitchens are Becoming Energy-Efficient and IoT-Enabled | +1.2% | Global, led by the EU and North America due to regulatory mandates, adoption is spreading to APAC urban centers | Long term (≥ 4 years) |
| Cloud and Ghost Kitchens are on the Rise | +1.1% | North America and APAC leading, Europe and the Middle East emerging | Short term (≤ 2 years) |
| Natural Refrigerants are Being Retrofitted | +0.9% | United States (AIM Act enforcement Jan 2026) and EU (F-gas changes 2025-2026); voluntary adoption in Australia and Japan | Short term (≤ 2 years) |
| Demand for Multifunctional Compact Units | +0.7% | Global, particularly urban markets with high real-estate costs | Medium term (2-4 years) |
| Source: Mordor Intelligence | |||


QSR Chains and Out-of-Home Dining are Expanding
Large quick-service companies are executing aggressive new-unit builds and remodels that sustain commercial kitchen purchasing across cooking, refrigeration, and warewashing categories. McDonald’s lifted capital expenditures and outlined plans consistent with the opening of around 2,200 restaurants in 2025, supported by a USD 3.0-3.2 billion capex range and a multi-year goal of scaling to 50,000 locations by 2027, which directly raises demand for standardized, high-throughput equipment in both mature and developing markets[1]McDonald’s Corporation, “Form 10-K,” U.S. Securities and Exchange Commission, sec.gov. . Yum! Brands reported USD 10 billion in digital sales for Q3 2025 with a 60% digital mix, while achieving a quarterly record of 1,131 gross new units in the period, creating procurement momentum for connected fryers, ovens, and KDS-integrated platforms[2]Yum! Brands, “Yum! Brands Reports Third-Quarter Results,” Yum! Brands, s2.q4cdn.com. . Connectivity and automation now command a premium as operators seek faster throughput and lower labor per transaction, and as multi-country chains require uniform outcomes across a broad store base. In India and across the Asia-Pacific, rising urban incomes and dense catchment areas enable QSR formats to scale unit counts quickly, which anchors multi-year equipment replacement cycles within the commercial kitchen appliances market. As menus localize and digital order flows remain elevated, equipment specifications prioritize consistency, rapid recovery times, and remote diagnostics that reduce service downtimes, reinforcing platform choices that operators carry into successive waves of openings.
Hospitality Sector Is Witnessing a Construction Boom
Hospitality capital expenditure continues to create multi-year equipment demand as hotels, resorts, and serviced apartments build kitchens suited to varied guest and event needs. Project flows in the Middle East, including Saudi Arabia’s Diriyah development, remain significant and translate into large, staged procurement schedules for ovens, refrigerators, and high-capacity dishwashers across several years to match construction phasing. Extended-stay properties allocate proportionally higher spend on kitchenettes and communal prep spaces, increasing demand for undercounter refrigeration, compact induction hobs, and efficient warewashing. In India, new and upgraded hotel properties tied to domestic tourism and business travel continue to specify energy-saving appliances with verified performance metrics, aligning with procurement frameworks that favor long-life equipment with ready access to parts and service. For multi-property groups, centralized purchasing and template kitchen designs compress unit costs and tighten installation schedules, which benefits vendors able to deliver compliance documentation and commissioning support at scale. As inflation and financing conditions remain tight, operators prioritize equipment choices with clear utility and maintenance savings, maintaining a steady preference for ENERGY STAR-qualified models that demonstrate measurable paybacks.
Kitchens are Becoming Energy-Efficient And Iot-Enabled
Efficiency-led procurement is now a default, supported by decades of verified savings from certified appliances across cooking, refrigeration, and warewashing. ENERGY STAR data show cumulative savings nearing 30 million MWh from foodservice equipment since 2001, with over 2 million MWh in annual savings logged in 2022, underscoring why operators prioritize third-party verified performance. The Version 1.0 specification for commercial electric cooktops, effective August 2023, set an 80% minimum cooking efficiency and yields around 10% energy savings per hob, translating to 1,800 kWh, USD 200, and 2,800 pounds of CO2 saved over a unit’s lifetime[3]U.S. Environmental Protection Agency, “ENERGY STAR Commercial Food Service Newsletter, Spring 2024,” US EPA, energystar.gov. . Equipment-level gains are also meaningful in daily operations, with commercial steam cookers saving 11,500 kWh annually, and commercial dishwashers saving 3,400 kWh and thousands of gallons of water each year, helping sites align with cost and sustainability goals. Large chains increasingly integrate predictive maintenance and real-time analytics into fleet management, with Yum! Brands deploying Byte Coach AI across 28,000 KFC restaurants by Q3 2025 to support operational performance and equipment health. As India’s multi-unit operators scale delivery and dine-in channels, verified efficiency ratings and connected diagnostics reduce operating costs and enable uniform compliance, reinforcing a durable shift in the commercial kitchen appliances market toward data-backed procurement.
Cloud And Ghost Kitchens are on the Rise
Delivery-first formats are re-shaping equipment lists by emphasizing compact, high-throughput appliances that fit tight back-of-house footprints in dense urban corridors. Operators that operate delivery-only kitchens prioritize multi-deck convection ovens, reach-in refrigeration with digital logging, and induction heat to minimize ventilation complexity and speed installation timelines. IoT layers are valued for temperature monitoring and cycle counts that help meet food-safety documentation requirements with fewer manual tasks. Indian cities with high delivery penetration and rising disposable incomes see continued uptake of modular, mobile-ready equipment packages that accelerate site commissioning and reduce construction downtime. As aggregator platforms streamline customer acquisition, procurement favors reliable, serviceable platforms that can be replicated across multiple hubs within a metro, reinforcing consistent purchasing patterns across the commercial kitchen appliances market.
Restraints Impact Analysis*
| Restraint | (~) % Impact on CAGR Forecast | Geographic Relevance | Impact Timeline |
|---|---|---|---|
| SMEs Grapple with High Upfront Capex | -1.4% | Global, most acute where SME financing is limited, with elevated interest rates in North America and the EU | Medium term (2-4 years) |
| Navigating Complex Safety and Fire Certifications Proves Challenging | -0.7% | Multi-regional compliance across North America and Europe, with emerging frameworks in Asia | Long term (≥ 4 years) |
| Shortages Plague the Electronics Supply Chain | -0.5% | Global exposure with concentrated component manufacturing footprints | Short term (≤ 2 years) |
| Energy Prices Experience Notable Volatility | -0.3% | Global exposure with higher sensitivity in Europe and parts of emerging Asia | Medium term (2-4 years) |
| Source: Mordor Intelligence | |||
SMEs Grapple with High Upfront Capex
Capital access and cost inflation remain structural constraints for small and midsize operators that cannot negotiate enterprise-level discounts or favorable lending terms. Survey data in Canada indicate that 69% of SMEs identify equipment costs as a deterrent to capital investment, 50% cite cash-flow constraints, and 47% point to high borrowing costs, while 65% continue to manage pandemic-related debt that averages USD 108,000, which crowds out new-equipment budgets[4]Canadian Federation of Independent Business, “Removing roadblocks: Unlocking small business capital investment,” CFIB, cfib-fcei.ca. . Higher funding thresholds and stricter underwriting standards elevate the hurdle for energy-efficient or IoT-enabled equipment purchases that offer clear paybacks but require upfront cash. Independent restaurants and cloud-kitchen start-ups in India face similar budget balancing as equipment needs expand beyond basic cooking to include refrigeration, warewashing, and temperature-logging hardware that satisfies food-safety practices. As a result, operators often phase equipment upgrades based on criticality and return horizon, which elongates replacement cycles. Over time, financing innovations and vendor service bundles that reduce upfront payments can improve adoption within the commercial kitchen appliances market.
Navigating Complex Safety and Fire Certifications Proves Challenging
Compliance pathways vary across jurisdictions and extend beyond product testing to technical documentation, ongoing audits, and change controls that escalate costs and timelines. In the European Economic Area, CE marking requires conformity assessment, technical files, and Declarations of Conformity that must be maintained for 10 years, with obligations dependent on the product’s risk category. Manufacturers that market across North America and Europe maintain parallel processes to satisfy food-contact, electrical safety, and electromagnetic compatibility rules, and any substantive product change may trigger retesting. Cybersecurity and product durability policies are tightening across the EU, which increases the design emphasis on software updates, repairability, and traceability that extend equipment lifecycles. For Indian exporters and importers that bridge these markets, documentation readiness and coordinated testing reduce delays in launches and retrofit programs. As operators and suppliers adapt to evolving requirements, vendors that integrate compliance into product design and after-sales support are positioned to capture share across the commercial kitchen appliances market.
*Our forecasts treat driver/restraint impacts as directional, not additive. The impact forecasts reflect baseline growth, mix effects, and variable interactions.
Segment Analysis
By Type: Refrigeration Anchors Share, Cooking Appliances Lead Growth
Refrigerators led the type mix with 34.36% market share in 2025, reflecting the sustained replacement needs for walk-ins, reach-ins, and undercounter units in longstanding foodservice operations. Cooking appliances are forecast to advance at 8.24% CAGR through 2031 on the strength of high-efficiency fryers, griddles, and combi platforms that concentrate multi-function capability within smaller footprints. Verified efficiency remains central to procurement, as equipment like commercial steam cookers and dishwashers delivers measurable annual energy and water savings that improve site-level economics. Induction and advanced ovens are prioritized where electrification agendas and building codes steer new projects toward all-electric back-of-house configurations, an approach that is gaining traction in dense Indian metros that prioritize air quality and safety. Product ecosystems built around sensors and cloud connectivity also help multi-unit operators monitor temperature profiles, cycle counts, and service intervals, tightening compliance and uptime across fleets within the commercial kitchen appliances market.
Product choice is increasingly context-specific, with bakery, catering, QSR, and institutional kitchens placing different weights on throughput, consistency, and maintenance access. High-speed oven variants that combine microwave and impingement technologies support delivery surges, while robust convection units remain staples for batch processes. ENERGY STAR-qualified dishwashers reduce both energy and water, which is relevant for facilities in water-stressed regions where tariff structures penalize usage spikes. Over the forecast period, cooking appliances are positioned to capture a rising share of the commercial kitchen appliances market as integrated controls shorten training time and improve repeatability. In India, chains that balance dine-in and delivery channels increasingly standardize on compatible refrigeration and hot-side packages so parts, training, and service procedures remain common across formats in the commercial kitchen appliances industry.


By Application: QSR Dominance, Ghost Kitchens Surge
QSR held 30.44% of application demand in 2025, anchored by expansion strategies that replicate standardized back-of-house configurations for speed, quality, and compliance. Cloud and ghost kitchens are the fastest-growing application with a 10.32% CAGR through 2031, which draws investment to compact, high-throughput equipment that supports higher order density per square foot. Delivery-centric formats rely on precise temperature control, quick recovery, and minimal maintenance burdens, so equipment selection favors digital controls, remote monitoring, and modular serviceability. India’s food delivery adoption supports continued site growth for delivery-first operators across tier-1 and tier-2 cities, which increases the need for standardized, certifiable equipment packages that accelerate fit-outs. As these formats scale, the commercial kitchen appliances market sees rising orders for reach-in refrigeration with logging, induction platforms that simplify ventilation plans, and warewashing gear that fits backfilled spaces.
Full-service restaurants, resorts, and institutional canteens make different trade-offs, prioritizing batch-cooking capacity, holding quality, and water and energy efficiencies over sheer speed. Hotels and resorts purchase across guest-room mini refrigeration, banquet production, and pool or lounge outlets, which spreads procurement cycles over longer timelines. Healthcare and campus kitchens emphasize sanitation and documentation, steering purchases toward equipment with integrated logging and easy-to-clean designs. For Indian operators that run mixed portfolios across FSR, QSR, and cloud kitchens, a blended approach to equipment specifications streamlines sourcing and technician training. These dynamics reinforce diversified demand across applications in the commercial kitchen appliances market share and sustain a broad installed base that renews on predictable cycles.
Direct-from-Manufacturer Channel Leads Global Commercial Kitchen Appliances Market
In 2025, the Direct-from-Manufacturer channel secured a commanding 78% share of the global commercial kitchen appliances market, yet dealers and distributors are projected to expand at 6.8% CAGR through 2031. This channel is pivotal, especially for high-value, large-scale projects that demand customized solutions and nurture strong client relationships. Dealers and distributors acting as essential intermediaries connect manufacturers with end-users, which include restaurants, hotels, catering services, and institutional kitchens. Beyond ensuring widespread product availability, these intermediaries boost operational efficiency, facilitating rapid deliveries that respond to market fluctuations. Dealers, capitalizing on their regional insights, offer timely support and services across various locations. They simplify bulk procurement and logistics, alleviating operational challenges for smaller foodservice businesses. By maintaining a stock of sought-after appliances, they can quickly respond to sudden demand surges.
Global manufacturers are enhancing their distribution capabilities through strategic moves. In June 2025, Middleby unveiled the Middleby Innovation Kitchens (MIK) in Munich, an experiential center for key clients to explore and innovate commercial kitchen solutions. Following this, in August, 2025, Middleby expanded its portfolio by acquiring Frigomeccanica S.p.A., enhancing its range of equipment offerings in drying, defrosting, fermentation, refrigeration, and preservation, specifically designed for direct-from-manufacturer channels.
Geography Analysis
North America accounted for 26.38% of global revenue in 2025, reflecting the region’s strong base of multi-unit restaurant systems and broad adoption of connected, energy-efficient equipment. Policy drivers will continue to influence purchasing patterns through 2026, as the U.S. AIM Act limits high-GWP refrigerants and mandates stricter leak detection and repair protocols for large-charge systems, which increases replacement activity in foodservice cold rooms and walk-ins. In Canada, small and midsize enterprises report ongoing capital constraints and pandemic-era debt burdens that reduce appetite for large upfront purchases, which keeps interest in financing and service-led models elevated. The region’s regulatory frameworks and food-safety codes also reinforce the adoption of equipment with verified performance and logging features. Over the medium term, these factors sustain a steady base of replacements and upgrades within the commercial kitchen appliances market.
Asia-Pacific is the fastest-growing region with a projected 6.87% CAGR through 2031 as urbanization, rising incomes, and expanding QSR and delivery-first formats deepen equipment demand across China, India, and Southeast Asia. Expansion by global chains has been robust, with Yum! Brands reporting thousands of net new units globally, many in Asia-Pacific, alongside rising digital order volumes that require throughput-focused equipment. In India, growth in Tier-2 and Tier-3 cities is elevating demand for standardized hot-side packages and reliable cold storage with temperature logging to meet food-safety practices. Equipment selection also reflects local codes and electrification trajectories, with induction gaining exposure in urban kitchens that benefit from faster installs and consistent heat control. These trends underpin increasing equipment penetration per site and steadier replacement cycles across the commercial kitchen appliances market.
Europe, the Middle East, and Africa show mixed momentum, with European operators adapting to energy costs and updated F-gas rules that push toward natural refrigerants in new and retrofit systems. The shift to CO2 and hydrocarbon solutions is now well established in European retail refrigeration, and hospitality operators are drawing on those learnings for foodservice cold rooms and reach-ins. In the Middle East, mega-developments such as Saudi Arabia’s Diriyah project are shaping multi-year procurement cycles and concentrated installation programs that absorb large volumes of kitchen equipment across hotels and mixed-use venues. Africa’s demand base remains uneven, though key hubs are developing distribution infrastructure that supports regional rollouts. Across EMEA, sustainability, compliance, and lifecycle serviceability remain central to supplier selection in the commercial kitchen appliances market and will continue to drive replacement timing and product mix choices.

Competitive Landscape
The commercial kitchen appliances market is moderately concentrated, led by diversified conglomerates such as Ali Group, Electrolux Professional, Middleby Corporation, and Rational AG, which collectively hold substantial share through broad, multi-brand portfolios. These portfolios span core categories including cooking, refrigeration, warewashing, and food-preparation equipment. Alongside these giants, specialized manufacturers like Hoshizaki, True Manufacturing, and Alto-Shaam maintain strong niche positions through deep engineering expertise and long-standing OEM relationships with major foodservice chains. Competitive strategy across the sector has shifted away from simple product-line expansion toward value-added services. These services increasingly include IoT-enabled predictive maintenance, fleet-wide energy management tools, and regulatory-compliance support tied to sustainability and safety standards.
Ali Group’s decision to adopt the Welbilt name in North America while retaining the Ali Group identity elsewhere reflects a branding strategy built on Welbilt’s strong recognition among U.S. operators following the 2021 acquisition. Its collection of brands, such as Scotsman, Delfield, and Frymaster, allows the company to offer bundled solutions that streamline procurement for multi-unit customers. Middleby Corporation, meanwhile, announced in February 2025 plans to spin off its food-processing division to sharpen its focus on commercial cooking and beverage systems. This restructuring is intended to improve capital allocation and speed innovation in high-growth areas like smart, connected ovens and induction-based platforms. Together, these moves highlight how scale players are reorganizing to compete more effectively in technology-driven segments.
Significant white-space opportunities are emerging in retrofit solutions that convert existing gas equipment to electric or induction formats, especially as building-electrification mandates expand. Subscription-based equipment-as-a-service models are also gaining attention, enabling operators, particularly small and mid-sized businesses, to reduce upfront capital costs while shifting maintenance risk back to manufacturers. New, technology-oriented entrants are challenging incumbents by offering modular, software-defined appliances where firmware updates deliver new capabilities without replacing hardware. Rational AG’s iCombi and iVario platforms illustrate how integrated software, connectivity, and proprietary consumables can justify premium pricing and deepen customer lock-in. At the same time, supply-chain concentration in semiconductors and critical materials has heightened the importance of resilience, prompting manufacturers to near-shore assembly and hold buffer inventories to mitigate geopolitical and sourcing risks.
Commercial Kitchen Appliances Industry Leaders
Ali Group
Electrolux Professional
Middleby Corporation
Hoshizaki Corporation
Welbilt (Manitowoc)
- *Disclaimer: Major Players sorted in no particular order

Recent Industry Developments
- December 2025: The U.S. Environmental Protection Agency updated its FAQ on HFC phasedowns, clarifying that the Emissions Reduction and Reclamation Rule requiring automatic leak detection for systems with ≥1,500 lbs refrigerant charge will apply to new systems from January 1, 2026, and existing systems from January 1, 2027, affecting walk-in coolers and freezers across thousands of commercial kitchens.
- February 2025: Middleby Corporation announced its intention to separate its food-processing business from commercial cooking equipment and beverage systems, aiming to streamline operations and accelerate innovation in smart-connected ovens and induction platforms while enhancing capital allocation toward higher-growth segments.
- January 2024: McDonald’s Corporation opened 2,116 new restaurants in 2024 while closing 461 locations, achieving net expansion exceeding 2,100 units, and increased capital expenditures by 18% year over year to USD 2.775 billion, with USD 1.661 billion dedicated to new restaurant builds requiring comprehensive kitchen-equipment installations.


Research Methodology Framework and Report Scope
Market Definitions and Key Coverage
Our study defines the commercial kitchen appliances market as the annual sales value of new, factory-built refrigeration, cooking, warewashing, food-preparation, and ventilation equipment installed in food-service settings such as quick-service restaurants, full-service restaurants, institutional canteens, hotels, and cloud kitchens. Portable countertop units counted as "small commercial appliances" are included when they are explicitly marketed for professional duty cycles.
Scope Exclusion: non-food retail display coolers, residential-only models, and aftermarket parts are outside this assessment.
Segmentation Overview
- By Type
- Refrigerators
- Walk-in
- Reach-in
- Undercounter & Prep-table
- Cooking Appliances
- Fryers
- Griddles & Charbroilers
- Steamers
- Cooktops & Cooking Ranges
- Gas
- Electric
- Induction
- Ovens
- Convection
- Combi
- High-speed
- Dishwashers
- Undercounter
- Conveyor
- Heated Holding & Banquet Equipment
- Food-Preparation Equipment
- Smart Connected Equipment
- Refrigerators
- By Application
- Quick-Service Restaurants (QSR)
- Full-Service Restaurants (FSR)
- Cloud / Ghost Kitchens
- Institutional Canteens
- Resorts & Hotels
- Hospitals & Healthcare
- Railway Dining
- Catering Services
- By Distribution Channel
- Direct from the Manufacturers
- Dealers/Distributors
- By Geography
- North America
- Canada
- United States
- Mexico
- South America
- Brazil
- Peru
- Chile
- Argentina
- Rest of South America
- Asia-Pacific
- India
- China
- Japan
- Australia
- South Korea
- South East Asia (Singapore, Malaysia, Thailand, Indonesia, Vietnam, and Philippines)
- Rest of Asia Pacific
- Europe
- United Kingdom
- Germany
- France
- Spain
- Italy
- BENELUX (Belgium, Netherlands, Luxembourg)
- NORDICS (Denmark, Finland, Iceland, Norway, Sweden)
- Rest of Europe
- Middle East and Africa
- United Arab Emirates
- Saudi Arabia
- South Africa
- Nigeria
- Rest of Middle East and Africa
- North America
Detailed Research Methodology and Data Validation
Primary Research
We interviewed food-service owners, kitchen designers, and distributors across North America, Europe, Asia-Pacific, and the GCC to test replacement-cycle assumptions, average selling prices, and regulatory cost impacts. We followed up with manufacturers' product-management teams to validate planned capacity additions and feature upgrades.
Desk Research
Mordor analysts screened trade statistics from UN Comtrade, energy-efficiency datasets issued by ENERGY STAR and the EU Ecodesign portal, shipment disclosures filed with the US International Trade Commission, and equipment installation counts shared by the National Restaurant Association and Eurostat PRODCOM. Company 10-Ks, investor decks, and industry white papers complemented these public sources, while D&B Hoovers and Dow Jones Factiva supplied paywalled financials and news. This list is illustrative, not exhaustive; many additional outlets were reviewed for data points and context.
Market-Sizing & Forecasting
A top-down build starts with restaurant outlet counts and floor-area benchmarks, which are then paired with typical appliance penetration ratios and price bands to derive baseline demand. Supplier roll-ups of refrigeration, oven, and dishwasher shipments provide bottom-up anchors that let us reconcile gaps. Key variables in our model include new food-service outlet openings, average equipment lifespan, energy-efficiency rule changes, cloud-kitchen adoption rates, and stainless-steel price trends. A multivariate regression, reviewed with primary sources, projects these drivers to 2030. Scenario checks adjust for swings in commodity costs or construction slowdowns.
Data Validation & Update Cycle
Outputs pass anomaly scans versus historical spend, import volumes, and publicly reported revenues. Any variance above five percent triggers re-verification. Senior analysts review each draft before sign-off. Reports refresh yearly, with interim updates when material events such as major health-code changes or M&A shift the outlook.
Why Mordor's Commercial Kitchen Appliances Baseline Earns Lasting Trust
Published figures often diverge because firms set different product boundaries, estimate average prices differently, or refresh their data at uneven intervals.
Key gap drivers include narrower "cooking-only" scopes, omission of small countertop devices, or using static ASPs that ignore rapid shifts toward connected, energy-efficient models. Mordor's broader inclusion of warewashing and smart equipment, coupled with yearly ASP audits, yields a fuller, current view.
Benchmark comparison
| Market Size | Anonymized source | Primary gap driver |
|---|---|---|
| USD 98.56 Bn (2025) | Mordor Intelligence | - |
| USD 89.45 Bn (2024) | Global Consultancy A | Excludes warewashing and countertop prep tools; biennial refresh |
| USD 37.44 Bn (2024) | Trade Journal B | Covers cooking equipment only; static ASP assumptions |
Different totals reflect these scope and input choices. By auditing prices annually, tracking every major appliance class, and validating with end-user interviews, Mordor Intelligence provides a balanced, transparent baseline that decision-makers can reliably act upon.


Key Questions Answered in the Report
What is the current size and growth outlook for the commercial kitchen appliances market?
The commercial kitchen appliances market size is USD 52.76 billion in 2026 and is projected to reach USD 71.49 billion by 2031 at a 6.26% CAGR, supported by efficiency-led replacements and multi-unit operator expansions.
Which applications are expanding fastest within the commercial kitchen appliances market?
Cloud and ghost kitchens are the fastest-growing application with a 10.32% CAGR through 2031 as delivery-first formats prioritize compact, high-throughput, connected equipment.
Which product categories lead share and growth in the commercial kitchen appliances market?
Refrigerators lead with 34.36% share, while cooking appliances are the fastest-growing category at an 8.24% CAGR, driven by induction, combi, and connected platforms.
How are regulations influencing purchases in the commercial kitchen appliances market?
United States AIM Act HFC limits and EU F-gas updates are accelerating transitions to natural-refrigerant systems and tightening leak detection and documentation, which brings forward cold-side replacements.
What is the role of large chains in shaping the commercial kitchen appliances market?
Large QSR and multi-brand operators set standards for connected equipment, negotiate direct B2B contracts, and scale AI-driven diagnostics, which influence product roadmaps and service models regionally and in India.
Which regions are most important for future growth in the commercial kitchen appliances market?
Asia-Pacific is the fastest-growing region with a projected 6.87% CAGR as urbanization and QSR and delivery-first expansion increase equipment penetration across China, India, and Southeast Asia.
Page last updated on:


