Electric Cocktail Maker Market Size and Share
Market Overview
| Study Period | 2020 - 2031 |
|---|---|
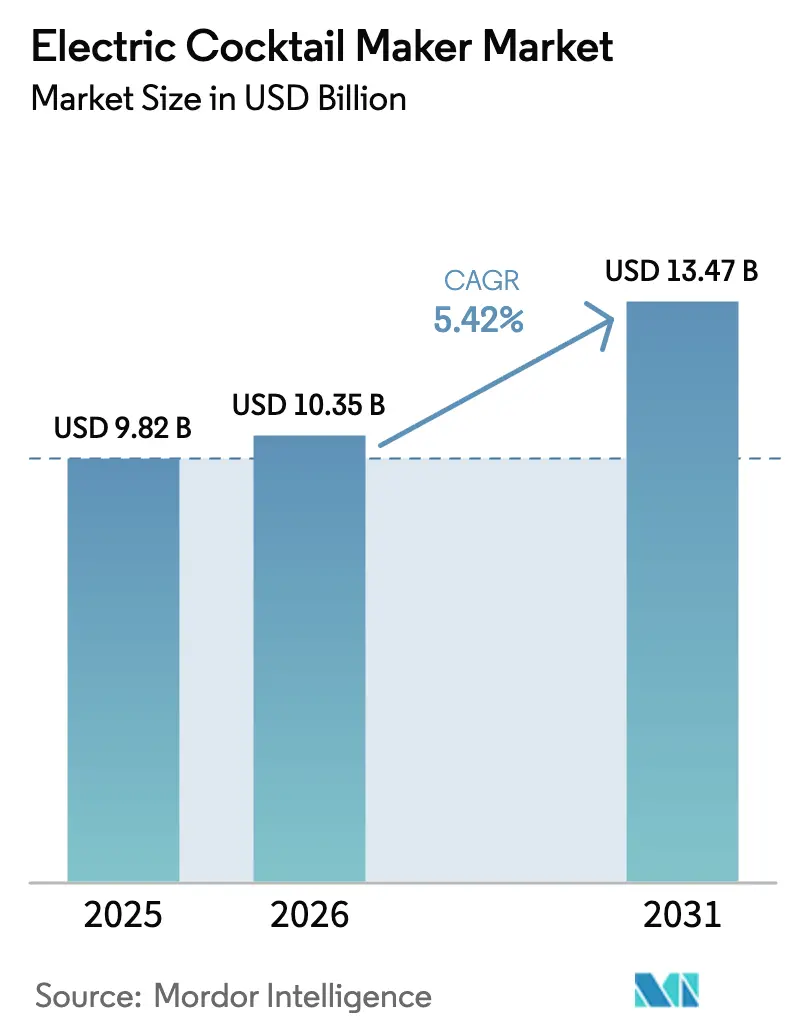
| Market Size (2026) | USD 10.35 Billion |
| Market Size (2031) | USD 13.47 Billion |
| Growth Rate (2026 - 2031) | 5.42% CAGR |
| Fastest Growing Market | Europe |
| Largest Market | North America |
| Market Concentration | Medium |
Major Players *Disclaimer: Major Players sorted in no particular order Image © Mordor Intelligence. Reuse requires attribution under CC BY 4.0. | |
Electric Cocktail Maker Market Analysis by Mordor Intelligence
The electric cocktail maker market size was valued at USD 9.82 billion in 2025 and estimated to grow from USD 10.35 billion in 2026 to reach USD 13.47 billion by 2031, at a CAGR of 5.42% during the forecast period (2026-2031). Growth rests on two converging dynamics: home-entertainment upgrades that began during pandemic lockdowns and hospitality operators’ move toward automated beverage stations that offset labor shortages and shrink pour variance. Artificial-intelligence metering, robotic-arm mixing, and smart-home connectivity ensure reliable flavor replication while cutting prep time, strengthening the premium cachet of the electric cocktail maker market. Government actions also support expansion: in the United States, the Department of Labor projects food-service job vacancies to remain above 900,000 through 2027, encouraging hotels and bars to mechanize repetitive bartending tasks [1]Source: Bureau of Labor Statistics, “Job Openings and Labor Turnover Survey,” bls.gov. In the European Union, the Single-Use Plastics Directive pushes manufacturers to adopt recyclable capsules, fostering eco-centric product refreshes that resonate with environmentally aware consumers [2]Source: European Commission, “Directive on Single-Use Plastics,” ec.europa.eu.
Key Report Takeaways
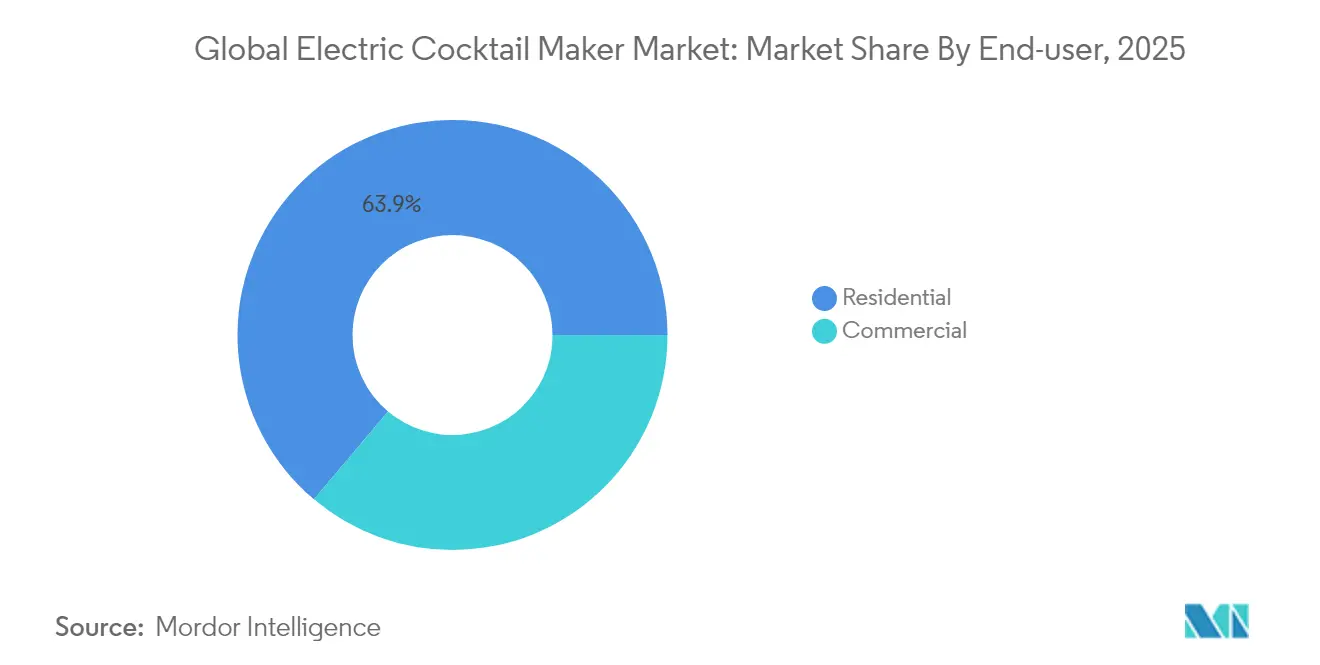
- By end-user, residential units captured 63.85% revenue in 2025; hotels and resorts are projected to expand at a 9.18% CAGR through 2031 in the electric cocktail maker market.
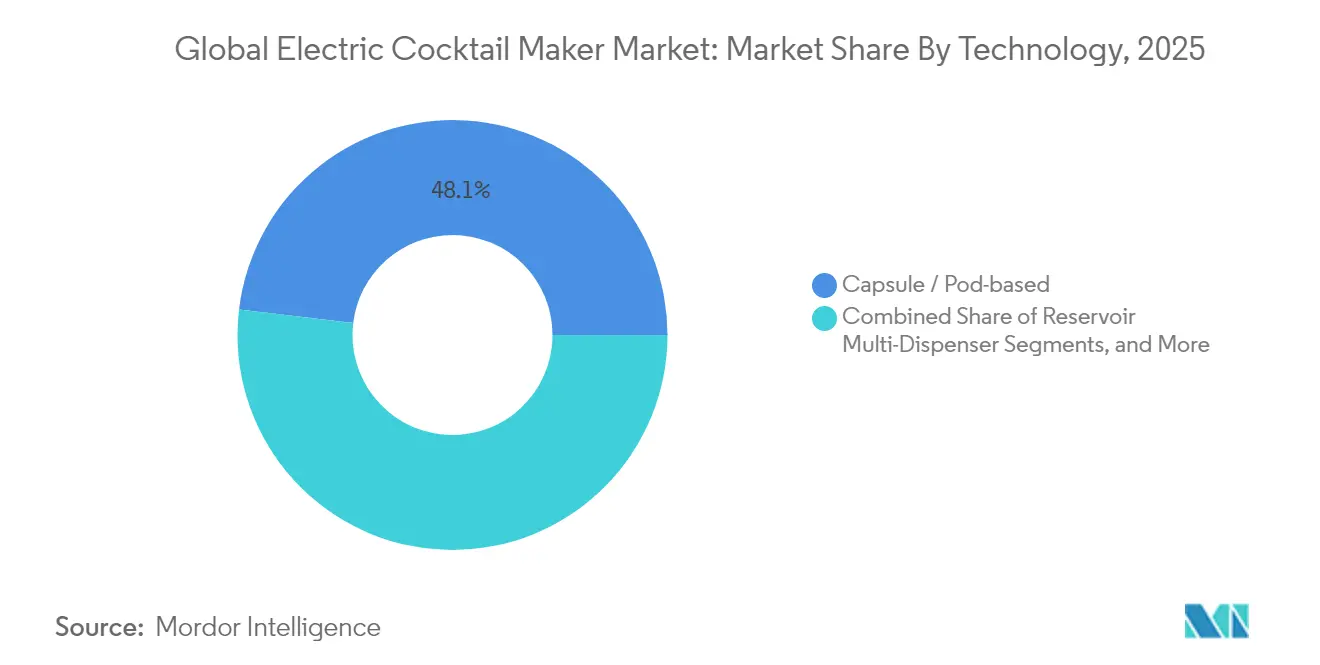
- By technology, capsule systems led with 48.10% of the electric cocktail maker market share in 2025; robotic-arm mixers are poised for a 10.42% CAGR to 2031.
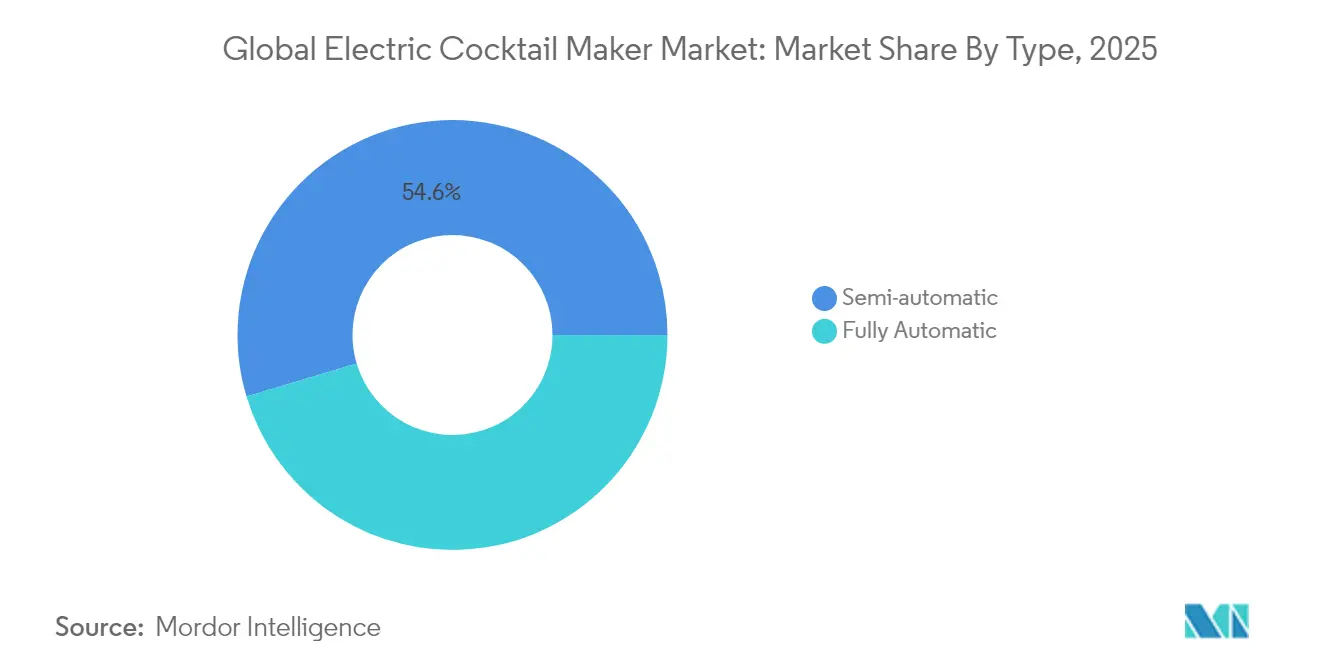
- By type, semi-automatic machines commanded 54.62% of the electric cocktail maker market size in 2025; fully automatic models will grow fastest at 6.48% from 2026-2031.
- By form factor, countertop units held 61.72% share of the electric cocktail maker market size in 2025; portable devices are set for 9.31% CAGR to 2031.
- By distribution channel, online sales represented 58.73% of 2025 revenue, while offline specialty stores show the highest projected CAGR at 9.96% in the electric cocktail maker market.
- The competitive landscape remains moderately fragmented, with the top 5 players - Bartesian, Barsys, Keurig Drinkworks, Hamilton Beach Brands Inc., and Makr Shakr holding significant market shares
Note: Market size and forecast figures in this report are generated using Mordor Intelligence’s proprietary estimation framework, updated with the latest available data and insights as of 2026.
Global Electric Cocktail Maker Market Trends and Insights
Drivers Impact Analysis*
| Driver | ( ~) % Impact on CAGR Forecast | Geographic Relevance | Impact Timeline |
|---|---|---|---|
| Rising Popularity of Home Cocktails | +1.8% | Global, strongest in North America & Europe | Medium term (2-4 years) |
| Advances in Technology | +1.5% | Global, led by Asia-Pacific innovation hubs | Long term (≥ 4 years) |
| Demand for Customization | +1.2% | North America & Europe premium segments | Short term (≤ 2 years) |
| Growing Cocktail Culture | +0.9% | Global, emerging markets acceleration | Long term (≥ 4 years) |
| Health-Conscious Consumption Trends | +0.6% | North America & Europe, expanding to Asia-Pacific | Short term (≤ 3 years) |
| Source: Mordor Intelligence | |||
Rising Popularity of Home Cocktails
Pandemic-era lockdowns nudged consumers toward at-home mixology, and the behavior now feels permanent. Households outfit kitchens with countertop machines that blend speed, novelty, and professional consistency, turning living rooms into social hubs for small gatherings. Millennials and Gen Z purchase capsule subscriptions that guarantee fresh ingredients and predictable flavor. E-commerce storefronts nurture the trend with bundle pricing and influencer-driven recipe videos, reinforcing recurring demand for machines and consumables.
Advances in Technology
Precision scales, computer-vision liquid sensors, and robotic arms now permit machines to produce up to 350 drinks per hour with minimal human oversight. Firmware pushes seasonal recipes directly over Wi-Fi, extending hardware longevity and lowering upgrade frequency. Japan’s Ministry of Economy, Trade and Industry revised its Top Runner energy-efficiency program in 2024 to cover countertop beverage appliances, nudging brands to adopt insulated reservoirs and low-draw motors [3].
Demand for Customization
Adjustable strength settings, allergen substitutions, and AI-curated flavor recommendations put control back in users’ hands. Hospitality operators elevate guest experience by letting patrons order bespoke cocktails through mobile apps or tabletop kiosks. Residential users experiment with ingredient swaps and garnish pairings, heightening social media shareability of machine-generated cocktails.
Growing Cocktail Culture
Digitally amplified cocktail culture has shifted from elite bars to mainstream gatherings. Visual theatrics, smoke infusions, and locally sourced spirits circulate across TikTok and Instagram, fueling new-product trial in emerging markets. Asia-Pacific’s surging middle class is particularly responsive, translating aspirational lifestyle cues into purchases of premium electric cocktail makers.
Restraints Impact Analysis*
| Restraint | (~) % Impact on CAGR Forecast | Geographic Relevance | Impact Timeline |
|---|---|---|---|
| High Initial Cost | -1.5% | Global, strongest in emerging markets | Short term (≤ 2 years) |
| Limited Consumer Knowledge | -1.2% | Global, particularly in Asia-Pacific & Latin America | Medium term (2-4 years) |
| Complexity of Maintenance | -0.7% | Global, especially in residential | Medium term (2-4 years) |
| Competition from Traditional Methods | -0.6% | Europe & Asia-Pacific | Long term (≥ 4 years) |
| Market Saturation and Brand Loyalty | -0.5% | North America & Europe | Long term (≥ 4 years) |
| Source: Mordor Intelligence | |||
High Initial Cost
Entry-level machines still carry premium price tags relative to handheld shakers. Commercial buyers justify spending through labor savings, yet first-time household purchasers compare the outlay with other kitchen appliances and may defer adoption. Manufacturers now offer financing, rental programs, and pared-down feature sets to widen the funnel, but pricing remains a notable barrier across developing economies.
Limited Consumer Knowledge
Potential buyers often misunderstand cleaning requirements, capsule compatibilities, or ingredient storage protocols, leading to purchase hesitancy. Hospitality operators that invest in staff training report higher machine utilization rates and stronger guest feedback, underscoring education’s pivotal role in driving usage.
*Our forecasts treat driver/restraint impacts as directional, not additive. The impact forecasts reflect baseline growth, mix effects, and variable interactions.
Segment Analysis
By Type: Automation Drives Market Evolution
Semi-automatic machines accounted for 54.62% of electric cocktail maker market share in 2025, reflecting their accessible balance between human control and machine precision. These models appeal to home enthusiasts seeking manual flair and small venues that value cost-effective automation. Feature updates—such as app pairing, expanded recipe libraries, and removable reservoirs—sustain interest without price escalation. Fully automatic units, while representing a smaller installed base, are expected to record a 6.48% CAGR through 2031 as robotic arms and self-cleaning cycles remove nearly all human intervention. Commercial operators favor them for predictable throughput and hygiene. The electric cocktail maker market further expands through hybrid products that bridge these two camps, suggesting that partial and full automation will coexist for the foreseeable future.
Consumers equate fully automatic systems with luxury, driving average selling prices upward. In parallel, leasing models help restaurants align cash flow with peak seasons, converting capital expenses into operating costs. Firmware updates that add seasonal recipes extend lifecycle value. At the same time, semi-automatic products remain crucial entry points for price-sensitive households, ensuring that the electric cocktail maker market can target both introductory and aspirational buyers.


By Form Factor: Portability and Compactness Redefine Use Cases
Countertop systems dominated with 61.72% of the electric cocktail maker market size in 2025, largely because they integrate neatly into existing kitchen layouts and back-bar counters. Designers prioritize compact footprints, stainless-steel aesthetics, and under-cabinet clearance, making these units both functional and visually coherent with modern interiors. Portable and compact makers show a 9.31% forecast CAGR, propelled by tailgating, outdoor weddings, and pop-up events that call for beverages on the move. Manufacturers invest in battery optimization, quick-release modular reservoirs, and rugged casings that withstand transport.
Freestanding kiosks, once niche, now appear in hotel lobbies where 24/7 beverage availability supplements bar staff during off-peak hours. Wall-mounted dispensers allow luxury lounges to free counter real estate while highlighting avant-garde design. Italian building-code revisions in 2024 clarified load-bearing requirements for wall-fixed modular beverage units, smoothing installation pathways and sparking European interest . Continuous miniaturization of pump assemblies raises the ceiling on form-factor diversity, ensuring manufacturers can target RV enthusiasts, yacht owners, and coworking managers alike.
By Technology: Robotic-Arm Mixers Accelerate Growth
Capsule-based machines held 48.10% share in 2025, capitalizing on foolproof dosing and wide flavor assortments to deliver consistent results. Subscription plans for pods stabilize revenue and simplify inventory management for users. Robotic-arm mixers, projected to surge at 10.42% CAGR, marry spectacle with precision, producing layered pours and garnished drinks that rival artisan bartenders. Real-time ingredient scanning enables adaptive recipes that balance sweetness or acidity according to user preference, while AI-powered dashboards alert operators when stock runs low.
Multi-dispenser reservoirs increasingly integrate IoT sensors that tally pour counts and forecast re-order points, a feature prized by multi-unit restaurant groups. AI-enabled measurement platforms offer data analytics that tie cocktail sales to broader point-of-sale systems, informing merchandising strategies. Sustainability considerations push refillable pod initiatives and lower-energy motors, ensuring that the electric cocktail maker market aligns with corporate environmental mandates and emerging consumer expectations.
By End-user: Hospitality Sector Spurs Premium Adoption
Residential buyers still represent 63.85% of unit shipments, underscoring the entrenched home-cocktail culture. Growth now tilts to hotels and resorts, where a 9.18% CAGR is expected as operators deploy machines in executive lounges, poolside bars, and high-end suites to elevate guest experience without adding staff. Cruise lines and theme parks lead adoption because machines keep service consistent even during peak volumes, protect margins, and deliver novelty that garners social-media buzz.
Bars and nightclubs integrate machines for speed rails, securing accurate pours that minimize over-serving and liquor shrinkage. Restaurants experiment with pre-set aperitif flights that shave prep time and standardize the cost of goods sold. Event caterers embrace portable units for outdoor weddings, enabling high throughput without full bar infrastructure. Cross-pollination between residential and commercial segments spurs product design: consumer feedback on user interfaces now informs commercial dashboards, while hospitality standards around cleaning cycles trickle down to premium home models, magnifying the electric cocktail maker industry's innovation velocity.
By Distribution Channel: Omnichannel Strategies Dominate
Online platforms controlled 58.73% of sales in 2025 as direct-to-consumer websites and third-party marketplaces matched post-pandemic purchase habits. Brands deploy targeted ads that funnel consumers into subscription programs for pods, raising lifetime value. Offline specialty stores, however, will grow fastest at 9.96% CAGR through 2031 because live demonstrations help de-risk purchase decisions. This showroom element proves especially persuasive for consumers wary of maintenance complexity.
Department stores curate experiential corners where shoppers test machines alongside cocktail ingredients, driving bundled sales. B2B distributors expand commercial reach by pairing machines with spirits portfolios and training packages. Robust omnichannel strategies synchronize online inventory with local stores, enabling click-and-collect services that free consumers from shipping delays. As retailers refine last-mile logistics, the electric cocktail maker market enjoys shorter replacement cycles and improved accessory attach rates.
Geography Analysis
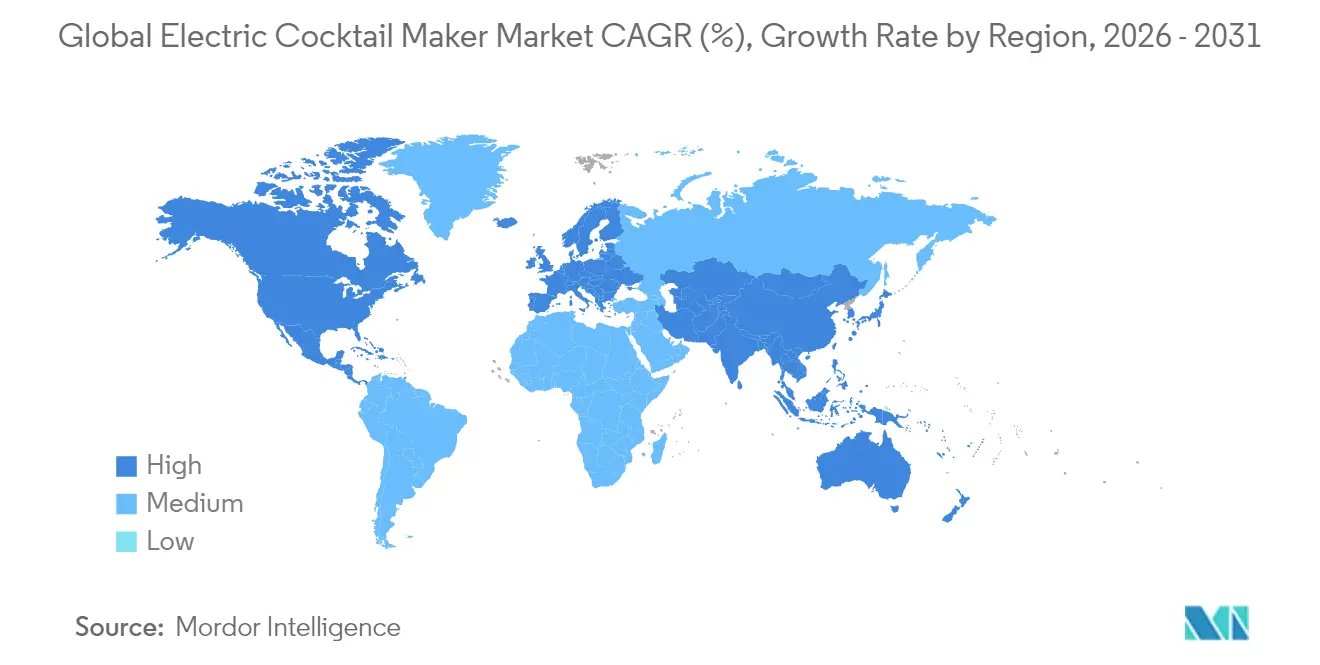
North America retained 40.12% share of the electric cocktail maker market in 2025, buoyed by an ingrained cocktail culture, high disposable incomes, and vigorous e-commerce uptake. Top appliance brands grow direct-to-consumer portals that accounted for 44% of 2024 unit sales in the United States. Canada follows similar patterns, while Mexico’s expanding middle class fuels premium appliance demand in metropolitan areas. Regional sales benefit from rebate programs that bundle machines with curated spirit collections, further embedding devices into home-entertainment routines.
Asia-Pacific is the fastest-growing geography with a 7.22% projected CAGR. Urban consumers in Japan, South Korea, and China seek compact yet high-spec appliances that fit small kitchens, and hospitality groups in Vietnam and Singapore embrace automation to differentiate guest experiences. Domestic manufacturers introduce energy-efficient motors and recyclable pods to satisfy eco-conscious buyers. Social-commerce platforms hasten adoption by pairing video demonstrations with one-click purchases, compressing the path to conversion.
Europe maintains steady demand anchored in rich mixology traditions. The United Kingdom, Germany, and France emphasize sustainability certifications, advanced filtration, and design aesthetics when selecting units. A vibrant tourism sector accelerates machine placement in boutique hotels, while high-end restaurants deploy robotic arms for table-side drinks that enhance experiential dining. Smaller regions such as Brazil and the UAE register early-stage momentum, typically through luxury hospitality projects and duty-free retail channels. Collectively, these dynamics ensure that the electric cocktail maker market remains globally diversified and resilient against localized downturns.

Competitive Landscape
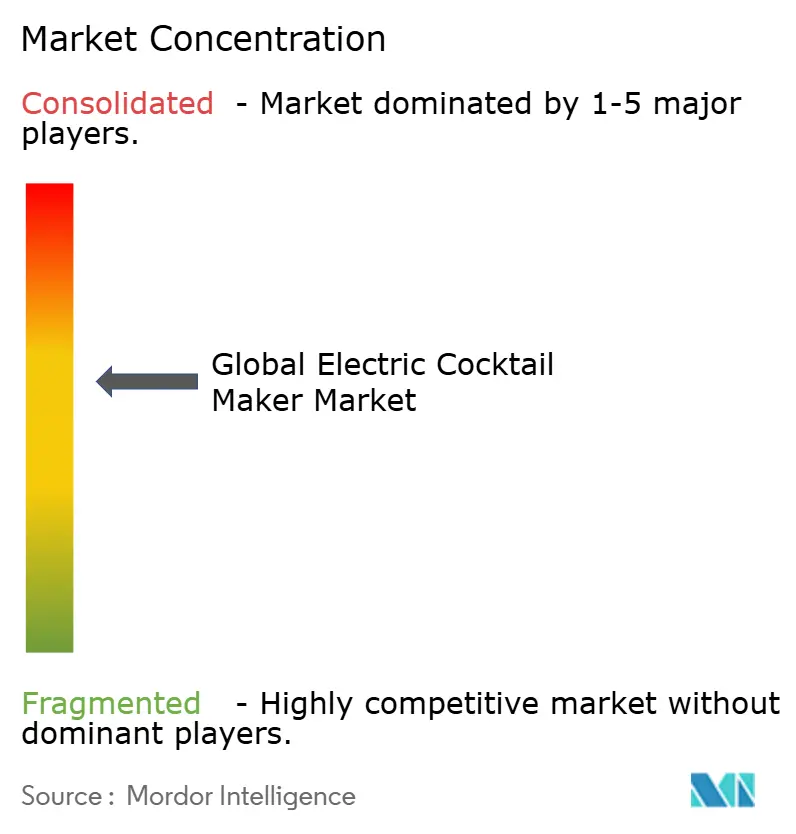
The market is moderately fragmented: Bartesian, Barsys, Keurig Drinkworks, Hamilton Beach Brands Inc., and Makr Shakr collectively account for a sizeable yet declining portion of global revenue as new entrants leverage AI-first platforms to gain traction. Incumbents exploit established distribution networks and co-marketing agreements with spirits producers to defend share, but the pace of innovation favors agile startups. Intellectual-property filings around robotic dispensing, sensor arrays, and self-cleaning modules indicate intensifying technology races.
Strategic partnerships shape the commercial channel. Makr Shakr’s alliance with a global cruise operator installs robotic bartenders across fleets, delivering theater and throughput in one package. Hamilton Beach Brands expands via HealthBeacon’s connected-device stack, signaling ambitions for broader smart-kitchen ecosystems. Keurig Drinkworks pilots limited-edition capsule collaborations that marry novelty with brand loyalty, while Barsys introduces portable systems that lower event-entry barriers. As sustainability rises on corporate agendas, companies that roll out recyclable pods, energy-efficient motors, and transparent supply-chain credentials stand to capture incremental margin and regulatory goodwill.
Competitive intensity is expected to rise over the forecast period. Appliance giants with global footprints are eyeing mergers or licensing deals to shortcut R&D timelines. Conversely, niche challengers court consumers with open recipe platforms and modular upgradability, anchoring brand communities around continuous software-led improvement. These divergent strategies suggest that the electric cocktail maker market will balance consolidation with bursts of disruption, keeping innovation cycles brisk and product roadmaps customer-centric.
Electric Cocktail Maker Industry Leaders
Bartesian
Barsys
Keurig Drinkworks
Hamilton Beach Brands Inc.
Makr Shakr
- *Disclaimer: Major Players sorted in no particular order

Recent Industry Developments
- May 2025: Hamilton Beach Brands acquired HealthBeacon to fortify its connected-device portfolio.
- July 2024: Bartesian, an automated smart cocktail maker, is transforming the hospitality industry by enabling venues to serve premium cocktails in seconds without skilled bartenders. With over 40 drink options, easy operation, and minimal cleanup, Bartesian boosts efficiency and revenue. The device is expanding rapidly, supported by a partnership with iHeartMedia.


Research Methodology Framework and Report Scope
Market Definitions and Key Coverage
We define the electric cocktail maker market as plug-in machines that automatically dose, mix, chill, and pour alcoholic or zero-proof drinks through electronic pumps, capsule systems, or robotic arms for residential or commercial serving needs.
Our scope covers new countertop, freestanding, and portable units shipped to homes, bars, hotels, cruise lines, and caterers.
Scope Exclusion: Manual shakers, stick blenders, frozen drink makers, and generic beverage dispensers without automated portioning are left out.
Segmentation Overview
- By Type
- Semi-automatic
- Fully Automatic
- By Form Factor
- Countertop
- Freestanding / Stationary
- Wall-mounted
- Portable / Compact
- By Technology
- Capsule / Pod-based
- Reservoir Multi-Dispenser
- Robotic-Arm Mixers
- AI-Enabled Measurement Systems
- By End-user
- Residential
- Commercial
- Bars & Nightclubs
- Restaurants & Cafes
- Hotels & Resorts
- Cruise Lines & Theme Parks
- Events & Catering Services
- By Distribution Channel
- Online
- Offline
- Specialty Stores
- Consumer-Electronics Retail
- Department Stores
- Direct / B2B
- By Geography
- North America
- Canada
- United States
- Mexico
- South America
- Brazil
- Peru
- Chile
- Argentina
- Rest of South America
- Asia-Pacific
- India
- China
- Japan
- Australia
- South Korea
- South East Asia (Singapore, Malaysia, Thailand, Indonesia, Vietnam, and Philippines)
- Rest of Asia-Pacific
- Europe
- United Kingdom
- Germany
- France
- Spain
- Italy
- BENELUX (Belgium, Netherlands, Luxembourg)
- NORDICS (Denmark, Finland, Iceland, Norway, Sweden)
- Rest of Europe
- Middle East And Africa
- United Arab Emirates
- Saudi Arabia
- South Africa
- Nigeria
- Rest of Middle East And Africa
- North America
Detailed Research Methodology and Data Validation
Primary Research
We interviewed product engineers and bar managers on three continents, online retail category buyers, and capsule suppliers. Their insight tested HS-code mapping, refined average selling prices, and revealed adoption triggers such as labor shortages and at-home entertainment demand.
Desk Research
Our team began with harmonized tariff codes from Eurostat, USITC, and China Customs to size cross-border flows, then matched them with hospitality association yearbooks that flag installed base shifts. Pricing corridors came from appliance makers' 10-Ks, while Questel patent families traced innovation density. Dow Jones Factiva archives and peer-reviewed Beverage Industry Review articles fed lifestyle and replacement-cycle cues. D&B Hoovers financials rounded out brand benchmarks. These sources are illustrative; many more informed data collection, validation, and clarification.
Market-Sizing & Forecasting
A top-down construct aligns declared trade values with commercial-appliance revenues, then checks them with selective bottom-up rolls of sampled ASP × unit shipments. Core variables, capsule consumption per active unit, replacement intervals, hotel-automation penetration, regional disposable-income shifts, and premium-model share feed a multivariate regression that extends the view to 2030. Weighted moving averages bridge any data gaps before totals are finalized.
Data Validation & Update Cycle
Outputs clear automatic variance flags, peer audit, and senior review. Mordor refreshes each model every year and reopens it when acquisitions, policy shifts, or major recalls alter market math, ensuring clients always receive the latest validated view.
Why Our Electric Cocktail Maker Baseline Earns Trust
Published figures often diverge because firms mix unlike devices, apply different price ladders, or refresh at uneven cadences.
We place 2025 revenue at USD 9.82 billion. Another global consultancy lists USD 9.29 billion. A trade journal counts only USD 0.30 billion for 2024. An industry body stretches to USD 56 billion by bundling manual tools.
Benchmark comparison
| Market Size | Anonymized source | Primary gap driver |
|---|---|---|
| USD 9.82 B (2025) | Mordor Intelligence | - |
| USD 9.29 B (2025) | Global Consultancy A | Narrower channel mix and lighter field checks |
| USD 0.30 B (2024) | Trade Journal B | Excludes commercial segment |
| USD 56 B (2023) | Industry Association C | Adds manual tools and broader appliances |
These contrasts confirm that by uniting traceable trade data with live expert validation, we deliver a balanced, transparent baseline that decision-makers can replicate and trust.


Key Questions Answered in the Report
What is the current size of the electric cocktail maker market?
The electric cocktail maker market stands at USD 10.35 billion in 2026 and is forecast to reach USD 13.47 billion by 2031.
Which region leads the electric cocktail maker market?
North America holds 40.12% revenue share, supported by mature cocktail culture and robust e-commerce infrastructure.
Which technology segment is growing fastest?
Robotic-arm mixers are projected to grow at a 10.42% CAGR due to their theatrical value and precision automation.
How fast is the hospitality sector adopting electric cocktail makers?
The hotels and resorts segment is expected to expand at 9.18% CAGR as operators pursue labor savings and consistent guest experiences.
What are the main restraints limiting market growth?
High upfront costs and limited consumer knowledge remain key barriers, especially in emerging markets.
Page last updated on:


