United Kingdom Hyperscale Data Center Market Size and Share
Market Overview
| Study Period | 2019 - 2031 |
|---|---|
| Forecast Data Period | 2025 - 2031 |
| Historical Data Period | 2019 - 2023 |
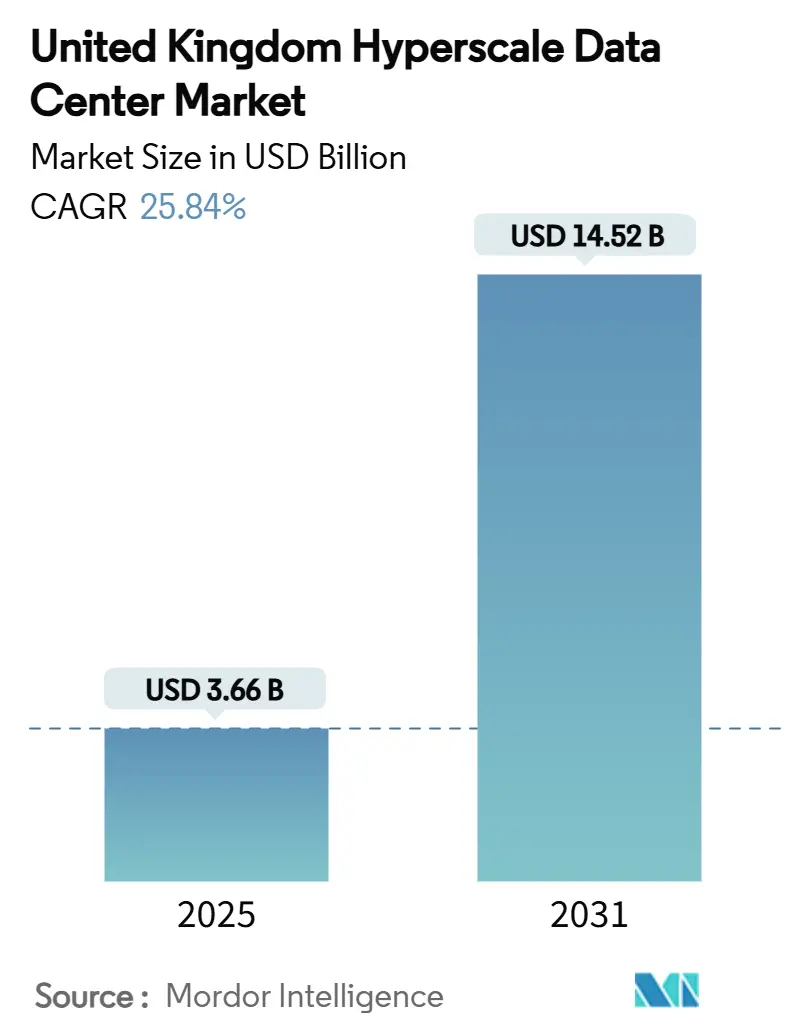
| Market Size (2025) | USD 3.66 Billion |
| Market Size (2030) | USD 14.52 Billion |
| Growth Rate (2025 - 2031) | 25.84% CAGR |
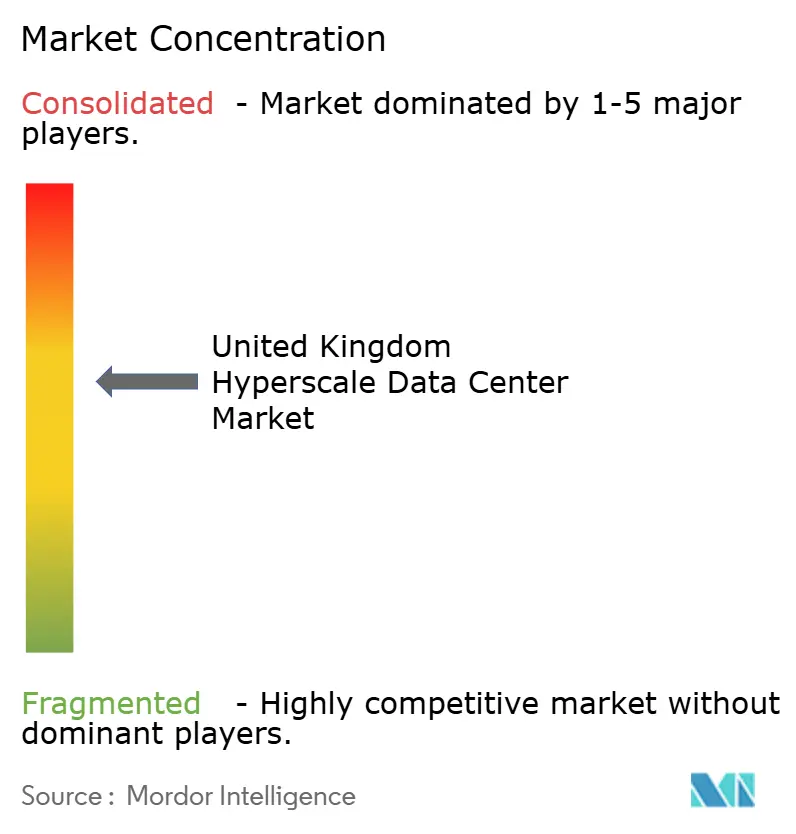
| Market Concentration | Medium |
Major Players *Disclaimer: Major Players sorted in no particular order Image © Mordor Intelligence. Reuse requires attribution under CC BY 4.0. | |
United Kingdom Hyperscale Data Center Market Analysis by Mordor Intelligence
The United Kingdom hyperscale data center market size reached USD 3,657.93 million in 2025 and is forecast to rise to USD 14,522.66 million by 2031, advancing at a 25.84% CAGR. Capacity is growing in tandem, with installed IT load expected to move from 3,485.33 MW in 2025 to 8,381.65 MW by 2031, a 15.75% CAGR. Demand for sovereign-grade cloud zones, AI-optimized racks, and secure energy supplies is accelerating value growth faster than capacity, making the United Kingdom hyperscale data center market the most dynamic digital-infrastructure arena in Europe. Power-density shifts from 5-10 kW to 80-100 kW per rack, large-scale liquid cooling adoption, and the government’s Critical National Infrastructure (CNI) status are reshaping investment criteria. Competitive barriers now hinge on grid-secured power allocations, renewable and nuclear energy pairing, and campus-scale sites that support 200+ MW AI clusters, which together underpin outsized revenue opportunities for incumbents with energy advantages.
Key Report Takeaways
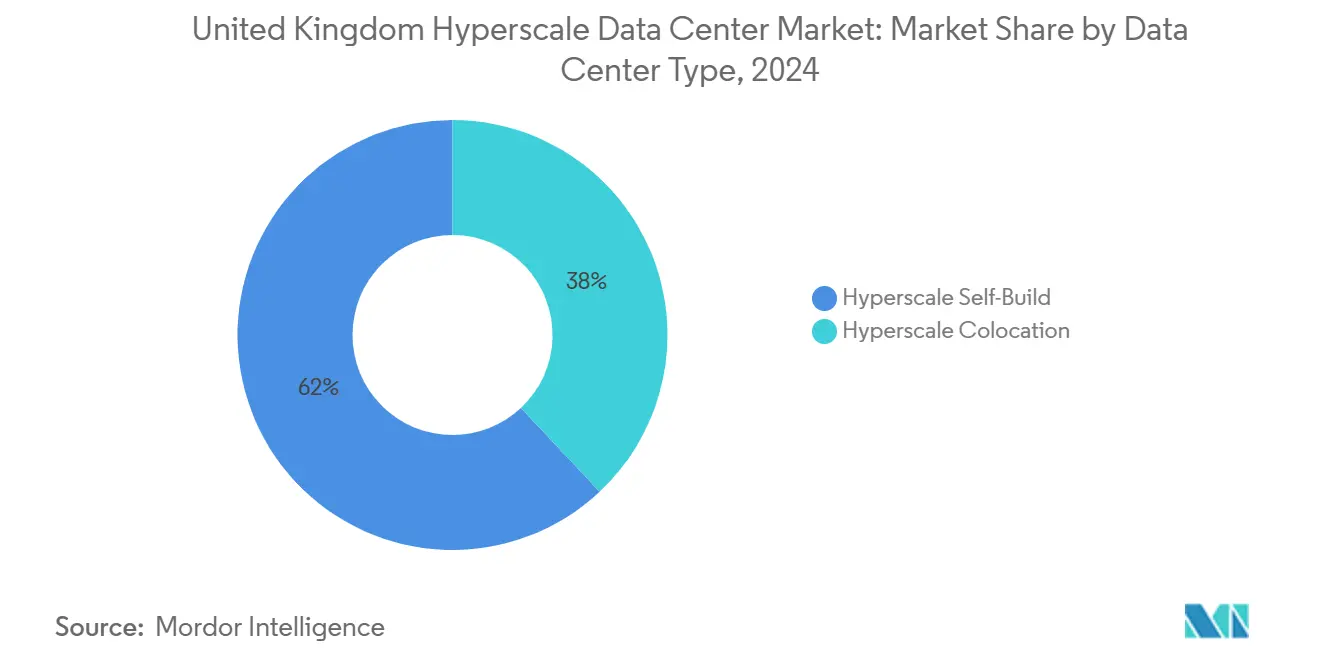
- By data center type, self-build facilities commanded 62% of United Kingdom hyperscale data center market share in 2024, while hyperscale colocation recorded the fastest 17.4% CAGR through 2031.
- By component, IT infrastructure led with 41% share of the United Kingdom hyperscale data center market size in 2024; cooling systems are projected to expand at a 27% CAGR to 2031.
- By tier standard, Tier III held 71% market share in 2024, whereas Tier IV infrastructure is advancing at a 14.2% CAGR through 2031.
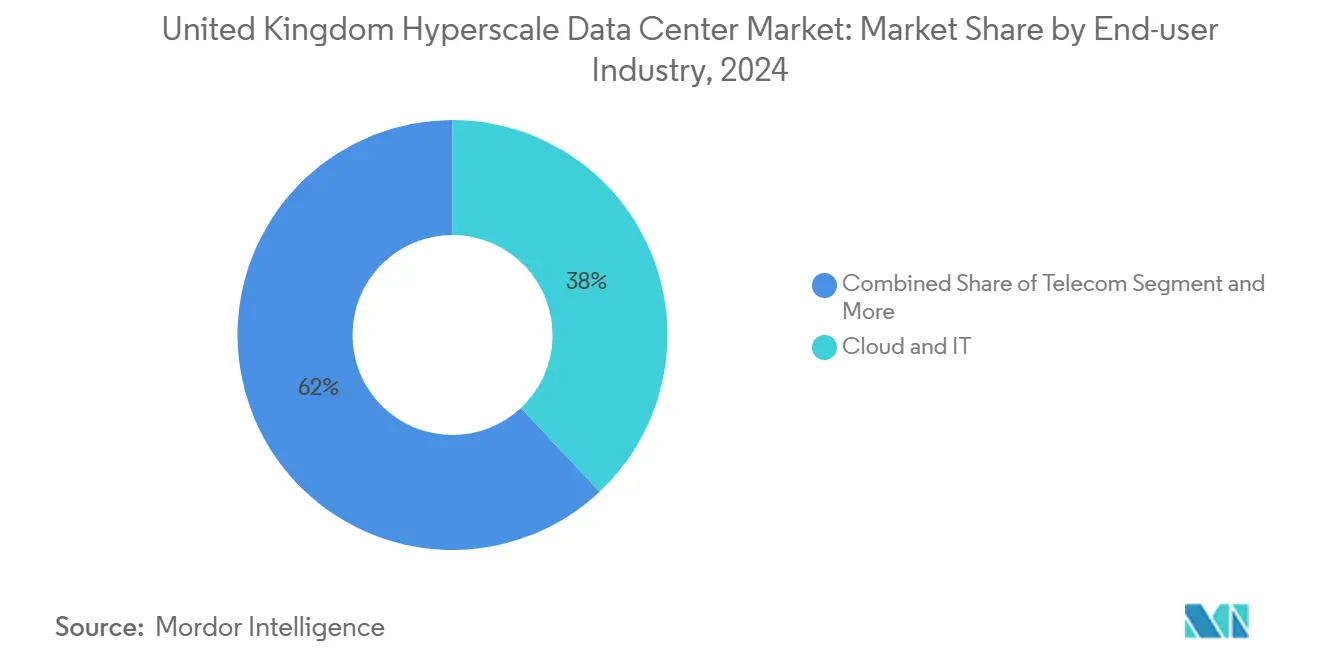
- By end-user industry, cloud and IT retained 38% share in 2024, and are growing at a 23.8% CAGR between 2025-2031.
- By data center size, massive facilities captured 46% share of the United Kingdom hyperscale data center market size in 2024; mega facilities are rising at a 19.5% CAGR to 2031.
- By geography, England – South East retained 54.00% share in 2024, and Scotland is growing at a 16.10% CAGR between 2025-2031.
United kingdom forms part of a network that extends across countries and regions, each contributing to a shared international environment. The global hyperscale data center market outlook by Mordor Intelligence consolidates those connections.
United Kingdom Hyperscale Data Center Market Trends and Insights
Drivers Impact Analysis*
| Driver | (~) % Impact on CAGR Forecast | Geographic Relevance | Impact Timeline |
|---|---|---|---|
| AI/ML rack power-density explosion | +8.20% | England South East, Scotland core facilities | Short term (≤ 2 years) |
| GenAI inference clusters demanding campus-scale liquid cooling | +6.80% | National hyperscale campuses | Medium term (2-4 years) |
| SMR-backed green PPAs lowering lifetime PUE | +4.10% | Scotland, Northern England | Long term (≥ 4 years) |
| 5G edge–core convergence spurring secondary-market builds | +3.70% | England Midlands, Wales | Medium term (2-4 years) |
| Public-sector sovereign-cloud zones | +5.30% | England South East secure campuses | Short term (≤ 2 years) |
| Re-patriation of latency-sensitive fintech workloads | +2.90% | London, Edinburgh | Short term (≤ 2 years) |
| Source: Mordor Intelligence | |||
AI/ML Rack Power-Density Explosion
The leap from 5-10 kW to 80-100 kW racks is forcing wholesale retrofits across legacy sites, creating a USD 2.3 billion upgrade opportunity. High-density AI racks require liquid cooling, re-architected electrical backbones, and compact UPS solutions engineered for burst loads [1].Schneider Electric, “Schneider Electric Announces New Solutions to Address the Energy and Sustainability Challenges Spurred by AI,” se.comFacilities in the South East are fast-tracking emergency cooling projects to retain GPU contracts, while Scotland is courting new builds where power and cooling headroom exist. Supply chains are pivoting from air-cooling vendors toward immersion-cooling specialists, disrupting traditional mechanical-infrastructure providers. Operators that cannot fund density upgrades risk asset obsolescence.
GenAI Inference Clusters Demand Campus-Scale Liquid Cooling Solutions
Single-campus GenAI clusters draw sustained 100 MW+ loads and achieve PUE as low as 1.02 with immersion cooling. Operators that assemble 200 MW AI campuses capture disproportionate wallet share because latency constraints prevent workload dispersal. Stellium’s Newcastle deployment of Open Compute-compatible immersion tanks exemplifies a national pivot to liquid cooling. Proprietary cooling designs are rising as hyperscalers internalize thermal engineering, squeezing third-party mechanical vendors. The clustering effect intensifies grid-power negotiations, cementing first-mover advantages for sites with pre-approved 400 kV taps.
SMR-Backed Green PPAs Enable Lifetime PUE Optimization
Small Modular Reactor (SMR) integration promises 24 × 7 carbon-free baseload and up to 20% lifetime PUE reduction. Clean-Power policy earmarks data centers as anchor tenants for SMRs, unlocking 500 GW of grid capacity release. Scotland’s wind-rich grid pairs well with SMRs for hybrid baseload-plus-renewable portfolios, enabling sub-1.1 PUE. Two-decade land leases near designated SMR zones indicate how energy security is eclipsing metro proximity as the top site-selection criterion. Early SMR adopters will lock in predictable energy costs for 60 years, building formidable cost moats.
5G Edge-Core Convergence Spurs Secondary Market Development
Standalone 5G reaching 1.85 Gbps download speeds validates sub-10 ms edge processing, prompting distributed builds across the Midlands and Wales. Lower land costs and refurbished industrial plots support compact edge nodes tethered to hyperscale cores. Vantage’s Bridgend conversion illustrates how de-industrialized zones can host 10-building campuses addressing manufacturing and media latency requirements. Edge-core convergence diversifies national capacity away from London, mitigating regional grid bottlenecks and creating new job clusters.
Restraints Impact Analysis*
| Restraint | (~) % Impact on CAGR Forecast | Geographic Relevance | Impact Timeline |
|---|---|---|---|
| Local-grid curtailment rules capping >30 MW draws | -4.60% | England South East | Short term (≤ 2 years) |
| GPU / silicon-photonics supply-chain bottlenecks | -3.20% | National | Medium term (2-4 years) |
| River-abstraction limits and water-use bans | -2.80% | South East water-stressed areas | Long term (≥ 4 years) |
| Heat- and carbon-levies | -1.90% | Greater London | Medium term (2-4 years) |
| Source: Mordor Intelligence | |||
Local-Grid Curtailment Rules Create Capacity Bottlenecks
Reforms that prioritize “ready-and-needed” connections have relegated 60 MW+ data centers to the back of the queue, delaying up to 40% of pipeline capacity. Interruptible contracts introduce operational risk, forcing operators to underwrite on-site generation or battery-energy-storage systems. Scarcity inflates land premiums for power-entitled plots and advantages incumbents that locked in 400 kV capacity early. Grid-independent approaches such as SMRs and green hydrogen peaking plants are gaining mindshare as curtailment persists [2]National Grid ESO, “Connections Queue Update January 2025,” nationalgrideso.com
GPU and Silicon-Photonics Supply Chain Bottlenecks Constrain AI Infrastructure
Allocation queues for NVIDIA H100 GPUs extend into 2026, and shortages of TRX5090 substrates slow switch-fabric rollouts. Large hyperscalers are signing multi-year pre-pays, sidelining smaller entrants. Extended lead times push operators to stagger fit-outs, reducing near-term capacity utilization. Chip supply uncertainties could trim rollout CAGRs by 3.2%, although silicon-photonics foundry expansions in Europe may relieve pressure from 2027 onward.
*Our forecasts treat driver/restraint impacts as directional, not additive. The impact forecasts reflect baseline growth, mix effects, and variable interactions.
Segment Analysis
By Data Center Type: Self-Build Dominance With Colocation Acceleration
Self-build facilities held 62% of United Kingdom hyperscale data center market share in 2024 as hyperscalers designed proprietary layouts for AI training uptime. These bespoke campuses integrate custom busways, direct-to-chip cooling, and enhanced blast-proof security suites. The United Kingdom hyperscale data center market size for self-build assets is projected to keep pace with sovereign-AI requirements through 2030, although expansion will hinge on grid connections.
Hyperscale colocation, registering a 17.4% CAGR, appeals to enterprises seeking AI clusters without capital outlay. Financial-services tenants use colocation to satisfy regulatory hosting mandates, while cloud providers offload disaster-recovery nodes. Consolidation, exemplified by Digital Realty’s London acquisitions, is creating multi-campus operators capable of offering 20 MW AI halls on demand.


By Component: IT Infrastructure Leads, Liquid Cooling Surges
IT infrastructure remained the largest component, representing 41% share of the United Kingdom hyperscale data center market size in 2024. GPU-optimized servers and NVMe fabrics dominate new rack deployments as AI workloads take precedence.
Liquid cooling is the breakout segment, forecast to grow 27% CAGR as rack densities climb. Providers are shipping immersion tanks pre-integrated with leak-detection, and OEMs are bundling coolant-ready GPUs. Electrical infrastructure is evolving to modular, lithium-ion UPS frames scaling beyond 5 MW per block, while mechanical infrastructure shifts toward coolant distribution units with 800 kW loops.
By Tier Standard: Tier III Prevalence Gives Way to Tier IV Premium
Tier III accounted for 71% share in 2024 due to its cost-efficiency for routine enterprise loads. Operators can complete maintenance without downtime, supporting most SaaS and web workloads.
Tier IV is expanding at 14.2% CAGR because AI model training cannot tolerate interruptions that reset multi-week jobs. The United Kingdom hyperscale data center market share for Tier IV halls is expanding inside sovereign-cloud and financial zones. Capex premiums of 40-60% are mitigated by avoided downtime penalties.
By End-User Industry: Cloud and IT Leadership Challenged by AI/HPC Surge
Cloud and IT captured 38% market share in 2024, with AWS, Azure, and Google Cloud expanding general compute. Telecom operators maintain a steady share driven by 5G edge nodes.
Cloud and IT hold the fastest-growing market share of 23.8% in the UK hyperscale data center market due to rising cloud adoption and digital transformation. Enterprises are rapidly shifting to cloud-based infrastructure to improve scalability and efficiency. Hyperscale providers are expanding data center capacity to meet this demand. This growth is also fueled by AI workloads and hybrid cloud strategies.

By Data Center Size: Massive Facilities Dominate While Mega-Scale Accelerates
Massive (Greater than 25 MW and less than equal to 60 MW) facilities held a 46% share in 2024 because they balance economics with grid-queue pragmatism. They remain the anchor for most multi-tenant campuses.
Mega (Greater than 60 MW) facilities are growing at 19.5% CAGR. Blackstone’s 750 MW Northumberland project exemplifies this momentum. Securing 400 kV feeds and onsite 200 MVA substations is becoming standard for new mega projects, reshaping vendor procurement toward utility-scale transformers and high-capacity switchgear.
Geography Analysis
England’s South East retained 54% share in 2024 thanks to London’s low-latency finance corridor and submarine-cable landings. Grid curtailment and water use restrictions, however, cap further megawatt additions, compelling operators to adopt closed-loop and air-side economizer systems, raising opex.
Scotland posts the fastest 16.1% CAGR, buoyed by wind-rich grids, cool climate, and streamlined planning. Renewable-tied PPAs and SMR pilot programs attract hyperscalers seeking carbon-free power. USD 33.5 billion in committed builds underscores investor confidence.
The Midlands and North are emerging overflow zones, aided by refurbished industrial estates and improving dark-fiber loops. Projects such as Kao Data’s Manchester campus anchor manufacturing edge workloads. Wales leverages industrial conversions like Bridgend to host 10-hall campuses, diversifying national capacity.
Mordor Intelligence delivers a comprehensive view of the hyperscale data center market across all major regions such as Europe, Asia, and North America, alongside country-level analysis for Spain, Netherlands, South Korea, Canada, India, and Germany, each offering a view of the local market realities.
Competitive Landscape
Competition is intensifying but remains moderately consolidated. The capital and grid-access barriers grant incumbents scale advantages, yet new entrants with energy innovations are eroding moats. Hyperscalers are vertically integrating, designing custom liquid-cooling manifolds and onsite substation blueprints. Colocation giants answer by acquiring power-entitled sites and offering AI-ready suites.
Energy strategy has become the principal differentiator. Operators securing SMR or long-term wind PPAs advertise sub-1.2 PUE and 24 × 7 carbon neutrality, influencing hyperscaler procurement. Technology differentiation centers on immersion cooling and high-speed silicon-photonic fabrics. Waste-heat recovery projects, such as pool-heating partnerships, create social-value narratives.
Market entry is hardest in the South East due to curtailment queue saturation. Secondary-market plays in the Midlands and Scotland attract private-equity funding but must compete on build-speed and sovereign-cloud compliance. Strategic M and A, typified by DigitalBridge’s Yondr acquisition, is reshaping the ownership map as funds hunt long-term, utility-like returns.
United Kingdom Hyperscale Data Center Industry Leaders
Amazon Web Services (AWS)
Microsoft Corp.
Meta Platforms, Inc.
Oracle Corp.
Alphabet Inc. (Google Cloud)
- *Disclaimer: Major Players sorted in no particular order

Recent Industry Developments
- January 2025: CoreWeave launched its first two UK data centers in Crawley and London Docklands to support NVIDIA-based AI workloads.
- January 2025: Vantage Data Centers secured a USD 9.2 billion equity injection to develop a 10-building Bridgend campus.
- January 2025: Nscale committed GBP 2 billion for AI-focused sites, starting with a 50 MW Essex facility.
- December 2024: Schneider Electric unveiled Galaxy VXL UPS and NVIDIA-codesigned reference architectures targeting AI power densities.
- October 2024: DigitalBridge agreed to acquire Yondr Group, adding 420 MW to its development pipeline.
- September 2024: The UK government granted data centers CNI status, aligning security and planning incentives.


Research Methodology Framework and Report Scope
Market Definitions and Key Coverage
Our study defines the United Kingdom hyperscale data center market as every purpose-built or fully converted facility within the country that delivers at least 5 MW of contiguous IT load to a single cloud or digital-platform tenant and offers carrier-dense connectivity, N+1 power backup, and high-efficiency cooling fit for AI clusters. According to Mordor Intelligence, both self-build campuses and wholesale halls leased by hyperscale operators fall inside this frame.
Scope exclusion: edge micro-sites, enterprise server rooms, and multi-tenant colocation suites under the 5 MW threshold are left outside the analysis.
Segmentation Overview
- By Data Center Type
- Hyperscale Self-build
- Hyperscale Colocation
- By Component
- IT Infrastructure
- Server Infrastructure
- Storage Infrastructure
- Network Infrastructure
- Electrical Infrastructure
- Power Distribution Unit
- Transfer Switches and Switchgears
- UPS Systems
- Generators
- Other Electrical Infrastructure
- Mechanical Infrastructure
- Cooling Systems
- Racks
- Other Mechanical Infrastructure
- General Construction
- Core and Shell Development
- Installation and Commissioning
- Design Engineering
- Fire, Security and Safety Systems
- DCIM / BMS Solutions
- IT Infrastructure
- By Tier Standard
- Tier III
- Tier IV
- By End-user Industry
- Cloud and IT
- Telecom
- Media and Entertainment
- Government
- BFSI
- Manufacturing
- E-Commerce
- Other End Users
- By Data Center Size
- Large (Less than equal to 25 MW)
- Massive (Greater than 25 MW and less than equal to 60 MW)
- Mega (Greater than 60 MW)
- By Geography
- England-South East
- England-Midlands
- England-North
- Scotland
- Wales
- Northern Ireland
Detailed Research Methodology and Data Validation
Primary Research
Mordor analysts interviewed design-build contractors, energy-procurement heads at hyperscale operators, and long-haul fiber carriers across London, Manchester, and Scotland. The conversations clarified build cost per MW, rack density trajectories, renewable power premiums, and go-live timelines, filling gaps left by published sources.
Desk Research
We first mapped national capacity using public planning filings from the Department for Levelling Up, National Grid ESO connection queues, HMRC server-import tallies, and Land Registry deeds around Slough and Dagenham. Additional context came from techUK position papers, Uptime Institute outage logs, Ofgem electricity sales, and peer-reviewed studies on liquid cooling efficiency. Company 10-Ks, sustainability reports, and project press releases were screened in Dow Jones Factiva, while D&B Hoovers supplied revenue splits to price construction versus IT gear. These references illustrate the mix; many other open datasets also informed desk verification.
Market-Sizing & Forecasting
In our model, a top-down build converts permitted megawatts into market value through current £/MW capex and IT equipment ratios, then checks totals against a bottom-up sample of six large campuses. Key levers: AI rack density, cloud workload penetration, renewable power premium, average build cost, and liquid cooling uptake feed a multivariate regression that projects demand to 2031. Any site-level blanks are bridged with supplier roll-ups and expert inputs before figures are finalized.
Data Validation & Update Cycle
Outputs pass variance checks against Ofgem sales, server-import trends, and FX shifts, followed by multi-step analyst review. Reports refresh once a year, with interim updates when material events, such as a new 200 MW campus award, occur; a fresh analyst pass precedes every client release.
Why Mordor's United Kingdom Hyperscale Data Center Baseline Stand Up to Scrutiny
Published estimates often differ because firms set varied facility thresholds, cost baskets, and cut-off years for spend recognition.
Peers sometimes bundle colocation halls and enterprise retrofits, freeze exchange rates, or assume uniform £/MW costs, whereas we update currency, inflation, AI-grade equipment premiums, and count only ≥5 MW single-tenant builds that have secured financing.
Benchmark comparison
| Market Size | Anonymized source | Primary gap driver |
|---|---|---|
| USD 3.66 B (2025) | Mordor Intelligence | |
| USD 5.75 B (2023) | Regional Consultancy A | Includes sites below 5 MW and relies on a 2023 base year |
| USD 9.50 B (2024) | Trade Journal B | Mixes AI hardware CAPEX with construction outlays |
| USD 10.69 B (2024) | Global Consultancy C | Tracks total data center spend, including colocation and enterprise facilities |
Because our scope is tighter, our variables transparent, and our refresh cadence annual, Mordor delivers a balanced, repeatable baseline that decision-makers can rely on with confidence.


Key Questions Answered in the Report
What is the projected value of the United Kingdom hyperscale data center market in 2031?
The sector is forecast to reach USD 14.52 billion by 2031.
Which data-center type is expanding fastest?
Hyperscale colocation is growing at a 17.4% CAGR as enterprises seek AI-ready capacity without capital hurdles.
Why is liquid cooling gaining traction?
Rack densities above 80 kW for AI workloads exceed air-cooling limits, making immersion and direct-to-chip solutions the most efficient path to sub-1.2 PUE.
Which region shows the fastest capacity growth?
Scotland leads with a 16.1% CAGR thanks to plentiful renewable power and streamlined permitting.
How are grid-connection constraints influencing site strategy?
Curtailment caps in the South East are pushing operators toward Scotland, Wales, and the Midlands, and spurring interest in SMR-backed private power.
What role do SMRs play in future builds?
Small Modular Reactors promise 24 × 7 carbon-free baseload, potentially lowering lifetime PUE by up to 20% and insulating operators from volatile grid-pricing.
Page last updated on:


