Australia Hyperscale Data Center Market Size and Share
Market Overview
| Study Period | 2019 - 2031 |
|---|---|
| Forecast Data Period | 2026 - 2031 |
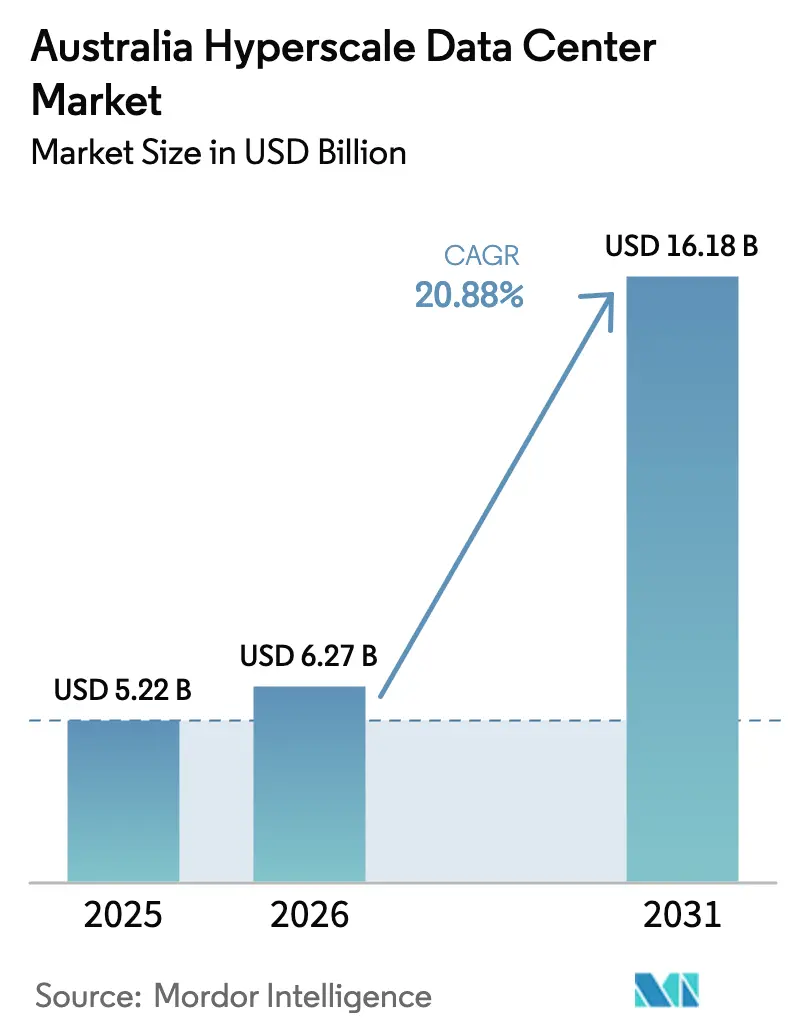
| Base Year Market Size (2025) | USD 5.22 Billion |
| Market Size (2026) | USD 6.27 Billion |
| Market Size (2031) | USD 16.18 Billion |
| Growth Rate (2026 - 2031) | 20.88% CAGR |
| Market Concentration | Medium |
Major Players *Disclaimer: Major Players sorted in no particular order Image © Mordor Intelligence. Reuse requires attribution under CC BY 4.0. | |
Australia Hyperscale Data Center Market Analysis by Mordor Intelligence
The Australia hyperscale data center market size is projected to expand from USD 5.22 billion in 2025 and USD 6.27 billion in 2026 to USD 16.18 billion by 2031, registering a CAGR of 20.88% between 2026 to 2031. Sovereign-cloud mandates, GPU-dense artificial-intelligence workloads that surpass 50 kW per rack, and real-time payment infrastructure that demands Tier IV resilience are accelerating spending. Operators are pressing ahead with liquid-cooling retrofits, on-site substations, and multi-hundred-megawatt campuses to keep pace with compute intensity. Self-build strategies remain dominant for cloud majors, yet hyperscale colocation is gaining traction as grid queues in New South Wales and Victoria stretch beyond 18 months. Availability-based renewable power-purchase agreements, together with direct-to-chip cooling, are emerging as the preferred hedge against volatile wholesale energy costs.
Key Report Takeaways
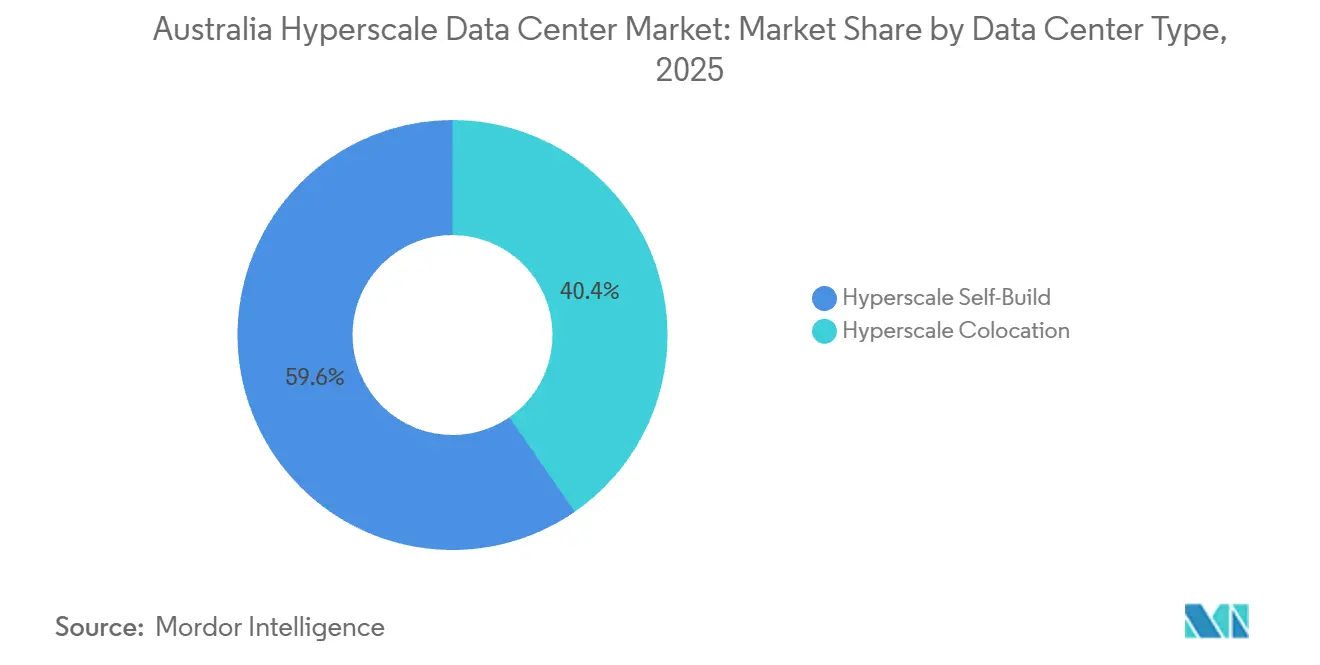
- By data center type, hyperscale self-build captured 59.63% Australia hyperscale data center market share in 2025, while hyperscale colocation is projected to expand at a 21.34% CAGR through 2031.
- By component, IT infrastructure accounted for a 45.77% share of the Australia hyperscale data center market size in 2025, whereas mechanical infrastructure is advancing at a 21.64% CAGR to 2031.
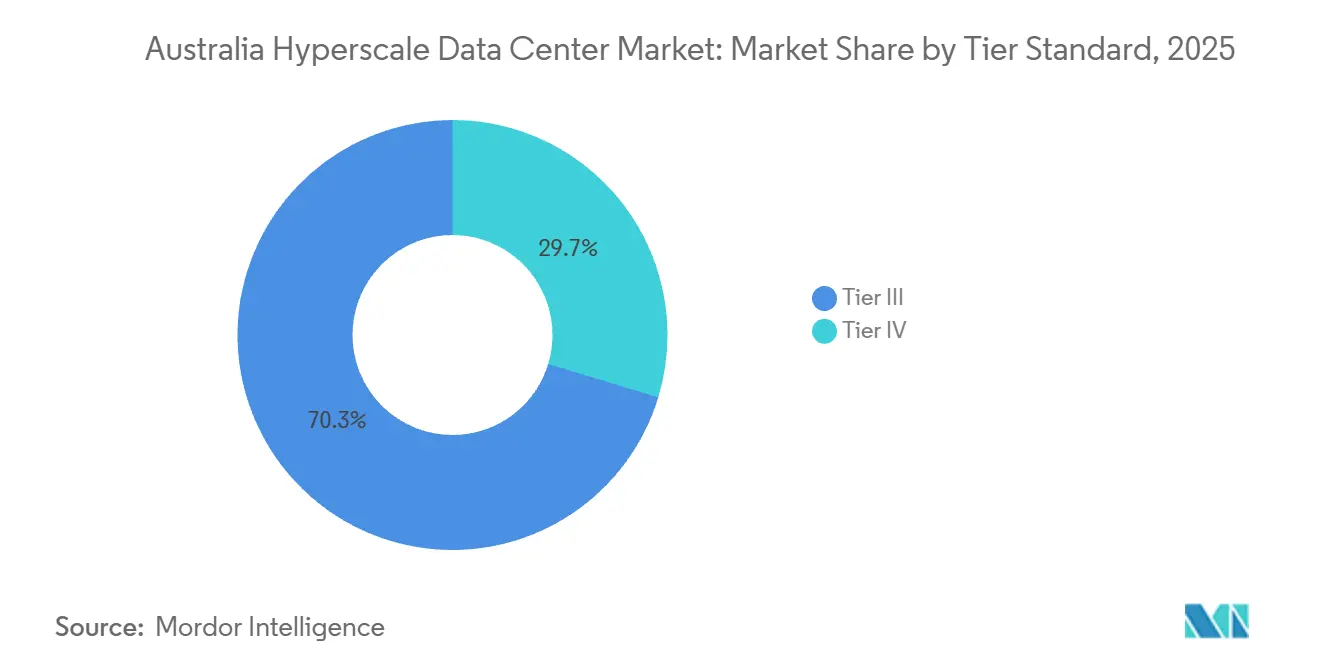
- By tier standard, Tier III held 70.32% of 2025 capacity, but Tier IV facilities are forecast to grow at a 21.72% CAGR through 2031.
- By data center size, massive facilities commanded 53.42% share of the Australia hyperscale data center market size in 2025, yet mega facilities above 60 MW are slated to rise at a 21.88% CAGR to 2031.
Note: Market size and forecast figures in this report are generated using Mordor Intelligence’s proprietary estimation framework, updated with the latest available data and insights as of January 2026.
Understanding the full system requires moving beyond Australia boundaries into a wider international view. Mordor Intelligence captures the global hyperscale data center market scope in its worldwide coverage.
Australia Hyperscale Data Center Market Trends and Insights
Drivers Impact Analysis*
| Driver | (~) % Impact on CAGR Forecast | Geographic Relevance | Impact Timeline |
|---|---|---|---|
| Exploding GPU-Centric AI, ML Workloads More Than 50 Kw Racks | +6.2% | National, concentrated in Sydney, Melbourne, Brisbane | Medium term (2-4 years) |
| Sovereign-Cloud Roll-Outs by Hyperscalers | +5.8% | National, driven by federal mandates in Canberra, Sydney, Melbourne | Short term (≤ 2 years) |
| Real-Time Payment Mandates Triggering Tier IV Builds | +3.4% | National, with hubs in Sydney, Melbourne | Medium term (2-4 years) |
| 5G Edge-Core Consolidation Forming Oceania Hubs | +2.9% | National, telco footprints in Sydney, Melbourne, Perth | Long term (≥ 4 years) |
| Genai Inference Build-Outs Needing Liquid-Cooling Campuses | +4.7% | National, early deployments in Sydney, Melbourne, Brisbane | Short term (≤ 2 years) |
| Availability-Based Renewable PPAs for Captive Supply | +2.6% | VIC, QLD, NSW, WA | Medium term (2-4 years) |
| Source: Mordor Intelligence | |||
Exploding GPU-Centric AI and ML Workloads
Rack densities are climbing beyond 50 kW as NVIDIA Blackwell Ultra and Vera Rubin architectures advance into pilot clusters across Australia. NextDC’s M4 Fishermans Bend AI Factory in Melbourne integrates liquid cooling across 150 MW, allowing the campus to host training and inference nodes that approach 100 kW per rack.[1]NextDC Limited, “M4 Fishermans Bend AI Factory Approval,” nextdc.com.au The International Energy Agency has projected a four-fold rise in global AI energy demand by 2030, underscoring the urgency of power-efficient designs.[2]International Energy Agency, “Data Centres and Data Transmission Networks,” iea.org Colocation providers now pre-install coolant manifolds and immersion tanks to shorten deployment cycles for tenants that cannot risk retrofits after occupancy. These design pivots explain why mechanical infrastructure is pacing the overall Australia hyperscale data center market and why liquid-cooling vendors are scaling domestic supply chains at speed.
Sovereign-Cloud Roll-Outs by Hyperscalers
Federal rules require sensitive workloads to remain on-shore, spurring Microsoft, AWS, and Google to double down on Tier IV campuses that carry explicit data-residency guarantees. AWS has earmarked AUD 20 billion (USD 13.2 billion) through 2029 for expansions in Sydney and Melbourne, supplementing its Top Secret Cloud that went live in 2024. Google’s deed of standing offer for Defence workloads finalized in 2025 extends the sovereign-cloud perimeter to classified networks nationwide. Operators that hold Uptime Institute Tier IV certifications, such as NextDC’s S2 Sydney, possess a decisive advantage when tendering for government or financial-services contracts. As these mandates cascade into state agencies and critical-infrastructure operators, demand is widening beyond Canberra into regional hubs, lifting utilization across certified facilities.
Real-Time Payment Mandates Triggering Tier IV Builds
The Reserve Bank of Australia is retiring the Bulk Electronic Clearing System by June 2030, moving 3.5 billion annual transactions to the always-on New Payments Platform. Continuous settlement elevates uptime requirements to 99.995%, effectively making Tier IV the baseline for clearing houses, core banking stacks, and card-scheme processors. Micron21’s MEL1 earned Australia’s first Tier IV design designation, and the credential now functions as a prerequisite for many payment firms that had previously deployed in Tier III halls. Rising construction costs further encourage colocation over self-build, as turnkey Tier IV space offers faster compliance and lower capital outlay. Collectively, these forces explain why Tier IV capacity is expanding faster than any other tier segment within the Australia hyperscale data center market.
5G Edge-Core Consolidation Forming Oceania Hubs
Telstra and Ericsson’s programmable 5G standalone network pushes compute toward regional aggregation nodes where thousands of small cells converge on dense fiber rings. AWS Outposts and Wavelength zones within Telstra exchanges cut latency for autonomous vehicles and industrial IoT, anchoring demand for 10-25 MW data halls in secondary cities. Nokia’s partnership with CID and Pivotel added private 5G-as-a-service options in 2025, widening the customer base for edge-aligned colocation. The Australian Energy Market Operator expects data centers to comprise 15% of large-industrial load by 2033-34, and a growing slice of that total will sit at the edge.[3]Australian Energy Market Operator, “Integrated System Plan 2024,” aemo.com.au Operators that can stitch together metro and edge footprints under a single service catalog now enjoy a differentiated position when courting media-streaming and low-latency gaming workloads.
Restraints Impact Analysis*
| Restraint | (~) % Impact on CAGR Forecast | Geographic Relevance | Impact Timeline |
|---|---|---|---|
| Grid Connection Queues in NSW and VIC Delaying Go-Live | -4.3% | NSW, VIC, spill-over into QLD | Short term (≤ 2 years) |
| Escalating Wholesale Power Prices Eroding Margin | -3.1% | National, acute in NSW, VIC | Medium term (2-4 years) |
| Water-Scarcity Restrictions in Western Sydney Cooling Risk | -2.4% | Western Sydney, emerging in Melbourne’s west | Medium term (2-4 years) |
| Skilled Labor Shortage in Mission-Critical Construction | -2.8% | National, acute in Sydney, Melbourne, Brisbane | Short term (≤ 2 years) |
| Source: Mordor Intelligence | |||
Grid Connection Queues in NSW and VIC Delaying Go-Live
Large-load interconnection approvals now take up to 36 months, pushing energization of several megacampuses into the next decade. The slippage of the VNI West upgrade from 2028 to 2030 limits headroom for new 300 MW blocks in the nation’s two most power-hungry states. CDC Data Centres’ 504 MW Marsden Park campus waited more than a year for final permits, demonstrating how regulatory lag defers revenue and compresses internal-rate-of-return assumptions. Cloud majors mitigate exposure by signing long-term renewable PPAs that secure priority access to capacity, yet these contracts cannot erase grid timing risk entirely. The bottleneck nudges some tenants toward colocation halls where the operator already holds energization slots, reinforcing the 21.34% CAGR projected for hyperscale colocation.
Escalating Wholesale Power Prices Eroding Margin
Spot electricity prices remain volatile because transmission constraints collide with coal-plant extensions and renewable intermittency. New South Wales and Victoria recorded peaks above 250 AUD/MWh (USD 165/MWh) in late-2025, squeezing operators whose tariffs float with the National Electricity Market index. Long-term renewable PPAs have become the most effective hedge, as seen in Fujitsu’s 10-year Sapphire Wind Farm deal and NBN Co’s portfolio of three solar and wind contracts. Developers that failed to lock in capacity before commodity inflation accelerated now face slimmer margins or must pass cost through to tenants. This dynamic intensifies the push for liquid cooling and battery storage that trim net-site power draw, partially offsetting tariff spikes.
*Our forecasts treat driver/restraint impacts as directional, not additive. The impact forecasts reflect baseline growth, mix effects, and variable interactions.
Segment Analysis
By Data Center Type: Colocation Demand Surges as Grid Bottlenecks Persist
Hyperscale self-build dominated in 2025, yet the Australia hyperscale data center market is shifting appreciably toward colocation as power-connection lead times lengthen. Self-build controlled 59.63% share in 2025, but the colocation route is forecast to climb at a 21.34% CAGR to 2031 as enterprises favor halls that can be energized within 12-18 months. Banks and payment firms driving real-time settlement requirements prioritize ready-to-use Tier IV suites rather than risking project delays tied to interconnection studies. Construction-cost inflation that lifted per-MW spend to USD 11.3 million in 2026 adds financial weight to the leasing argument for sub-100 MW tenants. Despite that, self-build remains vital for hyperscalers that need physical isolation and economies of very large scale, maintaining a dual-track ecosystem.
Self-build remains the configuration of choice for AI training clusters and sovereign-cloud workloads that cannot share critical infrastructure with other tenants. NextDC’s 550 MW S7 Eastern Creek campus and AirTrunk’s 354 MW MEL2 project illustrate the capital-intensity cloud majors accept to control design, security, and network topology end-to-end. These mega projects integrate on-site substations, liquid-cooling manifolds, and multi-decade renewable PPAs, bringing total ownership cost below that of comparable leased options at extreme scale. Colocation providers answer by bundling meet-me rooms, dark-fiber pairs, and dedicated substations to woo customers that fall short of building an entire campus. The Australia hyperscale data center market size is therefore expanding along two distinct vectors that increasingly complement rather than cannibalize each other.


By Component: Liquid-Cooling Retrofits Propel Mechanical Spend
IT infrastructure led with 45.77% share in 2025, yet mechanical infrastructure carries a faster 21.64% CAGR because cooling and air-flow systems require wholesale redesign to handle 100 kW racks. Direct-to-chip cold plates and immersion baths lift thermal efficiency, so pumps, heat exchangers, and coolant distribution units command a growing slice of the Australia hyperscale data center market size. Suppliers such as Modl Engineering and Iceotope scale domestic manufacturing to shorten lead times and align with local compliance. Immersion solutions cut fan energy, but they also reshape rack geometry, driving new demand for reinforced chassis and seismic anchoring. Together, these changes underscore mechanical systems’ rising budget share relative to compute silicon purchases.
Electrical infrastructure evolves in lockstep to match transient load swings from AI accelerators that spike to 98% utilization during training epochs. ABB’s ultra-low harmonic drives limit total harmonic distortion to under 3% and reclaim energy otherwise lost as heat, improving power-usage-effectiveness baselines across Tier IV halls. Battery storage is now a design default rather than a retrofit, as evidenced by Quinbrook’s Supernode Brisbane coupling 800 MW of compute with 2,000 MWh of batteries for ride-through and grid-services revenue. Liquid-cooling retrofits also stimulate ancillary spend on environmental monitoring and DCIM upgrades that track coolant flow, corrosion, and dielectric fluid health in real time. Mechanical vendors that offer closed-loop analytics stand to win share as uptime guarantees tighten.
By Tier Standard: Tier IV Accelerates Under Uptime Mandates
Tier III retained 70.32% share in 2025, but Tier IV halls are expanding at a 21.72% CAGR because real-time banking and sovereign-cloud mandates demand concurrent maintainability. The New Payments Platform enforces settlement finality that tolerates no downtime, and defence agencies explicitly specify Tier IV or equivalent for classified workloads. Colocation operators pursue Tier IV gold operational certifications to command premium rates and lure anchor tenants whose payments offset the 20-30% cost premium over Tier III builds. Insurance underwriters have begun granting lower risk premiums for Tier IV facilities, indirectly lowering long-run total cost of ownership for clients. These cascading incentives lock in a self-reinforcing adoption curve that should lift Tier IV share materially by 2031.
Tier III remains sufficient for cloud-software vendors and digital-media platforms that schedule brief maintenance windows during off-peak hours. Research counts 145 operational colocation facilities at Tier III, providing a deep bench of capacity for price-sensitive tenants that do not require dual active paths for every subsystem. Nonetheless, recent planning applications in Sydney, Melbourne, and Brisbane tilt decisively toward Tier IV, revealing investor confidence that higher resilience will pay back through government and fintech pre-leases. Over the forecast horizon, the market bifurcates into a premium Tier IV tranche that captures mission-critical demand and a cost-efficient Tier III tranche that absorbs the volume of general enterprise workloads.
By Data Center Size: Mega-Scale Campuses Rise for AI Inference
Massive facilities between 25 MW and 60 MW owned the largest share at 53.42% in 2025, yet mega campuses above 60 MW are poised to outgrow all other form factors at a 21.88% CAGR through 2031. AI inference clusters benefit from contiguous electrical blocks and east-west network fabrics that minimize hop latency, pushing hyperscalers to aggregate power at single sites rather than scatter across multiple metros. Mega campuses deliver scale economics that lower per-MW capex below USD 9 million once on-site substations and standardized modular pods are accounted for. Associated battery storage and hydrogen-ready backup turbines further future-proof these sites against grid curtailment rules introduced after 2030. Investors increasingly prefer mega projects because they attract anchor tenants that sign decade-long capacity reservations, de-risking project finance.
Large facilities under 25 MW still matter for edge-aligned and regional requirements, especially where 5G densification shortens the viable round-trip budget for latency-sensitive applications. Colocation providers in Adelaide, Hobart, and Townsville advertise small-footprint halls that support private 5G cores, content-delivery caches, and high-frequency trading links to Sydney. Massive facilities serve financial-services institutions that need dedicated halls but cannot justify a 300 MW campus, striking a balance between capex leverage and control. Planned pipelines reveal six projects above 500 MW across Australia’s East Coast, signaling that mega form factors will increasingly dominate upstream supplier contracts for transformers, switchgear, and liquid-cooling skids.
Geography Analysis
New South Wales and Victoria dominate the Australia hyperscale data center market owing to submarine-cable landings, dense fiber corridors, and global cloud-region footprints. Sydney’s Western corridor already hosts more than 900 MW of live supply, yet water allocation and interconnection slots are constrained, prompting developers to secure recycled-water rights and behind-the-meter solar arrays. Melbourne’s supply tripled to 4.7 GW by mid-2025, and live IT load hit 337 MW, with 95% of absorption coming from AI inference clusters that require liquid-cooling retrofits.
Queensland and Western Australia emerge as release valves for the congested East Coast, offering cheaper land, surplus grid headroom, and proximity to renewable-energy zones. Quinbrook’s 800 MW Supernode Brisbane co-locates 2,000 MWh of batteries, while CDC’s 200 MW Maddington site near Perth capitalizes on submarine-cable links that cut latency to Asia and Africa. The SMAP cable, operational in early-2026, underpins Perth’s role as a Western gateway, reinforcing investment appetite for multi-tenant facilities in the metro.
Canberra’s modest capacity serves as sovereign-cloud redundancy for federal agencies, and smaller edge-nodes in Adelaide, Darwin, and Hobart round out national coverage. Investors eye Tasmania’s hydropower surplus as a potential site for carbon-negative data halls once an upgraded Bass Strait interconnector is funded. Across regions, state incentives such as payroll-tax holidays and expedited planning approvals increasingly influence site selection, adding another variable to the evolving geographic balance within the Australia hyperscale data center market.
Mordor Intelligence examines the hyperscale data center market across diverse other regional markets as well, including Middle East, Africa, and South America, while also offering granular country-level perspectives for South Korea, Malaysia, Saudi Arabia, South Africa, Brazil, and Italy and more.
Competitive Landscape
The field counts 145 operational colocation sites, yet consolidation is under way as sovereign-cloud contracts and AI workloads favor operators that combine Tier IV uptime, liquid-cooling expertise, and renewable PPAs. NextDC, AirTrunk, and CDC Data Centres steer local share through multi-hundred-megawatt pipelines and strong balance sheets that support debt raises above USD 4 billion. Each pursues a trifecta of design priorities: embedded liquid-cooling loops, on-site substations with spare feeder capacity, and long-tenor PPAs that immunize opex against market shocks.
International entrants such as STACK Infrastructure and Digital Realty pursue modular deployments that start at 36 MW and scale in 18 MW increments, appealing to hyperscalers that value phased-build optionality. Quinbrook differentiates through an energy-plus-compute model that couples batteries with data halls, positioning the firm to bid into frequency-control ancillary-services markets. GreenSquareDC and EdgeConneX carve niches in water-constrained metros by championing two-phase, water-less cooling systems that align with upcoming consumption caps.
Technology remains the sharpest wedge among rivals. Leaders now ship immersion basins with quick-disconnect manifolds, 400/800 GbE fabrics, and AI-optimized DCIM overlays that automatically rebalance thermal zones. Compliance credentials such as ISO 27001, ISO 14001, and NABERS 5-Star energy ratings have become table stakes, while Tier IV operational certifications secure premium pricing among fintech and government tenants. Competitive intensity will heighten as sovereign-cloud renewals and GenAI expansions test the speed at which operators can bring fresh megawatts to market.
Australia Hyperscale Data Center Industry Leaders
Amazon Web Services Inc.
Microsoft Corporation
Google LLC
AirTrunk Operating Pty Ltd
NEXTDC Ltd
- *Disclaimer: Major Players sorted in no particular order

Recent Industry Developments
- February 2026: Microsoft signed a five-year sovereign-cloud contract with the Australian government, bundling Azure Stack Edge nodes in secure locations nationwide.
- January 2026: NextDC obtained final approval for the USD 1.32 billion M4 Fishermans Bend AI Factory in Melbourne, rated for 150 MW of liquid-cooled infrastructure.
- January 2026: Quinbrook closed USD 476 million in debt financing for its 800 MW Supernode Brisbane battery-plus-compute campus, accelerating stage-one delivery to 2025.
- December 2025: NextDC and OpenAI unveiled the USD 4.62 billion S7 Eastern Creek mega facility, targeting up to 650 MW of Tier IV capacity in Western Sydney.


Research Methodology Framework and Report Scope
Market Definitions and Key Coverage
Our study defines Australia's hyperscale data center market as the total annual revenue generated inside the country from newly built or fully commissioned facilities exceeding 20 MW of critical IT load that are owned, self-built, or long-term leased by cloud and other hyperscale operators. Energy sales from on-site solar or grid-feed PPAs, supplementary colocation halls below the 20 MW threshold, and managed hosting revenues are excluded.
Scope exclusions: Edge micro-sites, enterprise server rooms, and refurbishment projects are outside the valuation scope.
Segmentation Overview
- By Data Center Type
- Hyperscale Self-Build
- Hyperscale Colocation
- By Component
- IT Infrastructure
- Server Infrastructure
- Storage Infrastructure
- Network Infrastructure
- Electrical Infrastructure
- Power Distribution Units
- Transfer Switches and Switchgears
- UPS Systems
- Generators
- Other Electrical Infrastructure
- Mechanical Infrastructure
- Cooling Systems
- Racks
- Other Mechanical Infrastructure
- General Construction
- Core and Shell Development
- Installation and Commissioning Services
- Design Engineering
- Fire Detection, Suppression and Physical Security
- DCIM/BMS Solutions
- IT Infrastructure
- By Tier Standard
- Tier III
- Tier IV
- By Data Center Size
- Large ( Less than or equal to 25 MW)
- Massive (Greater than 25 MW and Less than equal to 60 MW)
- Mega (Greater than 60 MW)
Detailed Research Methodology and Data Validation
Primary Research
Mordor analysts interviewed facility engineers in Sydney and Melbourne, liquid-cooling OEM product heads, power-utilities planners, and procurement managers at cloud tenants; those conversations validated rack-density trends, typical wholesale rates, and commissioning timetables that secondary sources could only hint at. Follow-up surveys with design-build contractors in Perth and Brisbane filled geographic gaps and fine-tuned capacity lead-times.
Desk Research
We began with regulatory and statistical portals such as the Australian Energy Market Operator, the National Australian Built Environment Rating System, and IP Australia's patents database, which clarify power availability, building standards, and cooling-technology adoption. Trade associations, including the Australian Data Centre Association and the U.S. Uptime Institute, helped size Tier III and IV footprints, while company 10-Ks, press releases, and land-registry filings revealed hyperscaler capex pipelines. Subscription assets from D&B Hoovers and Dow Jones Factiva supplied consistent financial and project cost ranges. This list is illustrative; numerous additional documents were consulted for cross-checks and clarification.
Market-Sizing & Forecasting
A blended top-down reconstruction of national hyperscale MW additions, derived from AEMO grid-connection data and import statistics for high-density server racks, sets the demand pool, which is then corroborated with selective bottom-up roll-ups of disclosed campus capacities, sampled average selling prices, and channel checks. Key variables fed into the model include median rack density (kW), GPU server share, NABERS 5-star penetration, renewable-power PPA uptake, and land-banked megawatt capacity awaiting permits. Forecasts to 2031 employ multivariate regression layered on scenario analysis, letting CAGR assumptions flex with power-price trajectories and AI workload adoption rates. Where supplier roll-ups under-report early-stage builds, weighting adjustments based on planning-approval milestones bridge the gap.
Data Validation & Update Cycle
Output passes a three-level review: analyst, senior domain lead, and research quality cell, and is reconciled with external indicators such as import duties on 3-phase UPS modules. The model refreshes every twelve months, and earlier if a single deal exceeds 10% of the prior-year market value; a final sense-check is run immediately before publication.
Why Mordor's Australia Hyperscale Data Center Baseline Commands Investor Confidence
Published estimates seldom align because firms differ on facility-size cut-offs, revenue versus capex accounting, and refresh cadence.
We acknowledge these moving pieces upfront.
Benchmark comparison
| Market Size | Anonymized source | Primary gap driver |
|---|---|---|
| USD 5.25 B (2025) | Mordor Intelligence | - |
| USD 1.01 B (2023) | Regional Consultancy A | Combines Australia with NZ and omits projects above 60 MW |
| USD 12.91 B (2024) | Global Consultancy B | Includes colocation, edge, and HPC; revenue plus capex mixed |
| USD 6.81 B (2024) | Trade Journal C | Values construction investment, not operating revenue |
Taken together, the comparison shows that when scope, metric, and year are harmonized, Mordor's disciplined variable selection and annual refresh provide a balanced, transparent baseline that decision-makers can retrace and replicate with confidence.


Key Questions Answered in the Report
How quickly will Australian hyperscale capacity grow through 2031?
The Australia hyperscale data center market size is projected to rise from USD 6.27 billion in 2026 to USD 16.18 billion by 2031, translating to a 20.88% CAGR.
What factors drive the rising preference for Tier IV facilities?
Real-time payment rails and sovereign-cloud agreements require 99.995% uptime, and Tier IV certification delivers the redundancy and maintainability those workloads demand.
Why is liquid cooling becoming mainstream in Australian data centers?
AI racks that exceed 50 kW outstrip the thermal limits of air systems, so operators adopt direct-to-chip and immersion solutions to cut energy use and meet water-reduction targets.
Which states are gaining share beyond New South Wales and Victoria?
Queensland and Western Australia attract new builds due to surplus grid capacity, cheaper land, and renewable resources, exemplified by Quinbrook's 800 MW Supernode Brisbane.
How do operators manage exposure to volatile power prices?
Long-term renewable PPAs with wind and solar farms fix electricity costs for up to 15 years, stabilizing opex and satisfying sustainability mandates.
What explains the growing shift toward colocation for some enterprise users?
Protracted grid-connection timelines and construction-cost inflation make turnkey halls attractive for firms needing live capacity within 18 months, avoiding multi-year self-build delays.
Page last updated on:


