Europe Hyperscale Data Center Market Size and Share
Market Overview
| Study Period | 2020 - 2032 |
|---|---|
| Forecast Data Period | 2026 - 2032 |
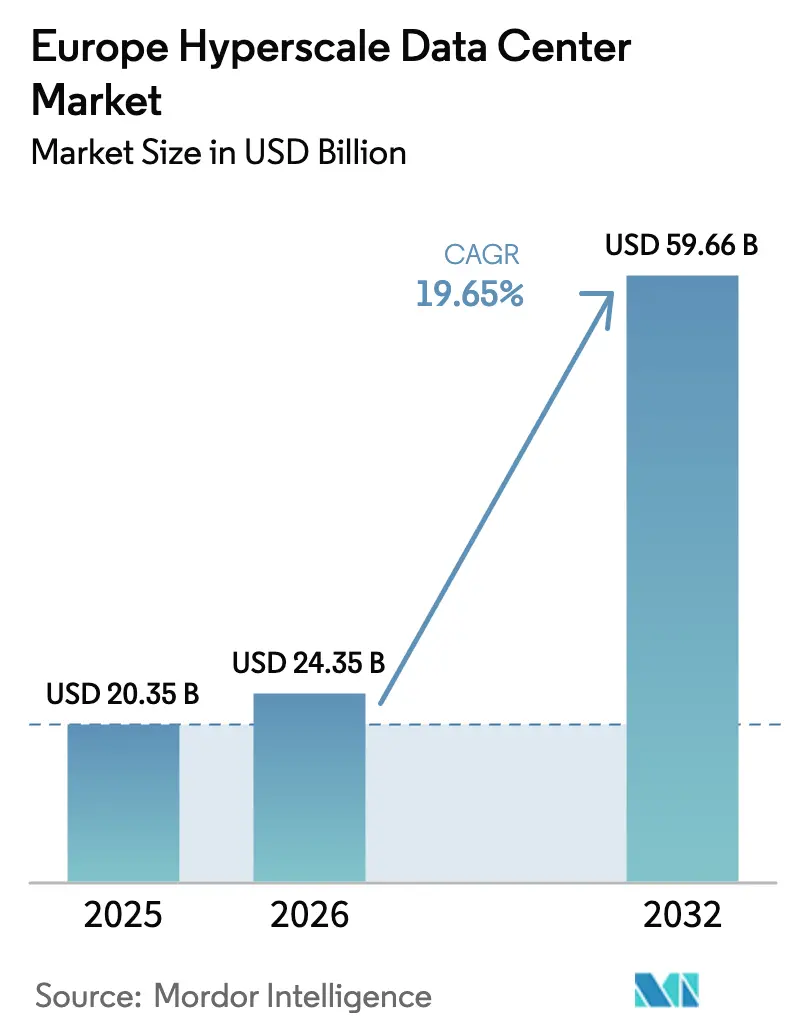
| Base Year Market Size (2025) | USD 20.35 Billion |
| Market Size (2026) | USD 24.35 Billion |
| Market Size (2032) | USD 59.66 Billion |
| Growth Rate (2026 - 2032) | 19.65% CAGR |
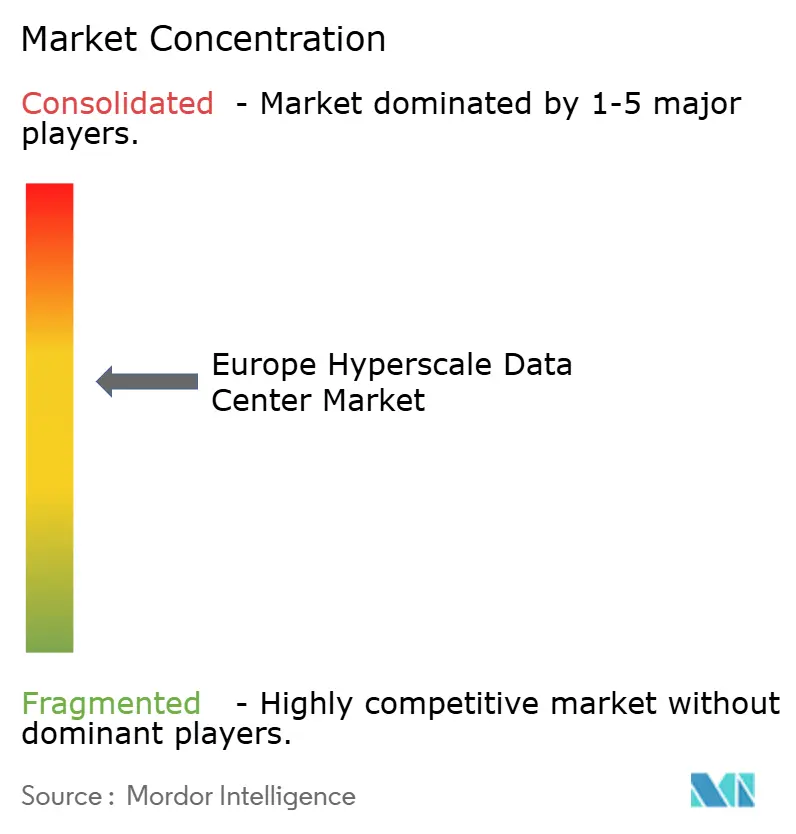
| Market Concentration | Medium |
Major Players *Disclaimer: Major Players sorted in no particular order Image © Mordor Intelligence. Reuse requires attribution under CC BY 4.0. | |
Europe Hyperscale Data Center Market Analysis by Mordor Intelligence
The Europe hyperscale data center market size is expected to grow from USD 20.35 billion in 2025 to USD 24.35 billion in 2026 and is forecast to reach USD 59.66 billion by 2031 at 19.65% CAGR over 2026-2031. The volume trajectory rises from 17,626.48 MW in 2025 to 34,207.57 MW by 2031, a parallel 11.68% CAGR that reflects the physical scale required for sovereign-cloud, AI, and instant-payments workloads. Accelerated investment comes from hyperscalers seeking European digital-sovereignty assurances, escalating GPU demand, and sustained regulatory pushes for local data processing. Thermal-management innovation, particularly liquid cooling, has emerged as a decisive capital-allocation factor. Simultaneously, supply-chain frictions around GPUs, copper, and optical modules are lengthening build timelines, prompting operators to lock in strategic inventory. Competitive dynamics now reward providers with AI-ready infrastructure, captive renewables, and credible sovereignty credentials, while scale-driven mergers underscore the sector’s capital intensity.
Key Report Takeaways
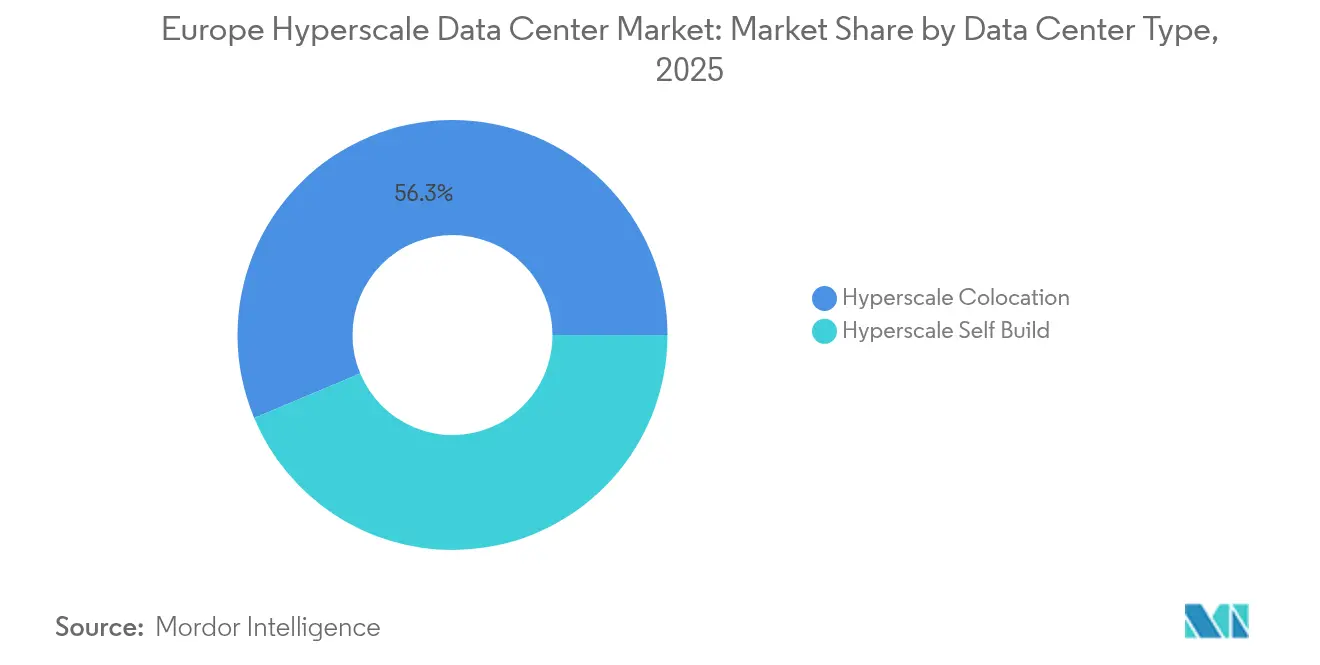
- By data center type, colocation led with a 56.30% revenue share in 2025; self-build deployments are advancing at a 17.9% CAGR through 2031.
- By component, IT infrastructure commanded 40.55% of the Europe hyperscale data center market share in 2025 and liquid cooling systems are expanding at a 24.1% CAGR to 2031.
- By tier standard, Tier III facilities accounted for 67.20% of the Europe hyperscale data center market size in 2025 while Tier IV deployments are growing at a 15.4% CAGR through 2031.
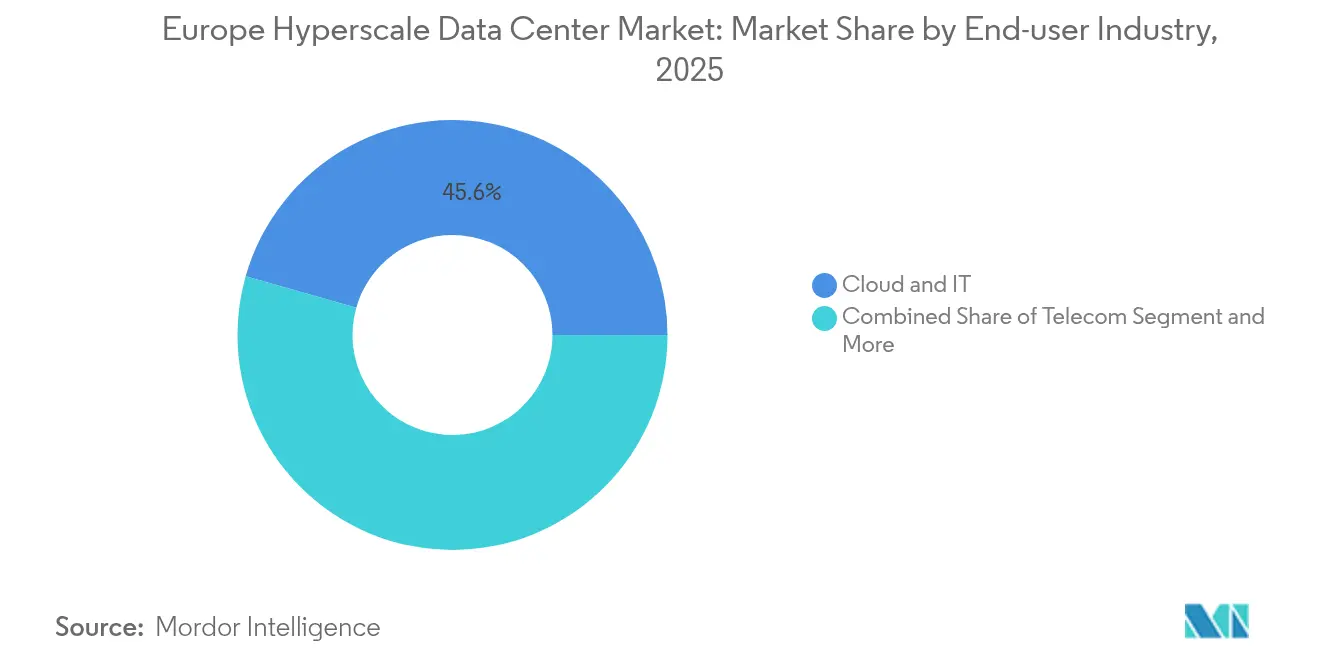
- By end-user industry, cloud and IT providers held 45.60% share in 2025; GenAI specialists are forecast to post a 20.3% CAGR to 2031.
- By data center size, massive facilities captured 51.35% share of the Europe hyperscale data center market in 2025 and mega sites are rising at a 18.8% CAGR to 2031.
- By geography, Ireland led with 18.75% market share in 2025, whereas Spain is projected to record the fastest 12.5% CAGR through 2031.
Note: Market size and forecast figures in this report are generated using Mordor Intelligence’s proprietary estimation framework, updated with the latest available data and insights as of 2026.
Anticipated developments are shaped at a system level, with Europe signals feeding into a larger global picture. The outlook on global hyperscale data center market consolidates these expectations.
Europe Hyperscale Data Center Market Trends and Insights
Drivers Impact Analysis Table*
| Driver | (~) % Impact on CAGR Forecast | Geographic Relevance | Impact Timeline |
|---|---|---|---|
| GPU-dense AI/ML training clusters driving greater than 50 kW racks | +4.20% | Ireland, Germany, Netherlands | Short term (≤ 2 years) |
| Sovereign-cloud roll-outs (GAIA-X, national clouds) | +3.80% | EU-wide; strongest in Germany, France | Medium term (2-4 years) |
| Instant-payments and PSD2 pushing Tier IV builds | +2.10% | Germany, Netherlands | Medium term (2-4 years) |
| 5G edge–core consolidation favouring Nordic hubs | +1.90% | Nordic and Baltic states | Long term (≥ 4 years) |
| Gen-AI inference demanding liquid-cooling campuses | +3.50% | Netherlands, Germany | Short term (≤ 2 years) |
| Availability-based PPAs for captive renewables | +2.70% | Nordics, Spain, Portugal | Long term (≥ 4 years) |
| Source: Mordor Intelligence | |||
GPU-dense AI/ML Training Clusters Driving greater than 50 kW Racks
Rack power densities have breached 50 kW as European manufacturers such as BMW and Mercedes-Benz shift AI model-training in-house, forcing data-center designs toward direct-to-chip liquid cooling [1]NVIDIA Corporation, “NVIDIA Launches Germany Industrial AI Cloud,” nvidia.com. NVIDIA’s 10,000-GPU industrial AI cloud in Germany underpins new benchmarks, while Supermicro’s deployment of 2,000+ liquid-cooled racks since mid-2024 illustrates scaling urgency. Density hotspots first emerged in Ireland, Germany, and the Netherlands where renewable-heavy grids and lenient tax frameworks coalesce. Sustained GPU scarcity compels operators to pre-purchase accelerator inventory, reinforcing forward-capacity reservations and extending construction lead times. Liquid cooling shifts capital away from air-handling units toward pumps, CDU skids, and heat-exchangers, lifting the Europe hyperscale data center market’s mechanical-infrastructure bill of materials.
Sovereign-cloud Roll-outs (GAIA-X, National Clouds)
GAIA-X has institutionalized European data-sovereignty requirements, catalyzing hyperscale build-outs under domestic control. Deutsche Telekom’s 8ra program to deploy 10,000 edge-cloud nodes by 2030 marks a structural realignment toward nationally anchored platforms [2]Deutsche Telekom AG, “8ra Edge-Cloud Initiative,” telekom.com. AWS’s EUR 7.8 billion Brandenburg sovereign-cloud region reinforces investor confidence that U.S. hyperscalers will localize operations where regulation dictates. The Digital Services Act and incoming AI Act embed auditability and traceability rules that favour GAIA-X-compliant facilities, translating regulatory pressure directly into capex allocations. Over the medium term, sovereignty credentials will differentiate providers as strongly as price or latency, accelerating uptake of in-region hyperscale capacity.
Gen-AI Inference Demanding Liquid-Cooling Campuses
Inference workloads prioritize deterministic latency over sporadic peak power, forcing year-round thermal stability. Closed-loop direct liquid cooling now delivers up to 30% energy savings and supports greater than 100 kW per rack, with 20% of European sites already running some form of liquid technology. BSO’s DataOne campus near Paris targets 400 MW by 2028, configured exclusively for immersion-ready racks and zero-carbon operations. Germany and the Netherlands tightened water-consumption standards, making liquid systems economical despite higher upfront outlays. Campus-scale builds permit shared heat-recovery loops, enabling operators to sell waste heat to district-energy grids and offset opex, reinforcing the Europe hyperscale data center market’s sustainability narrative.
Availability-based PPAs for Captive Renewables
Hyperscalers now contract renewable output on an availability basis, matching workload profiles to variable generation and easing grid-balancing costs. Microsoft’s USD 3.2 billion Swedish AI investment runs exclusively on Nordic hydropower and wind, illustrating the model’s viability. Spain’s draw for hyperscale newcomers aligns with abundant solar output and progressive grid-stability incentives. Multi-year PPAs (10-15 years) de-risk energy supply and justify investments in on-site battery storage, anchoring Europe hyperscale data center market projects in regions previously overlooked. Waste-heat offtake contracts further enhance the economics by monetizing unavoidable thermal by-products.
Restraints Impact Analysis*
| Restraint | (~) % Impact on CAGR Forecast | Geographic Relevance | Impact Timeline |
|---|---|---|---|
| Water-usage restrictions on evaporative cooling | -2.80% | Netherlands, Germany, Denmark | Short term (≤ 2 years) |
| GPU and optical-module supply bottlenecks | -3.20% | Global; acute in EU growth hubs | Short term (≤ 2 years) |
| Rising heat-tax and carbon levies | -1.90% | Netherlands, Germany | Medium term (2-4 years) |
| Local-grid caps on greater than 30 MW connections | -2.40% | Secondary metros such as Barcelona, Berlin | Medium term (2-4 years) |
| Source: Mordor Intelligence | |||
Water-usage Restrictions on Evaporative Cooling
Dutch and German regulators now curb new evaporative systems, citing drought risks. Amsterdam limits hyperscale builds to pre-zoned municipalities, pushing operators toward closed-loop liquid architectures [3].Dentons, “Netherlands Tightens Water Usage Rules,” dentons.com Retrofits of legacy sites can exceed USD 10 million, squeezing margins for incumbents and making new-build liquid-cooled campuses relatively more attractive. The policy shift makes water usage effectiveness (WUE) as critical a KPI as PUE, embedding sustainability premiums in lease negotiations across the Europe hyperscale data center market.
GPU and Optical-module Supply Bottlenecks
Lead times for H100/H200 GPUs now surpass 12 months, driven by substrate shortages in Japan and Taiwan. Optical-module constraints delay 400/800 GbE network roll-outs, extending time-to-revenue on greenfield sites. Operators with multi-year allocation agreements, notably the top three hyperscalers, secure preferential shipments, widening the capacity gap to emerging providers. Supply tightness hinders rapid scale-out strategies, tempering the Europe hyperscale data center market’s near-term growth complexion even as demand accelerates.
*Our forecasts treat driver/restraint impacts as directional, not additive. The impact forecasts reflect baseline growth, mix effects, and variable interactions.
Geography Analysis
Ireland leads with 18.75% 2025 market share, buoyed by Dublin’s submarine-cable density and English-language operational base. Grid-constraint moratoria from 2023 onward slowed new permits around Dublin, redirecting hyperscale interest toward western and southern counties where renewable headroom exists. Sustainability pressures have fast-tracked heat-recovery pilots, and policy outcomes here serve as bellwethers for similar congested metros.
Spain ranks as the fastest-growing geography at a 12.5% CAGR through 2031, propelled by EUR 33 billion in announced hyperscale spend. Aragon’s dry climate is offset by abundant solar PV under availability-based PPAs, anchoring AWS’s EUR 15.7 billion cluster. Barcelona’s strategic link to Africa and LATAM via Medusa submarine cable elevates its low-latency profile, fostering a regional interconnection ecosystem that amplifies the Europe hyperscale data center market’s southward shift.
Nordic countries showcase a cohesive value proposition: 100% renewable grids, free-air cooling, and stable policy frameworks. Microsoft’s USD 3.2 billion Swedish program epitomizes the localization of AI workloads to carbon-neutral zones. Denmark’s Tier IV pipeline complements Norway’s hydropower surplus, while Finland’s waste-heat reuse mandates turn facilities into net-positive contributors for municipal district-heating. Germany and the Netherlands continue as core hubs despite stricter permitting and heat levies, preserving their status through rich peering fabrics and enterprise proximity within the Europe hyperscale data center market.
Analysis of the hyperscale data center market by Mordor Intelligence spans multiple other regional evaluations across North America, Middle East, and Africa, supported by country-level insights for Germany, Spain, Netherlands, France, Norway, and Sweden, wherein local market conditions keep varying from one country to another.
Segment Analysis
By Data Center Type: Colocation Dominance, Self-build Surge
Colocation still accounts for 56.30% of 2025 revenue, anchored by multinational enterprises seeking capital-light expansion and cross-connect density that underpins hybrid-cloud strategies. The Europe hyperscale data center market size attributable to colocation is forecast to grow steadily, but its share contracts as hyperscalers internalize capacity.
Self-build deployments are forecast to grow at an 17.9% CAGR through 2031. Hyperscalers pursuing non-standard power trains, liquid-cooling loops, and proprietary security stacks demand customization beyond traditional colocation service catalogs. Mega campus deals in Ireland and the Nordics illustrate where grid capacity, renewables, and tax regimes align for self-build economics. Providers like Digital Realty blur boundaries by offering powered-shell models tailored for GPU-dense footprints, reflecting a hybrid evolution inside the Europe hyperscale data center market.


By Component: IT Infrastructure Leads, Liquid Cooling Accelerates
IT infrastructure retained 40.55% of 2025 spending, reflecting an arms race for GPUs, NVMe storage, and 400 GbE switches. Europe hyperscale data center market share for server boards alone eclipses 25 % of total IT outlays as AI workloads scale.
Liquid-cooling systems post the fastest 24.1% CAGR. Direct-to-chip loops, rear-door heat-exchangers, and immersion tanks dominate mechanical-infrastructure RFPs. Electrical systems follow density growth: busways rated beyond 800 A, 3+ distributed UPS blocks, and tie-breaker schemes that future-proof for 2 n+1 redundancy. General-construction updates emphasize slab-floor loading above 2,000 kg/m² and ceiling clearances that accommodate overhead coolant piping, illustrating the evolving bill of materials in the Europe hyperscale data center market.
By Tier Standard: Tier III Foundation, Tier IV Momentum
Tier III facilities comprised 67.20% of installed capacity in 2025 as operators balanced uptime and cost. They remain the backbone for elastic workloads like content streaming and SaaS.
Tier IV grows at a 15.4% CAGR, propelled by PSD2 instant-payments and AI inference SLAs. Frankfurt, London, and Amsterdam concentrate Tier IV builds where financial and sovereign demands converge. Hybrid layouts arise: a Tier IV core for payments clearing sits adjacent to Tier III halls for analytic back-tests, optimizing capex while sustaining compliance inside the Europe hyperscale data center market.
By End-user Industry: Cloud and IT Lead, GenAI Ascends
Cloud and IT users held 45.60% share in 2025, driven by region launches from AWS, Microsoft Azure, and Google Cloud. Europe hyperscale data center market size expansion in this segment persists as EU digital-sovereignty rules enforce in-region processing.
GenAI companies record a 20.3% CAGR, reflecting surging parameter counts and model iteration cycles. Dedicated AI startups and automotive OEMs alike seek GPU clusters unavailable on multitenant clouds. BFSI, telecom, manufacturing, and e-commerce maintain predictable year-on-year expansions tied to Industry 4.0 and 5G roll-outs, ensuring diversified demand across the Europe hyperscale data center market.
By Data Center Size: Massive Sites Rule, Mega Campuses Rise
Massive facilities controlled 51.35% share in 2025, balancing grid-interconnection feasibility and modular phasing. The Europe hyperscale data center market size for this class underpins most sovereign-cloud regions.
Mega campuses greater than 60 MW exhibit a 18.8% CAGR. Start Campus’s 1.2 GW Sines project and AWS’s 3-region Aragon investment spotlight ambition. Larger footprints unlock district-heating synergies and co-located renewable assets, reducing levelized cost of electricity. Edge-oriented large facilities (less than equals to 25 MW) remain relevant for latency-sensitive use cases, rounding out a tiered topology across the Europe hyperscale data center market.
Competitive Landscape
Consolidation defines the current phase, yet the combined market share of the top five players remains below 55%, indicating a moderately concentrated arena. Digital Realty’s EUR 8.4 billion Interxion acquisition vaulted the firm to second place, adding Marseille’s key submarine-cable landing site to its portfolio. Equinix sustains EMEA leadership at 22% retail-colocation share and differentiates via Fabric interconnection plus NVIDIA DGX-Ready validation.
Strategic moves skew toward AI-specific capacity and sovereign-cloud compliance. Vantage committed EUR 1.4 billion for new Frankfurt and Milan campuses optimized for liquid cooling and 75 kW average rack densities. Evroc’s EUR 4 billion plan to build a GAIA-X-native network of 10 hyperscale sites aims to disrupt incumbents by offering locational energy arbitration, spinning workloads toward regions with surplus renewables.
Partnerships with hardware suppliers intensify: Equinix and NVIDIA co-develop on-prem DGX Cloud nodes, while Digital Realty aligns with Intel to integrate silicon photonics across its EMEA estates. Operators pursue captive renewable portfolios, illustrated by Interxion’s Spanish solar JV for 300 MW and Green Mountain’s wind-backed Norwegian expansions. Amid escalating capex, sale-leaseback transactions and REIT conversions supply fresh capital inflows, continually reshaping competition within the Europe hyperscale data center market.
Europe Hyperscale Data Center Industry Leaders
Amazon Web Services
Microsoft Azure
Google Cloud
Meta Platforms
Apple
- *Disclaimer: Major Players sorted in no particular order

Recent Industry Developments
- May 2025: NTT DATA disclosed plans exceeding USD 10 billion for European builds, including a 128 MW Milan campus, to satisfy AI-driven demand.
- April 2025: Apollo Funds acquired STACK Infrastructure’s European portfolio and launched an independent hyperscale platform spanning five countries.
- January 2025: Digital Realty and Blackstone formed a USD 7 billion venture for AI-ready facilities in continental Europe.
- January 2025: Microsoft announced USD 80 billion global AI data-center spend, prioritizing European expansion.
- August 2024: Digital Realty bought a 15 MW campus in Slough, UK, for USD 200 million to bolster regional capacity.
- January 2025: Yondr delivered the first 20 MW phase of its Bischofsheim campus in Germany.


Research Methodology Framework and Report Scope
Market Definitions and Key Coverage
Our study counts revenue generated inside European facilities that house hyperscale workloads, deployments above 10 MW built or leased by cloud-native platforms and social media majors, and the supporting power, IT, and mechanical systems they operate. The frame captures self-builds and build-to-suit colocation halls but leaves out enterprise, edge, or sub-scale server rooms.
Scope exclusion: Enterprise and edge data centers operating below 10 MW are outside this sizing.
Segmentation Overview
- By Data Center Type
- Hyperscaler Self-build
- Hyperscale Colocation
- By Component
- IT Infrastructure
- Server Infrastructure
- Storage Infrastructure
- Network Infrastructure
- Electrical Infrastructure
- Power Distribution Unit
- Transfer Switches and Switchgears
- UPS Systems
- Generators
- Other Electrical Infrastructure
- Mechanical Infrastructure
- Cooling Systems
- Racks
- Other Mechanical Infrastructure
- General Construction
- Core and Shell Development
- Installation and Commissioning
- Design and Engineering
- Fire Detection and Physical Security
- DCIM / BMS Solutions
- IT Infrastructure
- By Tier Standard
- Tier III
- Tier IV
- By End-user Industry
- Cloud and IT
- Telecom
- Media and Entertainment
- Government
- BFSI
- Manufacturing
- E-Commerce
- Other Industries
- By Data Center Size
- Large (Less than equal to 25 MW)
- Massive (Greater than 25 MW and less than equal to 60 MW)
- Mega (Greater than 60 MW)
- By Geography
- United Kingdom
- Germany
- Ireland
- Netherlands
- France
- Spain
- Italy
- Nordic Region
- Denmark
- Finland
- Norway
- Sweden
- Russia
- Rest of Europe
Detailed Research Methodology and Data Validation
Primary Research
Mordor analysts interviewed European colo developers, grid operators, cooling OEM engineers, and hyperscale procurement managers across FLAP-D hubs and the Nordics. These calls validated utilization ramps, average rack densities, and sovereign-cloud contract queues that secondary sources only hint at.
Desk Research
We began with public-domain datasets from Eurostat, ENTSO-E grid statistics, national land registries, and trade bodies such as the European Data Centre Association, then layered in customs codes for servers (847141) and switches (851762) to sense hardware inflow trends. Company 10-Ks, planning-permission filings, and deal trackers hosted on D&B Hoovers and Dow Jones Factiva enriched capex timelines. Academic papers on liquid-cooling PUEs from IEEE Xplore and patent families in Questel helped anchor technology shifts. This list is illustrative; many additional open and paid sources informed our desk phase.
Market-Sizing & Forecasting
We first built a top-down model. Annual hyperscale IT load (MW) was reconstructed from grid connection disclosures and occupancy ratios, multiplied by average blended service prices per kW to derive 2025 revenue. Select bottom-up checks, supplier roll-ups of switchgear shipments and sampled EUR / MW turnkey costs, tempered totals. Key variables tracked include GPU-dense rack share, renewable-PPA penetration, average land cost per MW, EU heat-reuse incentives, and time-to-power-on delays. A multivariate regression with these drivers underpins the 2025-2031 forecast, with scenario buffers for grid-capacity bottlenecks. Data gaps in smaller markets were bridged using nearest-neighbor price and utilization analogs vetted during interviews.
Data Validation & Update Cycle
Outputs pass a three-layer review: model-versus-metric variance checks, senior peer audits, and re-contact of earlier respondents if deviations top 5%. We refresh figures annually, issuing interim updates when material events, large campus launches or policy shifts, surface.
Credibility Anchor: Why Our Europe Hyperscale Data Center Baseline Commands Trust
Published estimates diverge because firms pick different revenue bases, asset classes, and timing cuts.
Key gap drivers include: some publishers treat total construction investment rather than recurring service revenue, some exclude colocation halls that host hyperscale tenants, while others confine scope to hardware sales only. Mordor fixes scope early, aligns currencies to constant 2024 USD, refreshes yearly, and ties every assumption back to verifiable MW and EUR/kW evidence.
Benchmark comparison
| Market Size | Anonymized source | Primary gap driver |
|---|---|---|
| USD 20.35 B (2025) | Mordor Intelligence | - |
| USD 31.39 B (2023) | Global Consultancy A | Measures capex outlays, not annual service revenue |
| USD 6.94 B (2024) | Industry Research Group B | Counts only hardware component sales, omitting operating fees |
| USD 30.78 B (2023) | Regional Consultancy C | Adds wholesale colocation capacity below 10 MW into hyperscale total |
The comparison shows how scope and metric choices swing numbers. Mordor's disciplined bottom-line revenue lens, cross-checked with MW evidence, offers decision-makers the most balanced, transparent baseline. (Current market value and forecast: USD 20.35 B in 2025 rising to USD 61.27 B by 2031).


Key Questions Answered in the Report
What is the projected Europe hyperscale data center market size by 2031?
It is forecast to reach USD 59.66 billion, advancing at a 19.65% CAGR.
Which European country is the fastest-growing hyperscale data-center destination?
Spain leads with a projected 12.5% CAGR through 2031, driven by EUR 33 billion in announced investments.
Why is liquid cooling pivotal for future European hyperscale sites?
GPU-dense AI workloads push rack densities beyond 50 kW; liquid cooling cuts energy use up to 30% and meets water-usage restrictions.
How are sovereign-cloud regulations shaping capacity deployment?
EU rules mandate data residency and operational control, prompting localized build-outs like AWS’s EUR 7.8 billion Brandenburg region.
What share of the market do Tier IV facilities hold and why are they growing?
Tier IV sites currently represent 32.80% of new pipeline capacity and are expanding at 15.4% CAGR as instant-payments and AI workloads demand 99.995% uptime.
Which component segment is growing the fastest in European hyperscale data centers?
Liquid-cooling systems, projected at a 24.1% CAGR, outpace all other components due to extreme rack-power densities.
Page last updated on:


