United Kingdom E-Commerce Warehouse Market Size and Share
Market Overview
| Study Period | 2020 - 2031 |
|---|---|
| Forecast Data Period | 2026 - 2031 |
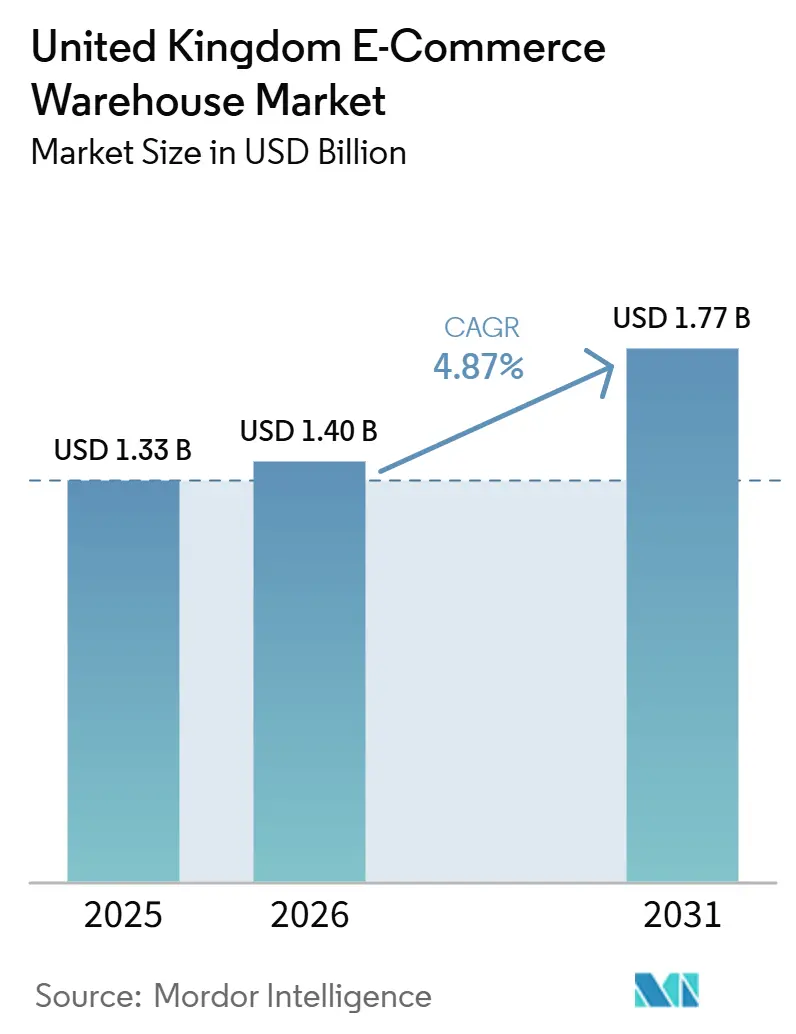
| Base Year Market Size (2025) | USD 1.33 Billion |
| Market Size (2026) | USD 1.40 Billion |
| Market Size (2031) | USD 1.77 Billion |
| Growth Rate (2026 - 2031) | 4.87% CAGR |
| Market Concentration | Medium |
Major Players *Disclaimer: Major Players sorted in no particular order Image © Mordor Intelligence. Reuse requires attribution under CC BY 4.0. | |
United Kingdom E-Commerce Warehouse Market Analysis by Mordor Intelligence
The United Kingdom e-commerce warehouse market size is expected to increase from USD 1.33 billion in 2025 to USD 1.40 billion in 2026, and reach USD 1.77 billion by 2031, growing at a CAGR of 4.87% over 2026-2031.
Customs reforms that speed cross-border flows, escalating sustainability retrofits, and a shift toward returns-heavy omnichannel models combine to reshape site selection, design, and capital budgeting across the United Kingdom e-commerce warehouse market. Automated capacity comes onstream more slowly than planned because grid connections lag behind demand, yet Robotics-as-a-Service (RaaS) subscriptions broaden access to high-throughput technology[1]“UK Border Target Operating Model,” UK Cabinet Office, gov.uk. Developers pivot from speculative builds to pre-let projects as interest-rate volatility lifts debt service costs, while freeport incentives tilt new construction toward Scotland and Wales, diversifying growth beyond England’s traditional dominance.
Key Report Takeaways
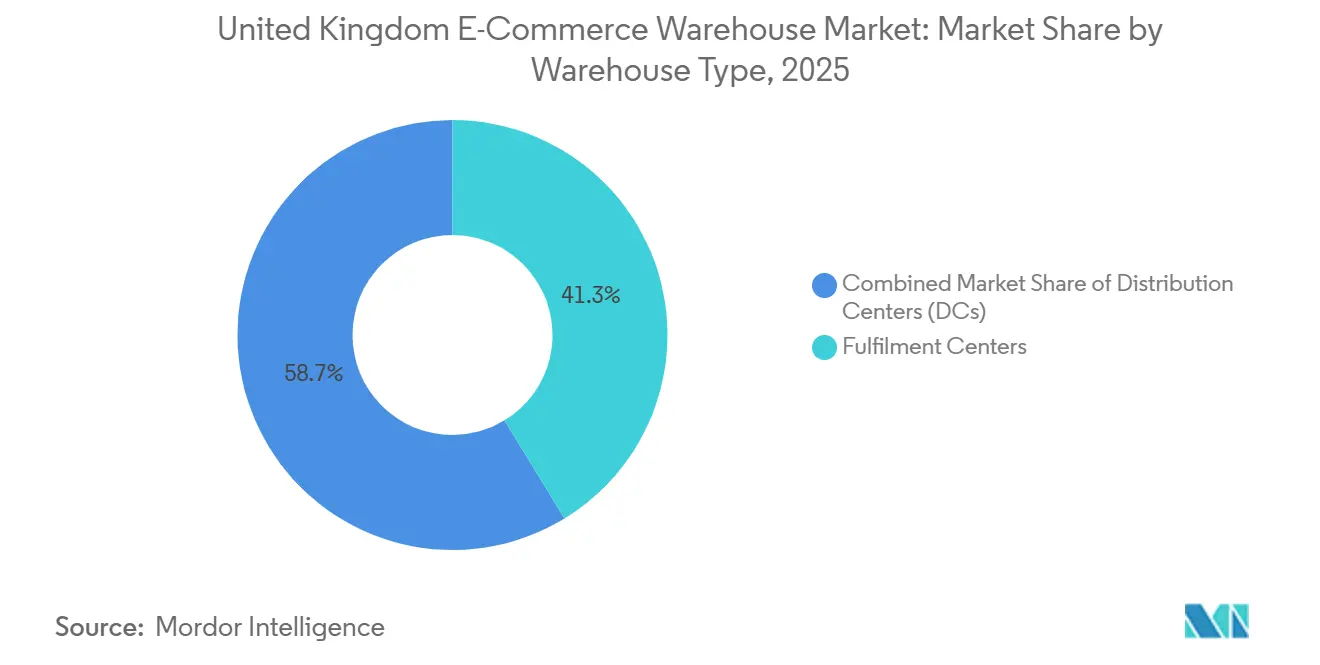
- By warehouse type, fulfilment centers held 41.28% of the United Kingdom e-commerce warehouse market share in 2025, and dark stores/micro-fulfilment centers are forecast to advance at a 10.1% CAGR to 2031.
- By service type, storage captured 52.97% of the United Kingdom e-commerce warehouse market size in 2025, while value-added services will grow at a 9.57% CAGR through 2031.
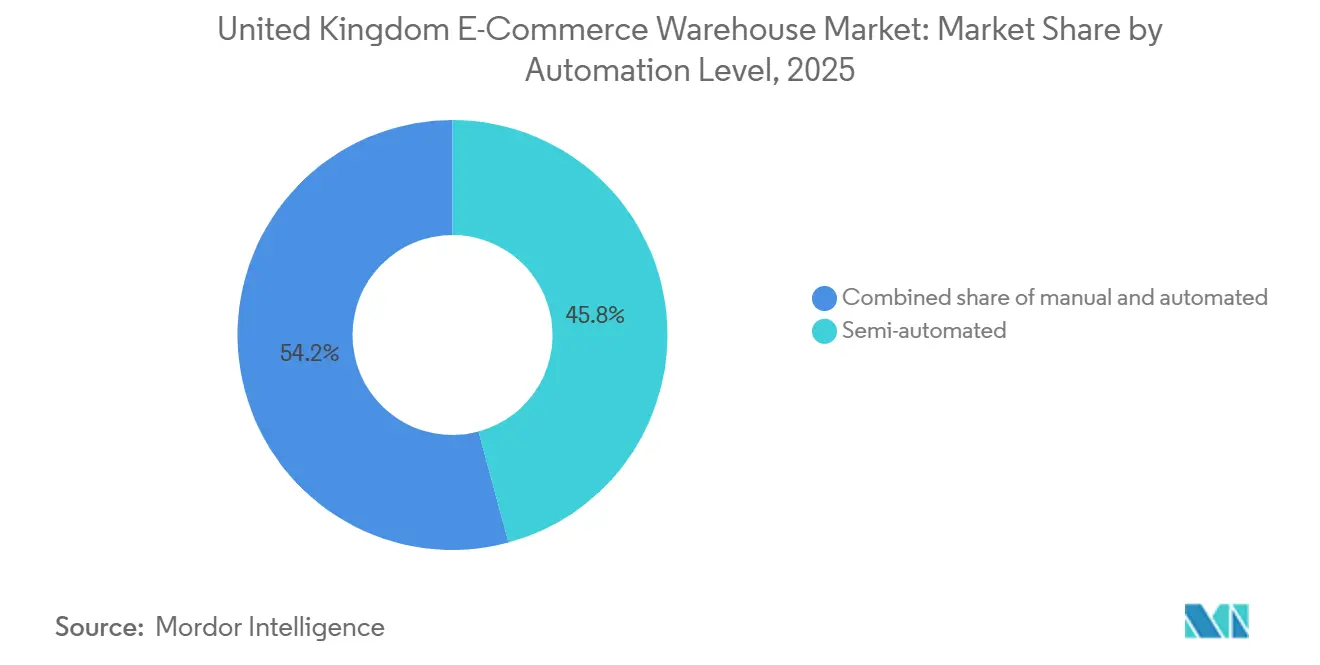
- By automation level, semi-automated facilities accounted for 45.81% of the United Kingdom e-commerce warehouse market share in 2025, whereas automated sites are projected to expand at a 9.18% CAGR between 2026 and 2031.
- By end-user industry, grocery and FMCG led with 24.02% market share of the United Kingdom e-commerce warehouse market in 2025, and pharmaceuticals, beauty, and wellness are poised for a 9.68% CAGR through 2031.
- By region, England commanded 44.14% share of the United Kingdom e-commerce warehouse market in 2025, and Scotland will log the fastest 8.71% CAGR over 2026-2031 on the back of freeport tax reliefs.
Note: Market size and forecast figures in this report are generated using Mordor Intelligence’s proprietary estimation framework, updated with the latest available data and insights as of January 2026.
United Kingdom E-Commerce Warehouse Market Trends and Insights
Drivers Impact Analysis*
| Driver | (~) % Impact on CAGR Forecast | Geographic Relevance | Impact Timeline |
|---|---|---|---|
| Post-Brexit customs simplification accelerating cross-border parcel inflows | +0.9% | Port-proximate regions of England and Scotland | Medium term (2-4 years) |
| Exploding omnichannel returns volumes elevating reverse-logistics space needs | +1.1% | Urban England and Wales, national spread | Short term (≤ 2 years) |
| Sustainability mandates unlocking retrofit demand | +0.8% | England first, then Scotland and Wales | Long term (≥ 4 years) |
| Robotics-as-a-Service broadening automation access | +0.7% | Major logistics hubs | Medium term (2-4 years) |
| Conversion of vacant retail assets into urban hubs | +0.6% | Core cities across the United Kingdom | Short term (≤ 2 years) |
| Freeport cross-docking for EU-bound parcels | +0.5% | Scottish and Welsh freeports, select English sites | Long term (≥ 4 years) |
| Source: Mordor Intelligence | |||
Post-Brexit Customs Simplification Accelerating Cross-Border Parcel Inflows
The full Border Target Operating Model introduced in 2024 shrank EU parcel clearance from 48-72 hours to 6-12 hours, reviving volumes to 94% of 2019 levels by Q4-2025. Bonded sites inside 30 minutes of ports now obtain 15-20% rent premiums, and the United Kingdom e-commerce warehouse market increasingly concentrates near designated Border Control Posts. Freeport adjacency lets 3PLs cross-dock EU-bound shipments without incurring import duties, saving retailers 8-12% in total logistics cost. Fierce competition for land has lifted coastal industrial values 25-35% above comparable inland estates, compelling developers to accept thinner yields to secure plots. The pivot toward customs-efficient nodes amplifies port-centric capacity shortfalls within the United Kingdom e-commerce warehouse market.
Exploding Omni-Channel Returns Volumes Elevating Reverse-Logistics Space Needs
Apparel returns hit 28-32% and electronics 18-22% in 2025, forcing operators to devote 15-20% of floor space to returns triage, grading, and resale streams. Reverse flows now add 40-50% more handling touches per order, inflating labor budgets and making software-driven disposition logic a must-have. Facilities that couple refurbishment, re-labeling, and recommerce shipping capture fee uplifts of USD 2.50-6.30 per unit, supporting the 9.57% CAGR outlook for value-added services. Retailers benchmark 48-hour reintegration cycles, so latency becomes a contract-award determinant within the United Kingdom e-commerce warehouse market. Operators lacking standardized returns processes watch margins erode as penalty clauses tighten.
Sustainability Mandates Unlocking Retrofit Demand
EPC-B targets for 2030 affect roughly two-thirds of legacy stock, opening a USD 3.2-3.8 billion retrofit pipeline[2]“Managing Returns in Retail,” British Retail Consortium, brc.org.uk. Solar rooftops now fund themselves within six years by displacing up to 40% of onsite electricity, and BREEAM “Excellent” certification secures 8-12% rental premiums. The United Kingdom e-commerce warehouse market, therefore, sees older sheds traded at discounts, then swiftly upgraded with insulation, LED lighting, and ventilation improvements. Tenants use green clauses that pass energy costs back to landlords if ratings backslide, compelling owners to monitor performance continually. Retrofit installers report order backlogs stretching 18-24 months, signaling sustained demand beyond the headline compliance date.
Robotics-as-a-Service Broadening Automation Access
RaaS contracts priced at USD 2,500-5,100 per robot per month cut capex outlays by 60-70% relative to purchase models. Throughput jumps 100-150%, and accuracy climbs to 99.8%, letting midsize firms match tier-one benchmarks inside the United Kingdom e-commerce warehouse market. Fleets flex 40-60% during seasonal peaks with no stranded capital, but infrastructure retrofits for Wi-Fi meshes and charging docks add USD 19-32 per square foot. Electricity demand rises sharply, pressuring grid quotas that already delay connections up to 48 months. Operators balance robot counts against power ceilings, adopting hybrid pick-to-light and AMR combos to hedge.
Restraints Impact Analysis*
| Restraint | (~) % Impact on CAGR Forecast | Geographic Relevance | Impact Timeline |
|---|---|---|---|
| Interest-rate volatility constraining debt-funded builds | -0.8% | Nationwide, acute in England | Short term (≤ 2 years) |
| Limited grid capacity delaying automated sites | -0.7% | Key logistics corridors | Medium term (2-4 years) |
| Business-rates revaluation uncertainty | -0.6% | Primarily England | Short term (≤ 2 years) |
| Cyber-insurance premium escalation | -0.5% | Highly automated facilities | Medium term (2-4 years) |
| Source: Mordor Intelligence | |||
Interest-Rate Volatility Constraining Debt-Funded Warehouse Development
Base-rate swings between 4.5-5.25% in 2025 raised senior loan coupons to 6.5-7.5%, lifting equity requirements to 35-45% for speculative builds[3]“Monetary Policy Report February 2025,” Bank of England, bankofengland.co.uk. Supply pipeline shrank 35-45% from 2022 peaks, tightening vacancy below 3% in core corridors. Developers now lean on forward-funded deals, locking 15-year leases with blue-chip e-tailers before breaking ground, a shift that lowers liquidity but stabilizes risk within the United Kingdom e-commerce warehouse market. Smaller regionals lacking balance-sheet heft pause projects or exit entirely, accelerating consolidation in land banks and driving a flight to quality assets.
Limited Grid Capacity Delaying Highly Automated Facility Commissioning
High-throughput sheds need 5-10 MW, yet connection queues extend 36-48 months around London, the Midlands, and Manchester. Competing data-center and EV-charger demand absorbs 70-80% of regional headroom, so developers reroute to secondary locations or downgrade automation blueprints. On-site solar plus batteries now cover 30-40% of peak load, shaving grid draw but costing USD 51-76 per square foot upfront. Projects pre-wired for future battery swaps obtain quicker sign-offs, becoming a differentiator in the United Kingdom e-commerce warehouse market. Network operators pledge upgrades, yet lead times of four to six years keep the bottleneck in play through 2030.
*Our forecasts treat driver/restraint impacts as directional, not additive. The impact forecasts reflect baseline growth, mix effects, and variable interactions.
Segment Analysis
By Warehouse Type: Port-Centric Micro-Fulfillment Rises
Fulfilment Centers captured 41.28% of the United Kingdom e-commerce warehouse market share in 2025 because they handle 10,000-50,000 SKUs for nationwide delivery. Micro-Fulfillment formats scale at 10.1% CAGR as retailers accept 40-60% higher urban rents to promise two-hour drop windows. These 15,000-25,000 sq ft nodes host 1 robot per 600 sq ft, amplifying kilowatt density. Distribution Centers sustain demand as regional hubs feeding urban spokes nightly. Cold-Chain Warehouses enjoy 25-35% rent premiums, driven by pharma compliance and chilled grocery growth, adding resilience to the United Kingdom e-commerce warehouse market.
The “Others” bracket, which holds bonded, reverse-logistics, and cross-dock hybrids, monetizes specialized functions such as duty suspension and recommerce; premium fees offset complexity. Retail asset conversions save 50-60% of capex against greenfield, yet curb lorry access and ramp hours. Developers juggle these tradeoffs, but the inexorable need to cut last-mile emissions favors inner-city dark stores, deepening their penetration of the United Kingdom e-commerce warehouse market[4]“Good Distribution Practice,” Medicines and Healthcare products Regulatory Agency, gov.uk.


By Service Type: Returns-Driven Value-Added Services Expand
Storage still anchors 52.97% of the United Kingdom e-commerce warehouse market size, but the value-added services slice rises fastest at 9.57% CAGR through 2031. Returns inspection, refurbishment, kitting, and personalization command USD 2.50-6.30 per unit, quadruple base storage revenue. Picking and packing complexity escalates as average basket lines climb, necessitating multi-zone sortation and light assembly stations.
Operators carve 15-20% of footprints into value-add cells outfitted with quality labs and branded packaging lanes. Subscription box fulfillment, which demands curated assortments and seasonal themes, reinforces this shift. Advanced WMS dashboards track service-time stamps, producing SLA evidence that underpins fee integrity across the United Kingdom e-commerce warehouse market.
By Automation Level: Semi-Automated Format Holds the Middle Ground
Semi-Automated warehouses accounted for 45.81% of the United Kingdom e-commerce warehouse market share in 2025, delivering 40-60% of fully automated throughput at one-third of the capex. Manual operations persist for oversize SKUs yet suffer wage pressures and retention headaches. Automated sites grow 9.18% CAGR, but queue for grid slots that stall go-live dates.
RaaS bridges the gap, letting users pay per robot hour and flex fleets during Black Friday peaks. Retrofits cost USD 38-63 per square foot for flooring, power, and data, steering many investors to newbuilds pre-specified for 24/7 robot duty. The United Kingdom e-commerce warehouse market, therefore, polarizes into legacy manual stock and next-generation automated hubs with scant middle ground.
By End-User Industry: Pharma Leads Cold-Chain Upswing
Grocery and FMCG led with 24.02% share of the United Kingdom e-commerce warehouse market in 2025 on volume intensity, yet pharmaceuticals, beauty, and wellness will post a 9.68% CAGR to 2031. Prescription e-pharmacy and cosmetic cold-chain needs lift demand for 15-25 °C controlled rooms and GDP-compliant traceability.
Apparel volumes remain high but volatile, with return ratios above 30% prompting specialized recommerce facilities. Electronics fulfillment adds anti-static and secure cage requirements, inflating fit-out cost 40-60%. Furniture logistics prize clear internal heights and heavy-duty floors, favoring edge-of-conurbation mega-boxes. Diversifying sector mixes buffers utilization risk across the United Kingdom e-commerce warehouse market.
Geography Analysis
England retained 44.14% share of the United Kingdom e-commerce warehouse market in 2025, anchored by London, the Midlands, and Manchester conurbations. Vacancy rates dip below 3% on planning delays that stretch 18-24 months. DHL’s USD 291 million Coventry hub illustrates ongoing mega-shed appetite, yet grid congestion forces some projects to peripheral zones, extending road miles and carbon loads.
Scotland is projected to record an 8.71% CAGR, the quickest within the United Kingdom e-commerce warehouse market, as Forth and Inverness freeports confer duty suspension until 2034 and industrial land costs sit 30-40% under English peers. Offshore wind supply chains demand 50-ton craneways, spawning outsized sheds near deep-water quays. Business-rates stability relative to England further sweetens the case.
Wales deploys a USD 1.27 billion investment-zone plan that targets 5.5 million sq ft of new logistics stock around Wrexham Industrial Estate, bolstered by automotive and life-science in-shoring. Northern Ireland leverages dual-market access under protocol rules, letting a single DC serve both United States and EU e-commerce, shaving 10-15% off cross-border inventory costs. Collectively, devolved nations chip away at England’s dominance, adding geographic resilience to the United Kingdom e-commerce warehouse market.
Competitive Landscape
DSV closed a USD 15.1 billion acquisition of DB Schenker in 2025, creating a 12 million sq ft domestic footprint and lifting the top-five share above 60% within the United Kingdom e-commerce warehouse market. GXO absorbed Wincanton in 2026, unlocking USD 57 million annual synergy potential and cementing its lead in contract logistics. Retailers such as Tesco and Sainsbury’s in-source fulfillment, trimming 3PL wallet share yet deepening automation partnerships with RaaS vendors.
Technology emerges as the battleground. Operators publicize 99.8% pick accuracy and 30-minute cut-off extensions, making laggards vulnerable. Cyber resilience shifts from optional to mandatory after ransomware claims spike 120-150%. Policies now demand multi-factor authentication, network segmentation, and 24-hour SOC support, adding USD 63,000-190,000 annual overhead.
Urban hub developers convert high-street shells into 15,000-25,000 sq ft micro-fulfillment nodes at half greenfield cost, securing leases from fashion brands chasing same-day delivery. Freeport-specialist 3PLs advertise 8-12% landed-cost savings for EU-bound parcels, highlighting regulatory arbitrage as a strategic niche. Consolidation continues as capital gravitates toward scale platforms with ESG credentials, reinforcing a barbell structure within the United Kingdom e-commerce warehouse market.
United Kingdom E-Commerce Warehouse Industry Leaders
GXO Logistics
Kuehne+Nagel
DSV A/S
DHL Group
CMA CGM Group (including CEVA Logistics)
- *Disclaimer: Major Players sorted in no particular order

Recent Industry Developments
- March 2026: GXO Logistics gained regulatory clearance for its Wincanton takeover, integrating 15 million sq ft and targeting USD 57 million cost synergies.
- March 2026: DPD inaugurated automated depots in Crawley and Sittingbourne, each processing 80,000 parcels daily under a USD 418 million expansion plan.
- March 2026: Kuehne+Nagel opened a 3,600 sq m temperature-controlled parts warehouse at East Midlands Gateway for Changan United Kingdom.
- February 2026: GXO extended a six-year warehousing contract with BAE Systems across Glasgow shipyards.


United Kingdom E-Commerce Warehouse Market Report Scope
| Fulfilment Centers |
| Distribution Centers (DCs) |
| Cold-Chain Warehouses |
| Dark Stores / Micro-Fulfillment Centers |
| Others (Reverse Logistics Hubs, Bonded Warehouses, Hybrid-use Spaces, etc.) |
| Storage |
| Picking and Packing |
| Value-Added Services and Others (Kitting, Labelling) |
| Manual |
| Semi-Automated |
| Automated |
| Apparel and Footwear |
| Consumer Electronics |
| Grocery and FMCG |
| Pharmaceuticals, Beauty and Wellness |
| Home Essentials and Furnishings |
| Others |
| England |
| Scotland |
| Wales |
| Northern Ireland |
| By Warehouse Type | Fulfilment Centers |
| Distribution Centers (DCs) | |
| Cold-Chain Warehouses | |
| Dark Stores / Micro-Fulfillment Centers | |
| Others (Reverse Logistics Hubs, Bonded Warehouses, Hybrid-use Spaces, etc.) | |
| By Service Type | Storage |
| Picking and Packing | |
| Value-Added Services and Others (Kitting, Labelling) | |
| By Automation Level | Manual |
| Semi-Automated | |
| Automated | |
| By End-User Industry | Apparel and Footwear |
| Consumer Electronics | |
| Grocery and FMCG | |
| Pharmaceuticals, Beauty and Wellness | |
| Home Essentials and Furnishings | |
| Others | |
| By Region | England |
| Scotland | |
| Wales | |
| Northern Ireland |


Key Questions Answered in the Report
What is the forecast value of the United Kingdom e-commerce warehouse market in 2031?
The market is projected to reach USD 1.77 billion by 2031, reflecting a 4.87% CAGR from 2026.
Which warehouse format is growing fastest in the United Kingdom?
Dark Stores and Micro-Fulfillment Centers are expanding at a 10.1% CAGR because urban proximity shortens delivery windows.
Why are value-added services critical for U.K. warehouse operators?
Rising omnichannel returns and personalization demand push operators to add inspection, kitting, and refurbishment zones that earn higher fees and speed resale.
What is the main barrier to full automation uptake?
Limited grid capacity causes 36-48 month connection delays for 5-10 MW loads, forcing operators to adopt semi-automated or hybrid solutions.
Which region shows the highest growth potential?
Scotland will post an 8.71% CAGR thanks to freeport tax incentives, lower land costs, and renewable-energy logistics demand.
How does RaaS reshape automation economics?
Robotics-as-a-Service removes 60-70% of upfront capex and lets operators flex fleets seasonally while achieving 100-150% throughput gains.
Page last updated on:


