Asia-Pacific E-commerce Warehouse Market Size and Share
Market Overview
| Study Period | 2020 - 2031 |
|---|---|
| Forecast Data Period | 2026 - 2031 |
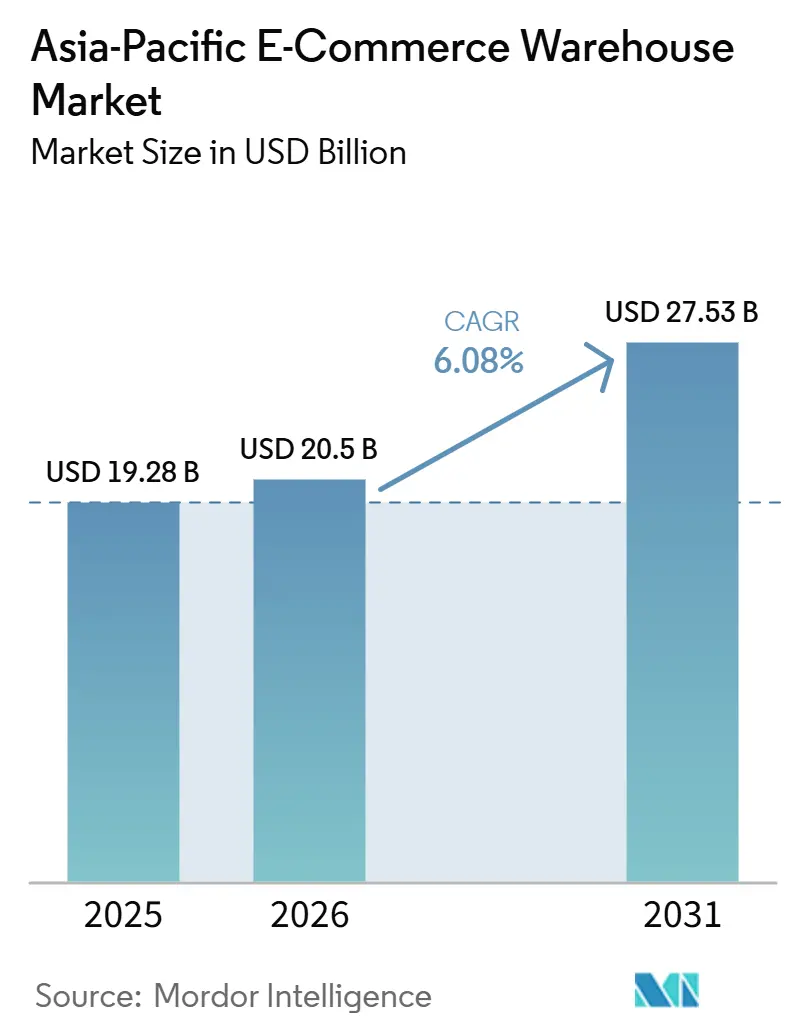
| Base Year Market Size (2025) | USD 19.28 Billion |
| Market Size (2026) | USD 20.5 Billion |
| Market Size (2031) | USD 27.53 Billion |
| Growth Rate (2026 - 2031) | 6.08% CAGR |
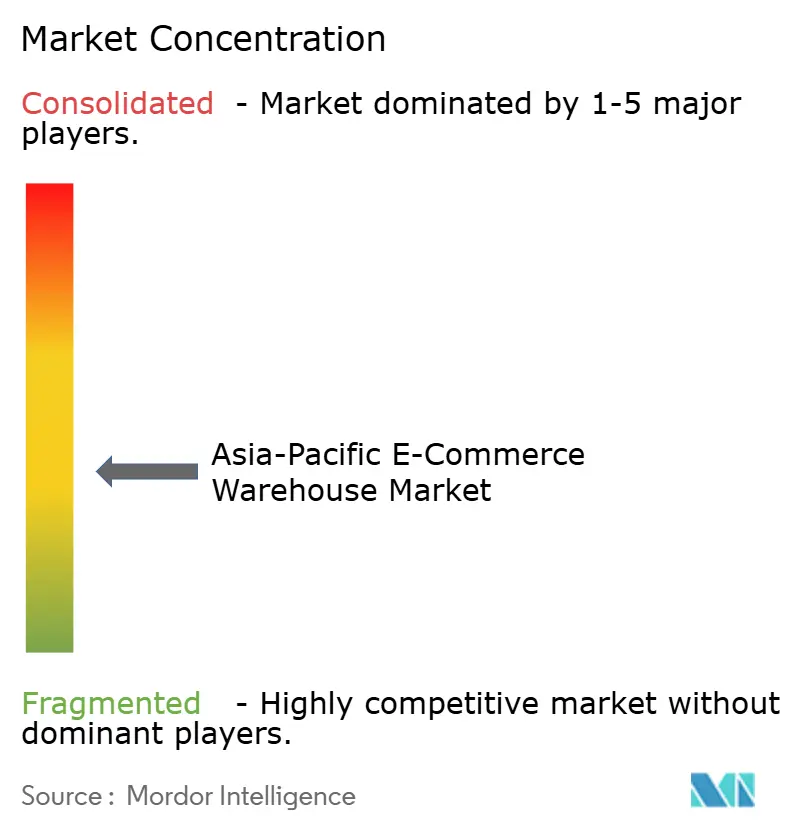
| Market Concentration | Medium |
Major Players *Disclaimer: Major Players sorted in no particular order Image © Mordor Intelligence. Reuse requires attribution under CC BY 4.0. | |
Asia-Pacific E-commerce Warehouse Market Analysis by Mordor Intelligence
The Asia-Pacific e-commerce warehousing market size is expected to grow from USD 19.28 billion in 2025 to USD 20.50 billion in 2026, and is forecast to reach USD 27.53 billion by 2031, growing at a 6.08% CAGR over 2026-2031.
Continued migration from self-run logistics to outsourced 3PL campuses is the principal structural shift, with specialized providers capturing 65% of new leasing in the Asia-Pacific e-commerce warehousing market during 2025. Government automation subsidies have compressed robot payback periods to 2-3 years, stimulating double-digit growth in automated systems and expanding the addressable base for high-throughput fulfillment hubs. Regional free-trade zones and the ASEAN Customs Transit System are shortening cross-border clearance cycles by 30-50%, steering inventory toward bonded mega-sheds that serve several countries from one node. Meanwhile, rooftop solar plus battery retrofits are trimming operating expenses by 20-35% in climate-exposed power markets, allowing operators to monetize sustainability as a competitive differentiator.
Key Report Takeaways
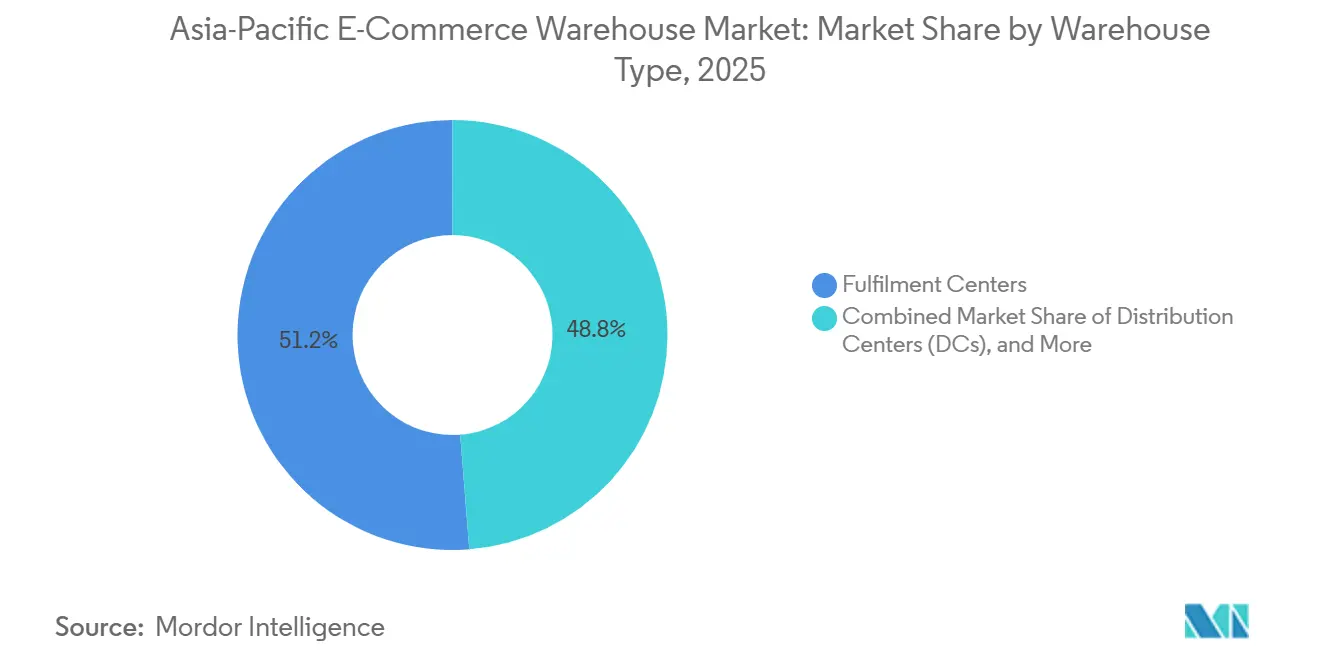
- By warehouse type, fulfillment centers held 51.25% of the Asia-Pacific e-commerce warehousing market share in 2025, while dark stores and micro-fulfillment sites are projected to expand at an 11.74% CAGR through 2031.
- By service type, storage accounted for 47.47% of the Asia-Pacific e-commerce warehousing market size in 2025, whereas picking and packing is advancing at an 11.21% CAGR to 2031.
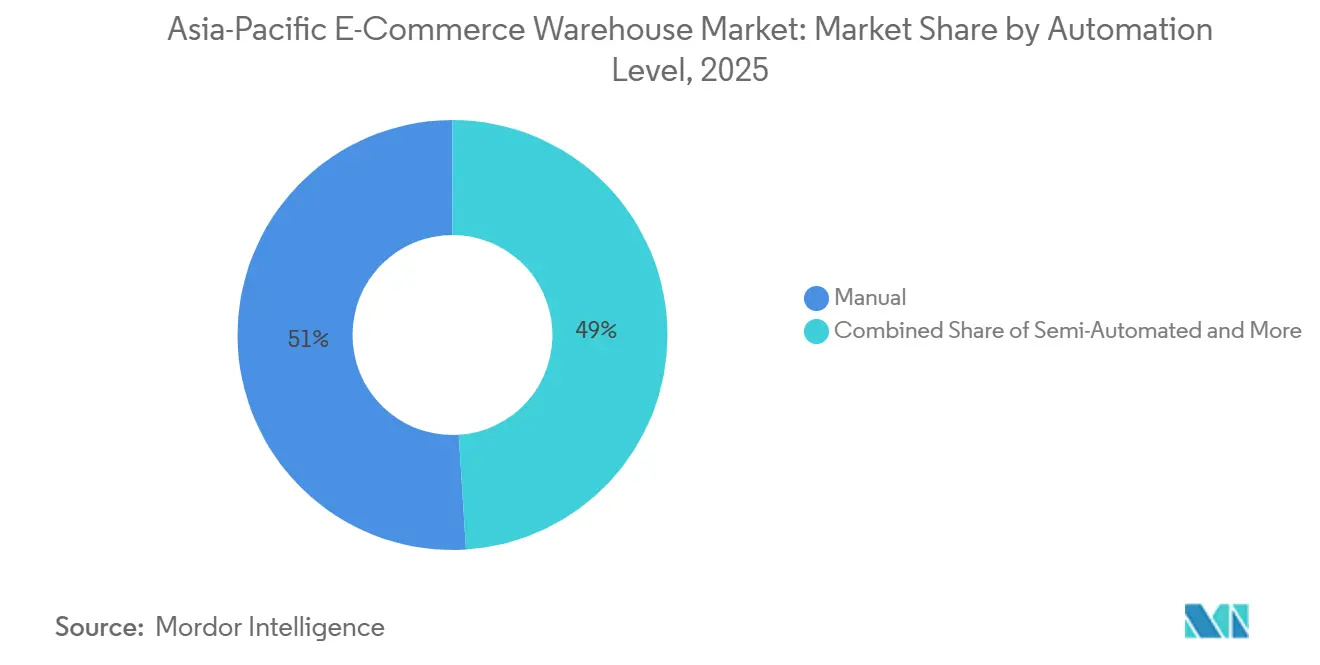
- By automation level, manual operations retained 51% share of the Asia-Pacific e-commerce warehousing market in 2025, yet automated systems are set to post a 10.82% CAGR through 2031.
- By end-user segment, apparel and footwear led with 25.63% of the Asia-Pacific e-commerce warehousing market size in 2025; grocery and FMCG are forecast to grow at an 11.32% CAGR through 2031.
- By country, China commanded 41.44% of the Asia-Pacific e-commerce warehousing market share in 2025, while India is the fastest-growing country at a 9.29% CAGR to 2031.
Note: Market size and forecast figures in this report are generated using Mordor Intelligence’s proprietary estimation framework, updated with the latest available data and insights as of January 2026.
Asia-Pacific E-commerce Warehouse Market Trends and Insights
Drivers Impact Analysis*
| Driver | (~) % Impact on CAGR Forecast | Geographic Relevance | Impact Timeline |
|---|---|---|---|
| D2C brand wave outsourcing fulfillment to 3PL campuses | +1.3% | Global, with concentration in China, India, Southeast Asia | Short term (≤ 2 years) |
| Government automation-subsidy programs accelerating robot uptake | +1.1% | Singapore, Japan, South Korea, with emerging adoption in India | Medium term (2-4 years) |
| Regional free-trade zones streamlining cross-border e-commerce flows | +0.9% | RCEP member nations, ASEAN core markets | Long term (≥ 4 years) |
| ASEAN Customs Transit System enabling bonded trans-shipment hubs | +0.7% | Southeast Asia, India, with China-origin flows | Medium term (2-4 years) |
| Rooftop solar + battery retrofits cutting warehouse opex | +0.8% | Australia, Japan, India, with pilot projects in Southeast Asia | Long term (≥ 4 years) |
| Meal-kit and fresh-subscription boom driving multi-temperature facilities | +1.0% | Urban centers across China, Japan, Korea, Singapore, Australia | Short term (≤ 2 years) |
| Source: Mordor Intelligence | |||
D2C Brand Wave Outsourcing Fulfillment to 3PL Campuses
Direct-to-consumer labels are abandoning owned warehouses in favor of variable-cost 3PL campuses, lifting the Asia-Pacific e-commerce warehousing market as multi-client hubs proliferate. Third-party providers signed two-thirds of all new logistics space in 2025 because shared robotics and labor pools drop per-order costs 25-30% for mid-size brands. The 3PL portion of regional logistics revenue grew at 18% CAGR in 2025, and operators such as GXO and CEVA now run campuses that host 8-15 brands under one roof to maximize automation utilization. DHL added 12 similar sites across Southeast Asia in 2025, each engineered for SKU segregation and data-rich SLAs. Increased density raises complexity, so campuses rely on advanced warehouse management systems that segregate inventory and certify data security compliance[1]“Renewable Energy in Warehouses,” International Renewable Energy Agency, IRENA.ORG.
Government Automation-Subsidy Programs Accelerating Robot Uptake
Fiscal incentives are shortening robot ROI cycles across the Asia-Pacific e-commerce warehousing market. Singapore reimburses up to 50% of automation capex, disbursing SGD 180 million (USD 133 million) in 2025. Japan and South Korea unveiled similar grants totaling USD 1 billion that cut payback to 2-3 years for goods-to-person systems. India’s 2025 policy offers a 25% subsidy for Grade A sites, though complex paperwork slowed utilization to one-third of allocated funds. Subsidies pulled 2026-2027 installations forward, pushing regional AMR deployments to 47,000 units in 2025, 62% higher than 2024[2]“Automation Support Package,” Enterprise Singapore, ENTERPRISESG.GOV.SG.
Regional Free-Trade Zones Streamlining Cross-Border E-Commerce Flows
Implementation of the Regional Comprehensive Economic Partnership eliminates 90% of tariffs across 15 economies, slicing clearance times by up to 40% for bonded shipments and reinforcing the centrality of free-trade-zone (FTZ) warehouses. China’s 21 FTZs processed USD 580 billion of trade in 2025, while Singapore’s FTZs managed 42 million tonnes of cargo, with e-commerce parcels the fastest-growing category. Lazada and Shopee chose Vietnam’s Haiphong and Ho Chi Minh City FTZs for Southeast Asia cross-docking, responding to 35% capacity growth in 2025. Documentation errors still delay 23% of cross-border parcels, highlighting the need for harmonized origin rules and digital customs pipelines.
ASEAN Customs Transit System Enabling Bonded Trans-Shipment Hubs
Fully launched in 2025, ACTS lets sealed trucks travel across borders without repeated inspections, reducing transit times by up to 50%. Malaysia’s Port Klang welcomed a 120,000 m² JD Logistics hub that now reaches six ASEAN capitals in 48 hours. Cainiao expanded to 23 ASEAN bonded warehouses totaling 850,000 m², processing 12 million parcels monthly. Benefits are uneven: Laos and Myanmar see limited uptake because of infrastructure gaps, underscoring ACTS' dependence on road quality and customs digitization.
Restraints Impact Analysis*
| Restraint | (~) % Impact on CAGR Forecast | Geographic Relevance | Impact Timeline |
|---|---|---|---|
| Data-localization and cybersecurity mandates inflating WMS costs | -0.9% | China, India, Indonesia, Vietnam, with compliance complexity across ASEAN | Medium term (2-4 years) |
| Stricter lithium-battery fire-safety codes raising build-out capex | -0.7% | Global, with stringent enforcement in Japan, Australia, Singapore | Short term (≤ 2 years) |
| Urban night-time truck-movement curfews compress docking windows | -0.6% | Major metros across China, India, Thailand, Indonesia | Short term (≤ 2 years) |
| Flood-risk insurance premiums spiking for coastal mega-sheds | -0.5% | Coastal zones in China, Thailand, Vietnam, Philippines, Indonesia | Long term (≥ 4 years) |
| Source: Mordor Intelligence | |||
Data-Localization and Cybersecurity Mandates Inflating WMS Costs
Country-level data-sovereignty laws obligate in-country hosting, raising architecture costs 25-40% for multi-market 3PLs and undercutting the cloud-efficiency thesis of the Asia-Pacific e-commerce warehousing market. China’s Data Security Law, India’s Digital Personal Data Protection Act, and Indonesia’s GR 71/2019 force separate instances of warehouse software, driving hybrid models with local data stores and regional analytics. Operators report 30-45% higher maintenance outlays relative to unified platforms, a burden absorbed more easily by large 3PLs than by mid-size incumbents[3]“Data Security Law of the People’s Republic of China,” National People’s Congress of China, NPC.GOV.CN.
Stricter Lithium-Battery Fire-Safety Codes Raising Build-Out Capex
Warehouse fires involving batteries prompted new code revisions that add 15-20% to e-commerce warehouse construction where consumer electronics volumes are high. Japan demands dedicated suppression systems and segregation walls; retrofits now average USD 1.2 million per site. Singapore enforces three-meter spacing that lowers rack density up to 18%, forcing footprint expansion or multi-level storage at premium rents[4]“NCC 2025 Lithium Battery Storage,” Australian Building Codes Board, ABCB.GOV.AU.
*Our forecasts treat driver/restraint impacts as directional, not additive. The impact forecasts reflect baseline growth, mix effects, and variable interactions.
Segment Analysis
By Warehouse Type: 3PL Campuses Reshape Fulfillment
Fulfillment centers led with 51.25% of the Asia-Pacific e-commerce warehousing market share in 2025, yet dark stores and micro-fulfillment nodes are growing 11.74% CAGR as retailers chase sub-two-hour city deliveries. GXO’s multi-tenant campus model yields 25-30% cost savings thanks to shared robots and cross-docking, signaling continued momentum away from single-brand sheds. Cold-chain capacity is rising fastest inside this segment, propelled by meal-kit operators and temperature-sensitive pharma. Bonded warehouses classified in “others” are enlarging to manage cross-border returns and duty-deferral advantages, processing 2.4 billion parcels in China alone.
Distribution centers still anchor bulk import staging, yet brands juggling multiple facility archetypes struggle with visibility; 42% cite inventory blind spots across formats, nudging demand for unified control-tower software. The Asia-Pacific e-commerce warehousing industry, therefore, shows both consolidation at campus scale and fragmentation at last-mile micro-node scale.


By Service Type: Integrated Solutions Command Premium
Storage controlled 47.47% of the Asia-Pacific e-commerce warehousing market size in 2025, but picking and packing is expanding at 11.21% CAGR through 2031 as brands seek turnkey partners. Automated goods-to-person systems now deliver 99.7% accuracy, superior to 97.5% for manual workflows, strengthening the outsourcing case. DSV captured 34% of new e-commerce contracts in 2025 with single-invoice packages that span storage, fulfillment, and last-mile.
Value-added kitting, labeling, and plastic-free packaging drive higher labor complexity and 15-20% higher operating costs but also command pricing premiums. Sustainability-aligned services such as carbon-neutral shipping have moved from niche to mainstream, requested by 67% of brands in 2025. Competitive edge now lies in software that orchestrates multi-tier services without eroding margin, a priority echoed by Kerry Logistics’ Fulfillment Plus program that grew revenue 28% last year.
By Automation Level: Subsidies Accelerate Robot Adoption
Manual processes still held 51% market share in 2025, but automated systems are projected to post a 10.82% CAGR, steadily enlarging the Asia-Pacific e-commerce warehousing market. AMRs led installations at 47,000 units, and goods-to-person lines tripled productivity compared with legacy pick-to-cart workflows. Singapore subsidized 127 projects, averaging USD 1.04 million per grant, validating fiscal stimulus as a flip-switch for adoption.
China’s domestic robot suppliers now hold 68% market share, bringing capex thresholds down and compressing global price points. Even so, 73% of facilities under 50,000 m² remain largely manual because smaller 3PLs face integration hurdles and limited access to concessional financing. Semi-automated modes, voice picking plus conveyor assist, will serve as an interim path for cost-sensitive operators.
By End-User Industry: Fresh Food Drives Cold-Chain Investment
Apparel and footwear led with 25.63% of the Asia-Pacific e-commerce warehousing market share, yet grocery and FMCG are forecast to overtake with 11.32% CAGR, anchored by 12.4 million active meal-kit subscribers. Automated garment-on-hanger lines and robotic polybagging lift throughput for fashion SKUs, but require sizable upfront investment.
Consumer electronics fulfillment adds cost layers for ESD protection and lithium safety, which dovetail with the fire-code challenges noted earlier. Pharma e-commerce needs GDP-grade traceability and cold rooms, adding up to USD 120 per m² to fit-out costs. Beauty products add parallel humidity controls. Grocery remains the most operation-intensive, with perishable cycle times pushing labor peaks and driving innovations such as micro-fogging to extend shelf life.
Geography Analysis
China commands 41.44% of the Asia-Pacific E-commerce Warehouse Market share, and the warehouse rents averaged RMB 1.2-1.8 (USD 0.17-0.26) per m² per day in 2025, with smart facilities commanding 30% premiums, sustaining the Asia-Pacific e-commerce warehousing market size despite macro cooling. Government encouragement of inland cities and automation grants keeps developers active, though data-localization burdens and flood-insurance spikes in coastal hubs bite into net yields.
India paces at 9.29% CAGR and benefits from abundant land and policy pushes. JNPA’s 4.45 million ft² campus is now the nation’s largest single-site e-commerce warehouse, acting as a maritime gateway for FTZ inventory rolls. Rents in top markets hover at INR 25-35 (USD 0.27-0.38) per ft² per month, yet automated Grade A boxes approach INR 50 (USD 0.54), signaling widening quality dispersion.
Southeast Asia functions as the new cross-border fulcrum. Indonesia added 3.8 million m² of modern stock with Jakarta absorbing 62% of 2025 demand. Vietnam logged 1.2 million m² of logistics take-up, fueled by electronics exports and e-commerce parcel imports. Thailand’s USD 2.3 billion Eastern Economic Corridor build-out attracted 18 new e-commerce-ready sheds. Singapore’s Tuas Port phase 1 added 650,000 m² of integrated space and built out the city-state’s hub role despite land scarcity.
Competitive Landscape
The Asia-Pacific e-commerce warehousing market remains moderately fragmented. Global integrators such as DHL, DSV, and Kuehne+Nagel lean on end-to-end offerings, while regional leaders JD Logistics, Cainiao, and CJ Logistics exploit domestic scale and ecosystem data. Automation is the key moat: leaders running AMRs and AI planning engines post 25-35% cost improvements over manual rivals, letting them price aggressively without eroding margins.
Sustainability is the next battleground; ESR’s portfolio-wide solar retrofits shaved average opex 22%, earning green lease premiums from ESG-minded retailers. Pharmaceutical-grade cold-chain and bonded cross-border warehousing are high-margin niches attracting capital from Lineage Logistics and Kuehne+Nagel’s new 42,000 m² Ho Chi Minh City site. Emerging disruptors such as Locad and Ninja Van promote warehouse-as-a-service models that rent flexible pallet spaces monthly, suiting SMEs.
Regulatory compliance costs, data hosting, lithium safety, and environmental permitting favor large balance sheets; hence, M&A persists. GEODIS closed its Keppel Logistics buy in 2024, adding 200,000 m² across Singapore, Malaysia, and Australia and catapulting into the top-ten regional roster. Expect further consolidation as players pursue scale for technology amortization and multi-country compliance.
Asia-Pacific E-commerce Warehouse Industry Leaders
DHL Group
CMA CGM Group (including CEVA Logistics)
GXO Logistics
Nippon Express Holdings
SF Express (KEX-SF)
- *Disclaimer: Major Players sorted in no particular order

Recent Industry Developments
- September 2025: Kuehne+Nagel opened a 42,000 m² bonded and temperature-controlled hub in Ho Chi Minh City to cater to cross-border e-commerce flows.
- July 2025: Cainiao Network upgraded its Asia-Pacific warehousing grid to more than 20 sites across 10 markets, elevating same-day outbound accuracy to 99.9%.
- April 2025: Aramex signed a Master Services Agreement with Shipsy to infuse AI route orchestration into same-day delivery across Asia-Pacific.
- January 2025: Lineage Logistics acquired a 250,000 m³ Australian cold-storage portfolio for USD 185 million, reinforcing its fresh-food and pharma fulfillment.


Asia-Pacific E-commerce Warehouse Market Report Scope
| Fulfilment Centers |
| Distribution Centers (DCs) |
| Cold-Chain Warehouses |
| Dark Stores / Micro-Fulfillment Centers |
| Others (Reverse Logistics Hubs, Bonded Warehouses, Hybrid-use Spaces, etc.) |
| Storage |
| Picking and Packing |
| Value-Added Services and Others (Kitting, Labelling) |
| Manual |
| Semi-Automated |
| Automated |
| Apparel and Footwear |
| Consumer Electronics |
| Grocery and FMCG |
| Pharmaceuticals, Beauty and Wellness |
| Home Essentials and Furnishings |
| Others |
| China |
| India |
| Japan |
| South Korea |
| Indonesia |
| Thailand |
| Vietnam |
| Australia |
| Singapore |
| Rest of Asia-Pacific |
| By Warehouse Type | Fulfilment Centers |
| Distribution Centers (DCs) | |
| Cold-Chain Warehouses | |
| Dark Stores / Micro-Fulfillment Centers | |
| Others (Reverse Logistics Hubs, Bonded Warehouses, Hybrid-use Spaces, etc.) | |
| By Service Type | Storage |
| Picking and Packing | |
| Value-Added Services and Others (Kitting, Labelling) | |
| By Automation Level | Manual |
| Semi-Automated | |
| Automated | |
| By End-User Industry | Apparel and Footwear |
| Consumer Electronics | |
| Grocery and FMCG | |
| Pharmaceuticals, Beauty and Wellness | |
| Home Essentials and Furnishings | |
| Others | |
| By Country | China |
| India | |
| Japan | |
| South Korea | |
| Indonesia | |
| Thailand | |
| Vietnam | |
| Australia | |
| Singapore | |
| Rest of Asia-Pacific |


Key Questions Answered in the Report
What is the forecast value of the Asia-Pacific e-commerce warehousing sector by 2031?
It is projected to reach USD 27.53 billion by 2031, expanding at a 6.08% CAGR from 2026 to 2031.
Which warehouse format is growing fastest across the region?
Dark stores and micro-fulfillment centers are advancing at an 11.74% CAGR as retailers pursue rapid urban deliveries.
How are government incentives influencing warehouse automation?
Subsidies in Singapore, Japan, and South Korea cut robot payback periods to 2-3 years, accelerating AMR and goods-to-person deployments.
Why is India considered the fastest-growing geography?
National Logistics Policy targets lower logistics costs, Grade A stock expansion, and ACTS-enabled cross-border flows, driving a 9.29% CAGR through 2031.
What operational risks are heightening cost pressures for coastal warehouses?
Higher flood-risk insurance premiums, tighter lithium-battery fire codes, and night-time truck curfews collectively lift capex and opex for coastal mega-sheds.
Which value-added service is most in demand from e-commerce brands?
Integrated picking, packing, and sustainability-aligned packaging that provide single-vendor accountability are increasingly requested by two-thirds of brands.
Page last updated on:


