South Korea E-Commerce Warehouse Market Size and Share
Market Overview
| Study Period | 2020 - 2031 |
|---|---|
| Forecast Data Period | 2026 - 2031 |
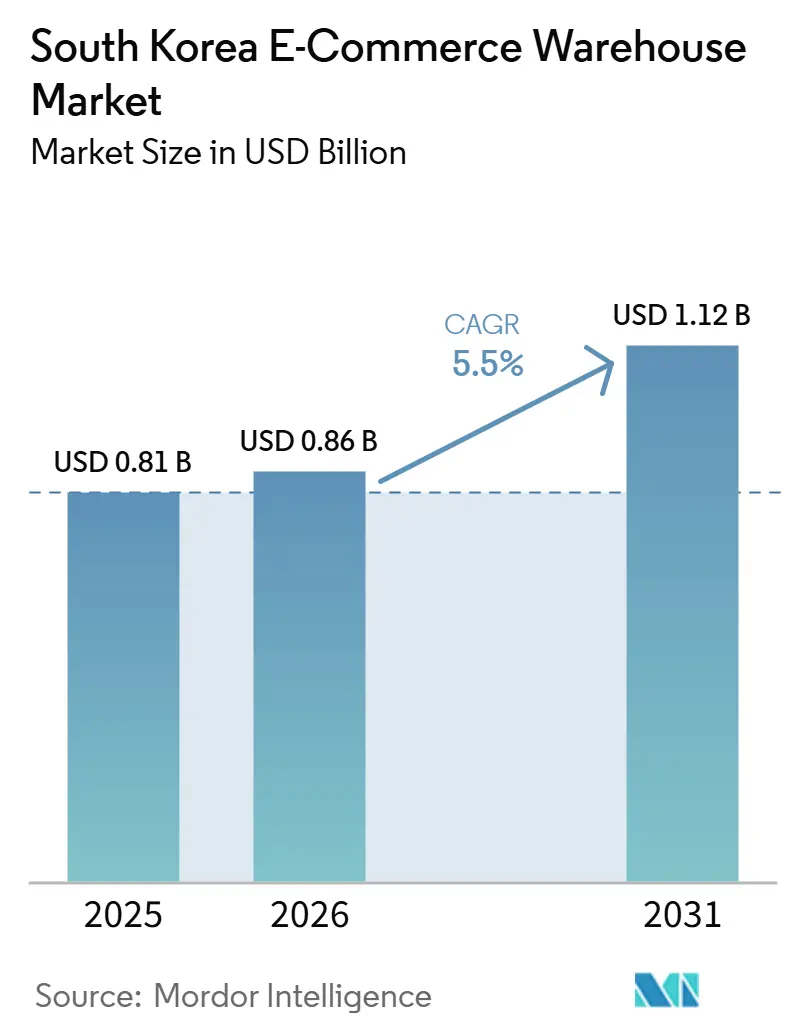
| Base Year Market Size (2025) | USD 0.81 Billion |
| Market Size (2026) | USD 0.86 Billion |
| Market Size (2031) | USD 1.12 Billion |
| Growth Rate (2026 - 2031) | 5.50% CAGR |
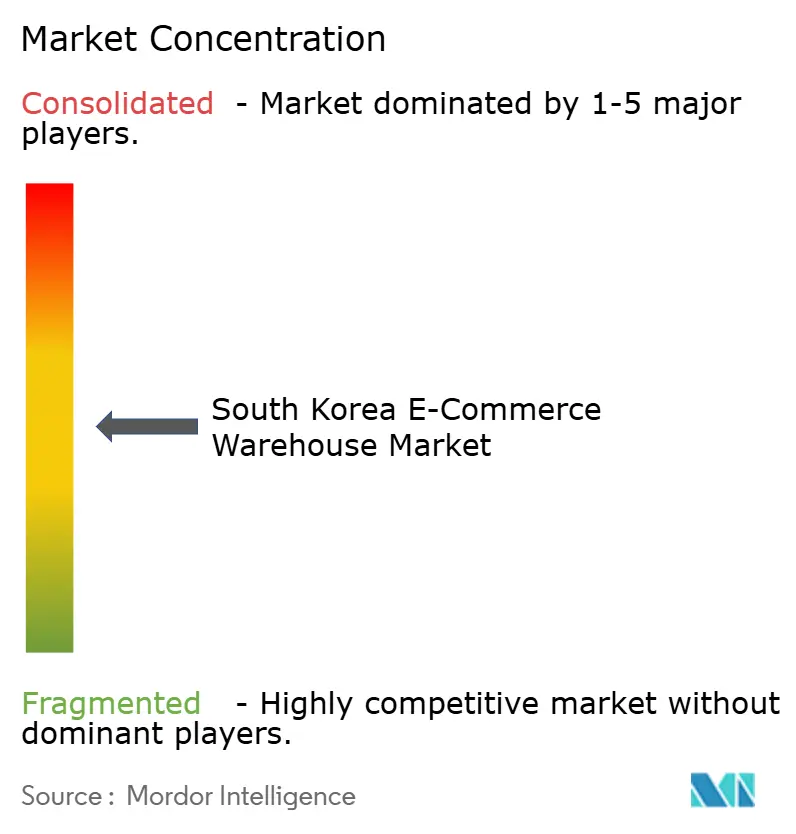
| Market Concentration | Medium |
Major Players *Disclaimer: Major Players sorted in no particular order Image © Mordor Intelligence. Reuse requires attribution under CC BY 4.0. | |
South Korea E-Commerce Warehouse Market Analysis by Mordor Intelligence
The South Korea e-commerce warehouse market size was valued at USD 0.81 billion in 2025 and is estimated to grow from USD 0.86 billion in 2026 to reach USD 1.12 billion by 2031, at a CAGR of 5.50% during the forecast period (2026-2031).
Rising cross-border demand for Korean beauty and lifestyle products, the instant-delivery race inside major cities, and government subsidies for smart, green facility retrofits are the three forces reshaping both facility formats and investment flows in the South Korea e-commerce warehouse market. Operators are moving from single-story suburban boxes to multi-level urban nodes, bonded export hubs, and ultra-cold pharmaceutical modules that can hold inventory at –70 °C. Growth is also tied to the spread of direct-to-consumer (D2C) brands that favor flexible, multi-client warehouses over single-tenant contracts, while real-estate investment trusts (REITs) are converting idle factories into logistics assets that can be leased on short cycles. Finally, automation is no longer a cost-saving option but a labor-risk hedge as Korea’s working-age population contracts and wage inflation continues
Key Report Takeaways
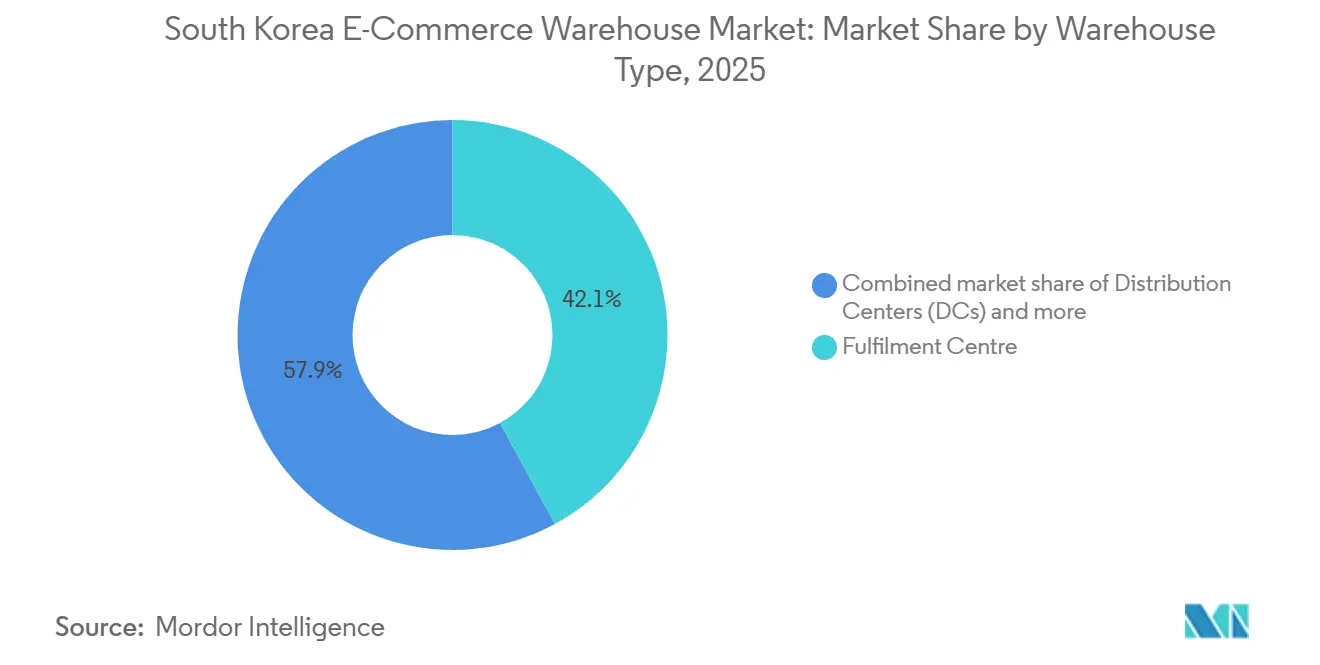
- By warehouse type, fulfillment centers led with 42.1% of the South Korea e-commerce warehouse market share in 2025, while dark stores and micro-fulfillment centers are projected to advance at a 10.95% CAGR through 2031.
- By service type, storage accounted for 53.73% share of the South Korea e-commerce warehouse market size in 2025, and value-added services are forecast to expand at a 10.42% CAGR to 2031.
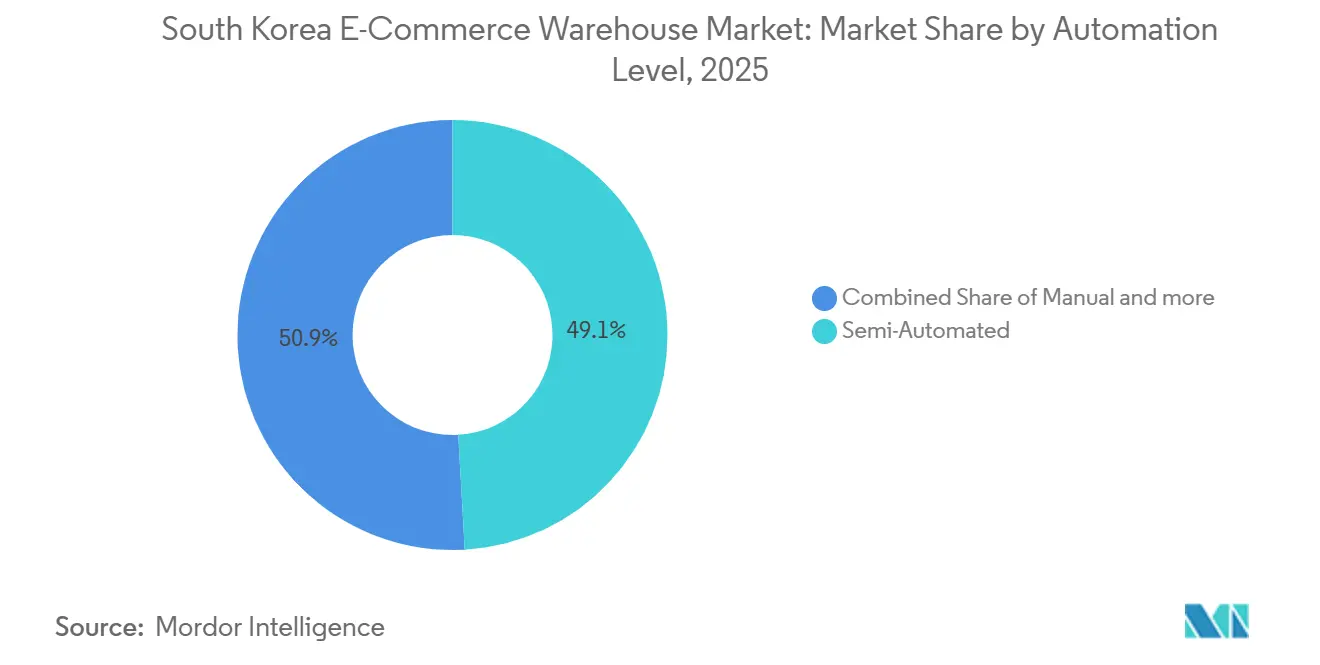
- By automation level, semi-automated sites held 49.09% share of the South Korea e-commerce warehouse market size in 2025, whereas fully automated facilities are expected to grow at a 10.03% CAGR between 2026-2031.
- By end-user, apparel and footwear captured 32.46% revenue share in 2025; grocery and fast-moving consumer goods (FMCG) is set to log the fastest 10.53% CAGR through 2031.
- By geography, the Seoul Capital Area commanded 53.23% of the South Korea e-commerce warehouse market share in 2025, while Chungcheong is positioned to grow at the highest 6.36% CAGR during the forecast window.
Note: Market size and forecast figures in this report are generated using Mordor Intelligence’s proprietary estimation framework, updated with the latest available data and insights as of January 2026.
South Korea E-Commerce Warehouse Market Trends and Insights
Drivers Impact Analysis*
| Drivers | (~) Impact on CAGR Forecast | Geographic Relevance | Impact Timeline |
|---|---|---|---|
| Cross-border export boom in K-Beauty and K-Lifestyle | +1.4% | Seoul Capital Area, Gyeongsang ports | Medium term (2-4 years) |
| Instant-delivery race and dense micro-fulfillment roll-out | +1.2% | Major metropolitan cores | Short term (≤ 2 years) |
| D2C brand proliferation demanding flexible multi-client sites | +0.9% | Nationwide, Seoul hub | Medium term (2-4 years) |
| “Digital Logistics Roadmap 2030” subsidies for smart & green retrofits | +0.7% | Chungcheong, Gyeongsang | Long term (≥ 4 years) |
| REIT-led conversion of idle factories into vertical nodes | +0.6% | Seoul fringe, Gyeonggi | Medium term (2-4 years) |
| Ultra-cold bio-pharma trials needing –70 °C modules | +0.5% | Songdo, Chungcheong clusters | Long term (≥ 4 years) |
| Source: Mordor Intelligence | |||
Cross-Border Export Boom Lifting Bonded-Hub Demand
Korean cosmetics exports reached a record USD 10.2 billion in 2024, up over 20% year-over-year, making bonded warehouses around Incheon Airport and Busan Port indispensable for duty-free consolidation and rapid loading to air and ocean lanes. Platforms such as Tmall Global and Shopee now ask for two-day delivery into China and Southeast Asia, which can only be met if inventory sits inside compliant export hubs. To support this sustained export boom, South Korea continues to actively expand and optimize its logistics and bonded infrastructure. Real-time visibility tools, multi-language labeling systems, and customs-cleared pick-and-pack workflows have therefore become must-have digital layers for any operator serving export-oriented brands.[1]“K-Beauty Export Statistics 2024,” Korea Customs Service, koreacustoms.go.kr
Instant-Delivery Race Driving Micro-Fulfillment Networks
Quick commerce operators like Baemin (B-Mart) have established networks of micro-fulfillment centers (dark stores) across the Seoul metropolitan area, shrinking the consumer delivery promise to under 60 minutes. These facilities typically cover 500 to 1,500 m² and process thousands of orders daily. Because urban real estate is too expensive and space-constrained for heavy robotics like AutoStore grids, these hubs rely on highly optimized software and manual picking systems (such as Digital Assortment Systems) to achieve click-to-dispatch cycles of around 15 minutes. The economics of quick commerce remain highly challenging; while rent is high in dense neighborhoods, basket sizes tend to be smaller than traditional e-commerce. To survive, operators focus on maximizing order density and operational efficiency. Facility layouts prioritize dense inventory storage and rapid rider staging zones, keeping non-revenue-generating space to a strict minimum.
D2C Brand Proliferation Requiring Flexible Multi-Client Facilities
Between 2022 and 2025, the number of Korean D2C labels surged, doubling to approximately 2,500 brands that overwhelmingly favor flexible, pay-as-you-grow fulfillment agreements over leasing dedicated warehouses. To accommodate this growth, 3PL providers like Fulfillment Korea are operating multi-client facilities that house 15 to 25 distinct brands together, seamlessly managing each label's unique packaging preferences, storefront layouts, and return policies. Handling this level of operational diversity requires a robust warehouse management system (WMS) capable of maintaining strict virtual boundaries between different inventories while simultaneously providing real-time data dashboards to individual clients. Furthermore, these shared facilities have evolved to handle sophisticated reverse logistics, allowing D2C brands to efficiently inspect, repack, and refurbish returned goods on-site for resale, a specialized process that standard marketplace fulfillment centers simply cannot offer.
Government "Digital Logistics Roadmap 2030" Subsidies for Smart & Green Retrofits
South Korea’s Ministry of Land, Infrastructure and Transport (MOLIT) is accelerating the industry shift toward automation and sustainable operations through financial incentives tied to its official Smart Logistics Center Certification. To unlock government backing which helps offset the high capital expenditures of deploying robotics, energy-saving equipment, and electric-vehicle infrastructure facilities must meet rigorous technological and environmental standards. A steadily growing number of warehouses have achieved this certification, yielding significant reductions in energy consumption and substantial labor efficiencies compared to conventional operations. This incentive-based approach, combined with the severe congestion and high real estate costs within the Seoul Capital Area, has increasingly tilted new mega-hub investments toward secondary corridors like Chungcheong, where land is more affordable and greenfield development is easier to secure.[2]“Digital Logistics Roadmap 2030 Overview,” Invest Korea, investkorea.org
Restraints Impact Analysis*
| Restraints | (~) Impact on CAGR Forecast | Geographic Relevance | Impact Timeline |
|---|---|---|---|
| Seoul-metro zoning rules and 15 m height caps | -1.2% | Seoul Capital Area, Gyeonggi | Long term (≥ 4 years) |
| Volatile diesel prices and 2025 toll hikes | -0.9% | Nationwide, urban routes | Short term (≤ 2 years) |
| Shortage of automation engineers | -0.7% | Nationwide, tech hubs | Medium term (2-4 years) |
| Stricter 2025 fire code for high-density AS/RS | -0.5% | National, new builds | Medium term (2-4 years) |
| Source: Mordor Intelligence | |||
Seoul-Metro Zoning and Height Limits
Strict zoning regulations and community opposition have created immense hurdles for warehouse construction in the Seoul Metropolitan Area. Significant portions of Gyeonggi Province fall under Green Belt (Restricted Development Zone) protections, severely limiting land availability. Where development is permitted, intense community pushback over heavy truck traffic and noise has forced local governments to enact strict buffer zones around residential areas and schools, drastically lengthening approval cycles and limiting building scale. This regulatory friction, combined with an oversupply of cold storage and a flight-to-quality for dry goods, has driven developers to maximize existing footprints through massive, multi-level ramp facilities or push new hub investments further out into exurban corridors.
Volatile Diesel Price and Toll Hikes
Volatile diesel prices have put immense pressure on the logistics sector, directly threatening the already thin margins of last-mile delivery operations. In response to fluctuating fuel costs and ongoing adjustments to government fuel tax relief policies, major players like Coupang are actively accelerating the deployment of commercial electric delivery vans to stabilize their operating expenses. However, the transition is bottlenecked by a commercial EV charging grid that remains patchy outside of major metropolitan areas like Seoul. Meanwhile, smaller couriers lacking the capital for large-scale EV fleet upgrades face a difficult choice: absorb the volatile fuel costs, implement unpopular fuel surcharges, or shrink their delivery radii, moves that risk significant customer churn in an ultra-competitive market.
*Our forecasts treat driver/restraint impacts as directional, not additive. The impact forecasts reflect baseline growth, mix effects, and variable interactions.
Segment Analysis
By Warehouse Type: Fulfillment Centers Anchor Volume While Micro-Fulfillment Gains Speed
Fulfillment centers controlled 42.1% of the South Korea e-commerce warehouse market share in 2025, a share grounded in their ability to handle multi-category stock, process next-day pledges, and perform value-added touches such as personalized packaging. These sites typically span 20,000 to 30,000 m² on the city fringe and often embed return-processing cells that cut turnaround to under 24 hours. Despite this scale, dark stores and micro-fulfillment centers are projected to post a 10.95% CAGR to 2031 as ultra-fast delivery reshapes consumer expectations in Seoul and Busan. Micro sites sacrifice unit cost for immediacy, yet automation, such as cube-based storage lifts, increases pick density fourfold, keeping labor ratios within profit targets.
The others category, bonded export, reverse logistics, and cold-chain hybrids keep expanding as cross-border e-commerce reaches approximately USD 6.2 billion in sales. Bonded hubs save exporters two days of cycle time, while –70 °C modules baked into cold-chain sheds unlock life-science contracts that can command triple the storage tariff of groceries. This specialization shows the South Korea e-commerce warehouse market shifting from “bigger is better” toward “fit-for-purpose” nodes optimized for each SKU profile.


By Service Type: Storage Dominates but Value-Added Services Grow Faster
Storage represented 53.73% of the South Korea e-commerce warehouse market size in 2025 because holding inventory is a non-negotiable baseline for any e-retailer. Yet value-added services are forecast to log a 10.42% CAGR through 2031, propelled by brands equating unboxing experience with marketing. Typical add-ons include bundle kitting, multi-language label swaps, or sample insertion, all orchestrated inside the WMS so that a single pick face can host multiple campaign variants without cross-contamination.
The rising complexity increases demand for skilled labor and for semi-automated workstations such as put-walls equipped with vision scanners. Operators that master mid-level customization can charge 15-20% higher per-order fees and lock in customer contracts for three to five years, a stickier revenue stream than plain bulk storage. As a result, the notion of a passive “warehouse” is fading; facilities resemble light-manufacturing plants that push brand equity downstream to the doorstep.
By Automation Level: Semi-Automated Sites Bridge the Transition
Semi-automated buildings held 49.09% of the South Korea e-commerce warehouse market share in 2025, offering a compromise, robots shuttle totes within high-volume zones, while people handle exceptions, gift wrapping, or fragile SKUs. Fully automated nodes are on track for a 10.03% CAGR because labor shortages make 24/7 robotic uptime attractive, yet high entry tickets and new fire-code rules slow adoption. Operators increasingly subscribe to Robotics-as-a-Service contracts, paying usage fees rather than capitalizing the robots, which also shortens payback to under three years.
Manual operations still survive in reverse logistics and furniture handling, where product variety or bulk dimensions puzzle gantry arms. Even here, wearable scanners and AI image recognition cut decision time and reduce errors. Over the forecast horizon, the South Korea e-commerce warehouse market expects most greenfield projects to launch as semi-automated but with built-in conduits allowing a future lift to full automation once ROI hurdles clear.
By End-User Industry: Apparel Leads, Grocery Sets the Pace
Apparel and footwear commanded 32.46% of the South Korea e-commerce warehouse market size in 2025, driven by Korea’s fashion-savvy consumers and return rates above 25%. Facilities dedicated to this sector run high-speed sorters, RFID quality gates, and steam systems that refresh garments before resale. Grocery and FMCG is predicted to grow at a 10.53% CAGR through 2031 as online fresh-food penetration hit 18 % in 2025. Mixed-temperature chambers, humidity controls, and sub-60-minute delivery pledges make grocery warehouses among the most capital-intensive builds in the South Korea e-commerce warehouse market.
Consumer electronics and personal care segments keep steady growth but face a margin squeeze as products commoditize. Pharmaceutical, beauty, and wellness inventory benefits from bonded clearance and temperature-control features, allowing logistics operators to command double-digit yield premiums where compliance paperwork is bundled into the service contract.
Geography Analysis
Seoul Capital Area remained the center of gravity with 53.23% of national revenue in 2025 because 25.6 million residents generate dense order volume that justifies multi-layer distribution grids and a vast network of instant-delivery dark stores. Height caps and zoning push fresh investment across the city boundary into Gyeonggi Province, however, creating a ring of vertical warehouses and cross-docks that feed battery-electric vans and two-wheeled couriers. Satellite nodes significantly reduce average last-mile distance, offsetting diesel volatility and toll increases that have inflated transport cost per stop.
Chungcheong Region is projected to post the quickest 6.36% CAGR through 2031. It sits near the geographic midpoint of the peninsula, linking expressways and the KTX high-speed rail spine, and offers land 30-40% cheaper than Seoul suburbs. Local authorities matched national smart logistics subsidies with their own tax credits, financing numerous smart-retrofit projects inside existing industrial parks. Daejeon’s research corridor further supplies automation engineers, trimming project ramp-up times for inbound 3PLs.
Gyeongsang Region, anchored by Busan and Ulsan ports, leverages bonded zones to funnel K-Beauty and electronics exports to Southeast Asian buyers. Investors have poured substantial capital into bonded hubs since 2024, betting that free-trade agreements will keep cross-border parcels growing in high double digits. Jeolla and Gangwon hold niche positions: Jeolla focuses on agro-cold-chain linking Mokpo Harbour to domestic grocery e-tailers, while Gangwon’s rugged topography raises road freight cost, limiting its warehouse footprint to localized, smaller-scale distribution.[3]“Regional Economic Outlook, Chungcheong,” OECD, oecd.org
Competitive Landscape
Competition sits at a moderate level: the five largest operators, CJ Logistics, Hyundai Glovis, Lotte Global Logistics, ESR Korea Logistics, and LX Pantos, collectively hold a commanding share of the market. The next tier includes asset-light 3PLs that lease REIT-owned space, specialized cold-chain outfits, and D2C-centric fulfillment specialists. Scale alone no longer guarantees margin; differentiation now hinges on automation density, data-integration depth, and the ability to provide bonded export or value-added services inside a single site.
Players have adopted contrasting growth maps. CJ Logistics installed a private 5G mesh across flagship campuses that reports 20 % labor-productivity gains and rolled out a liquefied hydrogen transport service that cuts carbon footprint for long hauls. Hyundai Glovis earmarked USD 6.5 billion to lift revenue from automotive-centric contracts into omni-channel retail, battery recycling, and warehousing.[4]“Hyundai Glovis Unveils USD 6.5 Billion Diversification Plan,” KED Global Staff, kedglobal.com ESR Korea and domestic REIT peers unlocked a flywheel: they buy brownfield factories, retrofit vertical racking, sign long leases with 3PLs, then recycle capital through follow-on warehouse funds.
White-space niches remain. Ultra-cold life-science storage, bonded mini-hubs for direct exports, and micro-fulfillment nodes inside under-utilized retail basements all promise higher yield than generic sheds. Yet each niche carries its own barriers stringent fire-safety code for tall AS/RS, GDP certification for pharma, and digital-route orchestration for instant delivery meaning operational know-how rather than merely cheap capital decides winners inside the South Korea e-commerce warehouse market
South Korea E-Commerce Warehouse Industry Leaders
CMA CGM Group (Including CEVA Logistics)
CJ Logistics
Hyundai Glovis
Lotte Global Logistics
LX Pantos
- *Disclaimer: Major Players sorted in no particular order

Recent Industry Developments
- April 2026: Hyundai Glovis actively adjusted its global and domestic supply chain logistics networks in response to severe Middle Eastern shipping disruptions, utilizing alternative hubs to store cargo. This comes on the heels of their massive USD 6.5 billion strategic shift to diversify from automotive-only logistics into broader omni-channel retail and e-commerce warehousing.
- February 2026: LX Pantos acquired a massive KRW 216 billion (USD 148 million) logistics center in Katowice, Poland. While located in Europe, the 109,00 m² facility functions as the primary forward supply-chain base supporting South Korean companies (including consumer goods/e-commerce) expanding into the European market.
- January 2026: Korea Post announced plans to establish new state-of-the-art logistics centers within the Seoul metropolitan area to boost e-commerce delivery efficiency and expand next-day delivery capacity. The Korea Post Logistics Support Agency simultaneously began pilot projects for autonomous cargo trucks and AI-based hazard-detection forklifts at their facilities.
- January 2026: Korea Post announced plans to establish new state-of-the-art logistics centers within the Seoul metropolitan area to boost e-commerce delivery efficiency and expand next-day delivery capacity. The Korea Post Logistics Support Agency simultaneously began pilot projects for autonomous cargo trucks and AI-based hazard-detection forklifts at their facilities


South Korea E-Commerce Warehouse Market Report Scope
| Fulfilment Centres |
| Distribution Centres (DCs) |
| Cold-Chain Warehouses |
| Dark Stores / Micro-Fulfillment Centers |
| Others (Reverse Logistics Hubs, Bonded Warehouses, Hybrid-use Spaces, etc.) |
| Storage |
| Picking and Packing |
| Value-Added Services and Others (Kitting, Labelling) |
| Manual |
| Semi-Automated |
| Automated |
| Apparel and Footwear |
| Consumer Electronics |
| Grocery and FMCG |
| Pharmaceuticals, Beauty and Wellness |
| Home Essentials and Furnishings |
| Others |
| Seoul Capital Area |
| Chungcheong Region |
| Gyeongsang Region |
| Jeolla Region |
| Gangwon Province |
| Jeju Province |
| By Warehouse Type | Fulfilment Centres |
| Distribution Centres (DCs) | |
| Cold-Chain Warehouses | |
| Dark Stores / Micro-Fulfillment Centers | |
| Others (Reverse Logistics Hubs, Bonded Warehouses, Hybrid-use Spaces, etc.) | |
| By Service Type | Storage |
| Picking and Packing | |
| Value-Added Services and Others (Kitting, Labelling) | |
| By Automation Level | Manual |
| Semi-Automated | |
| Automated | |
| By End-User Industry | Apparel and Footwear |
| Consumer Electronics | |
| Grocery and FMCG | |
| Pharmaceuticals, Beauty and Wellness | |
| Home Essentials and Furnishings | |
| Others | |
| By Region | Seoul Capital Area |
| Chungcheong Region | |
| Gyeongsang Region | |
| Jeolla Region | |
| Gangwon Province | |
| Jeju Province |


Key Questions Answered in the Report
What is the projected value of the South Korea e-commerce warehouse market in 2031?
Forecasts place the market at about USD 1.12 billion by 2031, reflecting a 5.5 % CAGR from 2026.
Which warehouse type is growing the fastest?
Dark stores and micro-fulfillment centers should advance at roughly 10.95% CAGR through 2031 as consumers demand sub-hour delivery.
Why are value-added services attracting investment?
Brands tie unboxing quality and personalization to shopper loyalty, pushing warehouse operators to bundle kitting, labeling, and inspection that support a 10.42% CAGR for this service line.
How does zoning in Seoul affect warehouse growth?
Green Belt restrictions and 15 m height caps limit new builds, steering developers toward vertical retrofits and satellite hubs beyond the capital boundary.
What role do REITs play in warehouse supply?
REITs finance factory-to-warehouse conversions, offering flexible leases that let 3PLs access Class-A space without heavy upfront capital.
Page last updated on:


