Canada E-Commerce Warehouse Market Size and Share
Market Overview
| Study Period | 2020 - 2031 |
|---|---|
| Forecast Data Period | 2026 - 2031 |
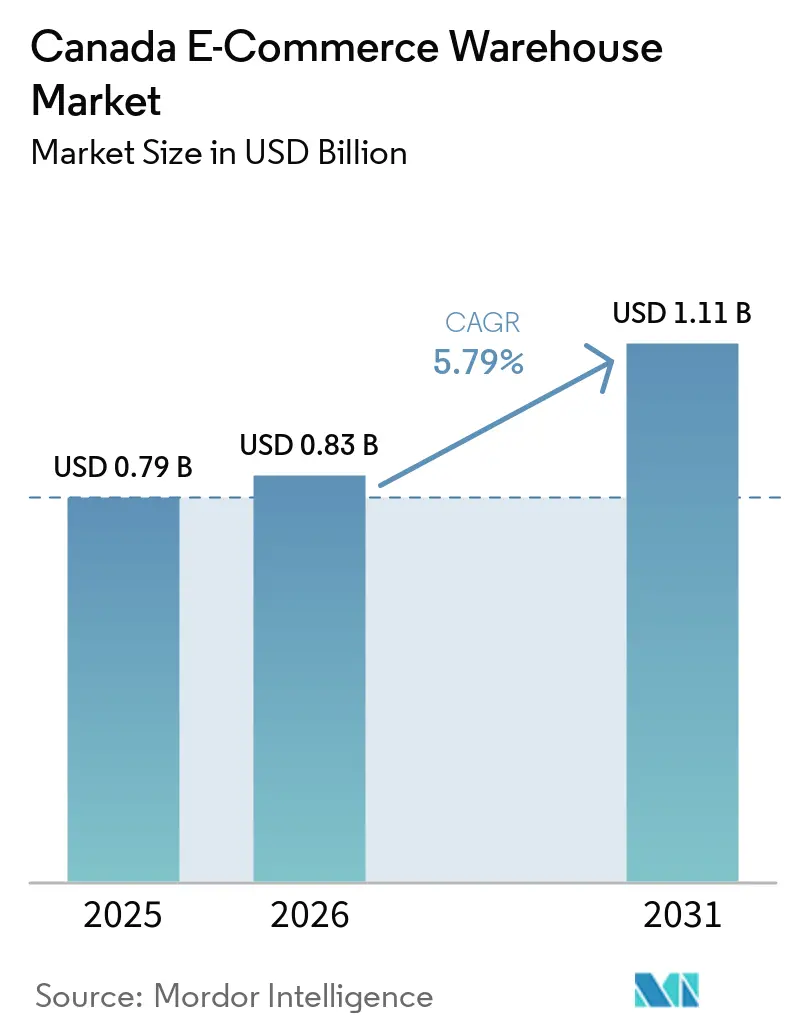
| Base Year Market Size (2025) | USD 0.79 Billion |
| Market Size (2026) | USD 0.83 Billion |
| Market Size (2031) | USD 1.11 Billion |
| Growth Rate (2026 - 2031) | 5.79% CAGR |
| Market Concentration | Low |
Major Players *Disclaimer: Major Players sorted in no particular order Image © Mordor Intelligence. Reuse requires attribution under CC BY 4.0. | |
Canada E-Commerce Warehouse Market Analysis by Mordor Intelligence
The Canada E-Commerce Warehouse Market size is expected to grow from USD 0.79 billion in 2025 to USD 0.83 billion in 2026 and is forecast to reach USD 1.11 billion by 2031 at 5.79% CAGR over 2026-2031.
Continued migration from capacity-driven expansion toward technology-intensive optimization defines current momentum, with operators deploying AI orchestration and robotics to raise throughput inside space-constrained urban footprints. Cross-border returns from the United States and European shoppers are generating reverse-logistics demand around major gateways, while subscription-commerce models encourage pooled-inventory micro-fulfillment centers that let several brands share automation and labor. Federal incentives for net-zero construction are steering capital into green warehouses featuring solar arrays and heat-recovery systems, although grid capacity shortfalls in Ontario and Quebec slow large-scale electrification of forklifts and automated material-handling equipment. Competitive positioning is shifting from pure asset ownership to technology differentiation as leading 3PLs race to integrate humanoid robots, AI-enabled slotting algorithms, and multilayer cybersecurity frameworks.
Key Report Takeaways
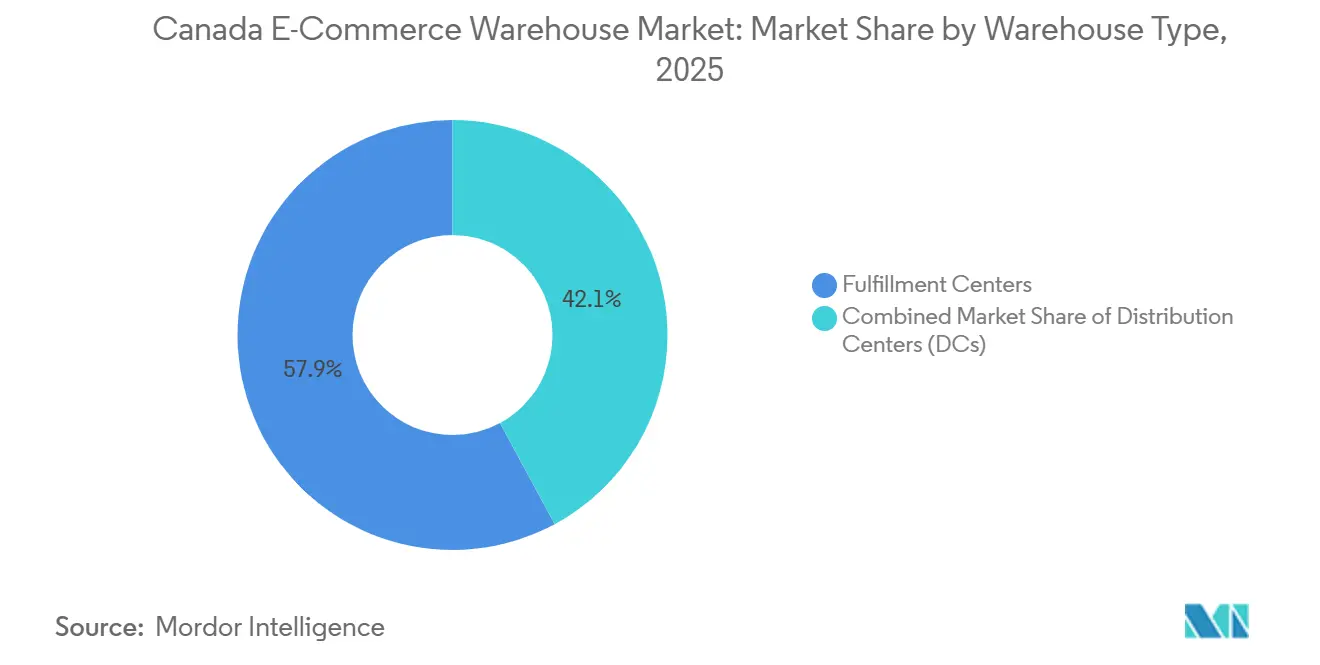
- By warehouse type, fulfillment centers led with 57.88% of Canada e-commerce warehouse market share in 2025, whereas dark stores and micro-fulfillment centres post the fastest 8.58% CAGR through 2031.
- By service type, storage captured 50.41% share of the Canada e-commerce warehouse market size in 2025, while value-added services are expected to advance at a 7.05% CAGR to 2031.
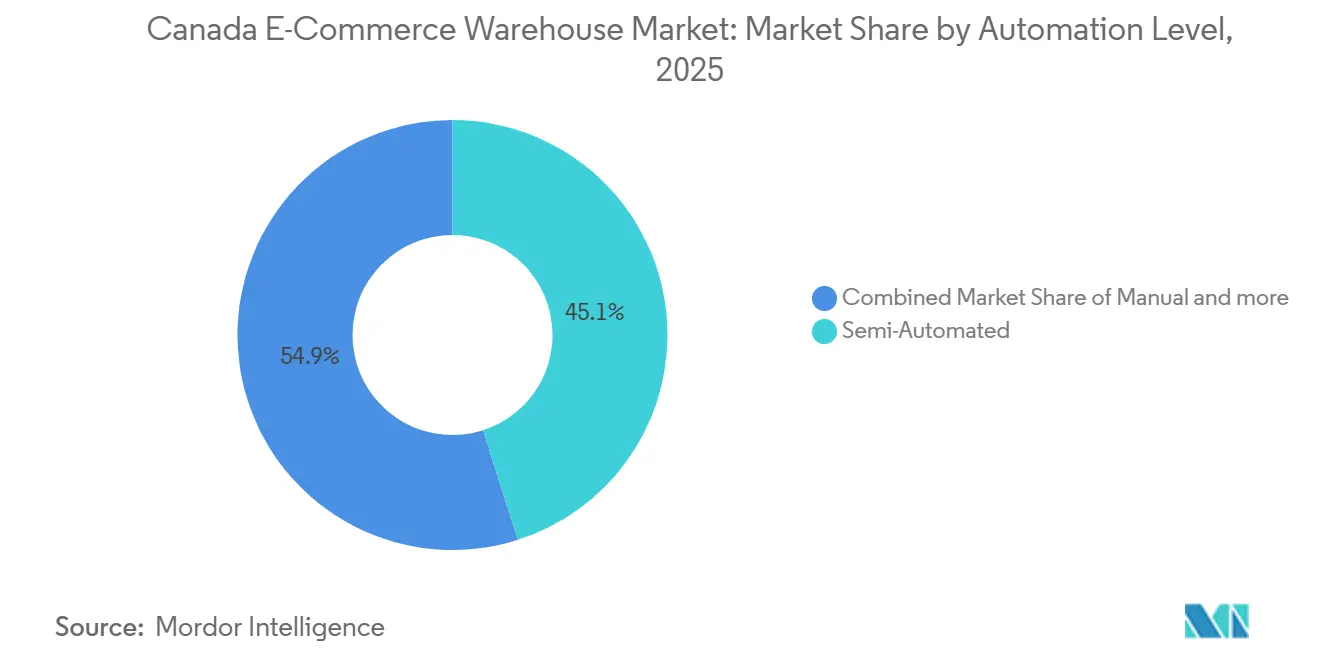
- By automation level, semi-automated facilities held 45.07% share in 2025, and fully automated sites are expected to record the highest 8.63% CAGR over the forecast horizon.
- By end-user industry, apparel and footwear commanded 23.34% share of the Canada e-commerce warehouse market size in 2025, yet grocery and FMCG expand at 7.08% CAGR through 2031.
Note: Market size and forecast figures in this report are generated using Mordor Intelligence’s proprietary estimation framework, updated with the latest available data and insights as of 2026.
Canada E-Commerce Warehouse Market Trends and Insights
Drivers Impact Analysis*
| Driver | (~) % Impact on CAGR Forecast | Geographic Relevance | Impact Timeline |
|---|---|---|---|
| Surge in cross-border returns driving reverse-logistics hubs | +1.0% | Southern Ontario, Lower Mainland BC | Medium term (2-4 years) |
| AI-driven warehouse orchestration boosting inventory productivity | +1.2% | National, concentrated in major metro areas | Short term (≤ 2 years) |
| Subscription-commerce growth fostering pooled-inventory micro-FCs | +0.7% | Toronto, Vancouver, Montreal urban cores | Medium term (2-4 years) |
| Federal green-building incentives accelerating net-zero warehouse builds | +0.5% | National, with premium uptake in BC and Ontario | Long term (≥ 4 years) |
| Omni-channel grocery fulfilment requiring temperature-mixed facilities | +0.9% | National, led by Ontario and Quebec | Short term (≤ 2 years) |
| Near-port Atlantic logi-parks capturing EU direct-to-Canada flows | +0.4% | Halifax, Saint John, Atlantic provinces | Long term (≥ 4 years) |
| Source: Mordor Intelligence | |||
Surge in Cross-Border Returns Driving Reverse-Logistics Hubs
Return rates topping 30% for online apparel and roughly 20% for electronics are forcing retailers to build specialized reverse-logistics nodes near border crossings and airports. Purolator’s 2025 acquisition of Livingston International boosts customs-brokerage depth, enabling faster disposition of returned goods. TFI International’s USD 635 million purchase of Hercules Forwarding adds 42 facilities capable of handling intricate cross-border workflows. Southwestern Ontario’s 99.8 million ft² of warehouse stock and short drayage to the United States highways position the region as a returns gateway. Operators now deploy AI-based condition-assessment systems that route items to resale, refurbishment, or recycling within seconds, lifting recovery values and shrinking cycle times[1]“Transforming Canada’s buildings sector for a net-zero and resilient future,” Natural Resources Canada, natural-resources.canada.ca.
AI-Driven Warehouse Orchestration Boosting Inventory Productivity
AI platforms coordinate people, mobile robots, and storage automation in real time, cutting idle travel and shrinking safety stock. Walmart Canada trimmed product-movement time by 90% after introducing robotics in two Ontario sites in 2024. The Stevens Company’s AutoStore solution in Brampton delivered a 5× productivity gain by pre-positioning high-velocity SKUs. GXO Logistics increased automated units 50% in 2023, reflecting confidence that orchestration yields superior ROI relative to stand-alone robots. AI-driven slotting also supports omni-channel operations by balancing B2C piece picks with B2B case replenishment. ePost Global’s Canada eDGE uses predictive analytics to ensure 95% of residents receive parcels in three days or fewer.
Subscription-Commerce Growth Fostering Pooled-Inventory Micro-FCs
Recurring box models favor compact, multi-tenant fulfillment centres where several brands share automation and labor. Shipfusion’s USD 40 million funding round backs the roll-out of FDA-registered facilities offering kitting, custom labeling, and scheduled shipment windows. Predictable demand profiles drive high utilization and smoother labor planning than volatile direct-to-consumer flows. Dark stores growing at 8.58% CAGR serve micro-markets inside 15-minute delivery radii, slashing last-mile costs. Platforms such as UniUni’s Small Business Network extend these benefits to SMEs via self-serve onboarding and pooled carrier rates.
Federal Green-Building Incentives Accelerating Net-Zero Warehouse Builds
Ottawa’s CAD 160 billion (USD 116.85 billion) clean-energy agenda rewards projects that integrate rooftop solar, ground-source heat pumps, and EV charging. A CAD 33.1 million (USD 24.17 million) federal allocation specifically bolsters green supply-chain infrastructure. Siemens Canada’s CAD 150 million (USD 109.55 million) battery-R&D hub in Oakville showcases low-carbon design and signals private-sector validation. Energy-efficient warehouses command rental premiums and appeal to tenants with science-based emission targets, although upfront costs run 15-25% higher than conventional builds. British Columbia’s carbon pricing accelerates adoption in the Lower Mainland, where operators face tangible levies on fossil-fuel heating[2]“Government of Canada’s new Canada Green Buildings Strategy to save Canadians money and create jobs,” Government of Canada, canada.ca.
Restraints Impact Analysis*
| Restraint | (~) % Impact on CAGR Forecast | Geographic Relevance | Impact Timeline |
|---|---|---|---|
| Grid-capacity limits delaying large-scale EV/forklift electrification | -0.8% | Ontario, Quebec, urban industrial zones | Medium term (2-4 years) |
| Mandatory ESG disclosures inflating retrofit and compliance costs | -0.6% | National, acute for older facilities | Short term (≤ 2 years) |
| Volatile ocean freight rates complicating space-planning commitments | -0.5% | Port-adjacent markets, import-heavy sectors | Short term (≤ 2 years) |
| Escalating cyber-threats to WMS and automation platforms | -0.4% | National, concentrated in highly automated facilities | Medium term (2-4 years) |
| Source: Mordor Intelligence | |||
Grid-Capacity Limits Delaying Large-Scale Electrification
Modern automated sites need 2-5 MW of continuous power, yet legacy distribution networks around Toronto and Montreal were designed for loads of just 50-100 kW. Utility upgrades can cost CAD 2-5 million (USD 1.46-3.65 million) and extend project timelines by 12-18 months. Fast-charging depots for 50 electric trucks may draw 10 MW, matching a small factory. Developers are adding battery storage to shave peaks, but doing so pushes capex higher and adds operational complexity. Quebec’s hydro resources soften the blow; however, even there distribution bottlenecks slow forklift electrification[3]“Powering Canada Forward: Building a Clean, Affordable, and Reliable Electricity System,” Natural Resources Canada, natural-resources.canada.ca.
Mandatory ESG Disclosures Inflating Retrofit and Compliance Costs
Draft federal rules obligate operators to track Scope 1-3 emissions, triggering energy audits and installation of advanced building-management systems. Retrofit bills range from CAD 15-40/ft², adding 5-10% to new-build costs. Smaller 3PLs without dedicated sustainability teams face disproportionate burdens, accelerating M&A as larger firms buy scale advantages. Certification programs like LEED or BOMA BEST offer proof of compliance yet lengthen development cycles and require third-party verifications[4]“Government advances Made-in-Canada sustainable investment guidelines and mandatory climate disclosures,” Government of Canada, canada.ca.
*Our forecasts treat driver/restraint impacts as directional, not additive. The impact forecasts reflect baseline growth, mix effects, and variable interactions.
Segment Analysis
By Warehouse Type: Urban Micro-Fulfillment Accelerates Service Speed
Fulfillment centers retained leadership with 57.88% of Canada e-commerce warehouse market share in 2025, anchoring national next-day delivery standards. Dark stores and micro-fulfillment centers, however, post the segment-leading 8.58% CAGR to 2031 thanks to grocers and quick-commerce apps seeking 15-minute drop-offs. The Canada e-commerce warehouse market size for dark stores is projected to expand from USD 0.127 billion in 2026 to USD 0.205 billion by 2031. Converting dormant retail locations into automated mini-hubs cuts real-estate costs and sidesteps zoning delays. Robotics density is highest in these compact facilities, enabling sub-4% fulfillment costs relative to merchandise value.
Rural and suburban demand still flows to regional distribution centers that consolidate inbound containers and replenish stores. Cold-chain warehouses expand steadily as online grocery scales and pharmaceutical distribution demand strict temperature control. Reverse-logistics hubs, classified under “other,” gain traction near border crossings where inspection, refurbishment, and recycling occur under one roof.


By Service Type: Higher-Margin Value-Added Workflows Outpace Storage
Storage generated 50.41% of the 2025 market share, yet competitive pressure keeps its margins thin. The Canada e-commerce warehouse market size tied to value-added services should climb at a 7.05% CAGR, reflecting brand willingness to pay for kitting, custom packaging, and returns grading. Outsourcing these tasks to 3PLs improves accuracy and scalability. Canada e-commerce warehouse market share for value-added work reached 18% in 2025 and continues to rise as subscription brands demand complex assembly and gift-box options.
Picking and packing stay essential, but AI-directed labor and goods-to-person robots drive cost per order lower each year. Providers layer consulting, demand-planning, and compliance expertise on top, cementing stickier contracts and widening total addressable revenue beyond pallet storage fees.
By Automation Level: Robotics Investment Momentum Builds
Semi-automated sites captured 45.07% of the market share in 2025, illustrating the popularity of hybrid models that blend human dexterity with robotic stamina. Yet fully automated warehouses record the swiftest 8.63% CAGR as falling sensor and actuator prices intersect with chronic labor shortages. The Stevens Company squeezed 25% extra capacity from its Brampton facility through AutoStore robots, proving retrofit economics compelling. Power availability remains the gating factor; sites with existing high-voltage service gain cost-of-capital advantages when deploying shuttle systems, AS/RS units, or autonomous forklifts.
Manual facilities linger in lower-volume categories where investments cannot be justified or in specialty verticals such as fine art and hazardous goods. Even here, lightweight mobile robots that tow carts are entering because payback periods drop below 36 months at urban wage levels.
By End-User Industry: Grocery and FMCG Command Growth Spotlight
Apparel and footwear held the largest 23.34% share in Canada e-commerce warehouse market size in 2025, owing to early e-commerce adoption and high return intensity. Grocery and FMCG, however, lead growth at 7.08% CAGR as consumers keep ordering fresh produce, frozen meals, and household staples online. Metro Inc.’s CAD 1 billion (USD 730.36 million) automation program underpins this trend, while cold-storage investments by NewCold and others create upstream capacity.
Consumer electronics and pharmaceuticals also expand, each requiring secure handling and, in the case of drugs, strict Health Canada compliance. Home essentials and furnishings add floor-space demand for bulky SKUs but face longer delivery windows, allowing lower-cost regional hubs rather than urban micro-sites.
Geography Analysis
Ontario anchors the Canada e-commerce warehouse market with Southwestern Ontario alone housing 99.8 million ft² of space and vacancy near 2.2%. Land costs topping CAD 2 million (USD 1.46 million) per acre around Toronto divert development to Cambridge, Guelph, and Barrie, yet proximity to 401-series highways and the Windsor-Detroit corridor keeps the province dominant. Battery and tire plants from Asahi Kasei and Goodyear add upstream warehouse traffic, while Siemens Canada’s Oakville R and D hub joins a growing electric-vehicle supply chain.
Quebec follows, leveraging Montreal’s port gateway and hydro-powered electricity rates that ease forklift electrification. Metro Inc.’s Terrebonne fresh centre cements the province’s role in grocery logistics. Atlantic Canada courts European shippers through Halifax, chasing the near-port strategy that promises shorter transit times from EU origins; still, limited modern space and a smaller consumer base temper growth.
British Columbia’s Lower Mainland suffers sub-1% industrial vacancy, pushing some occupiers into Alberta where cheaper land and new highway connections entice 3PLs. NewCold’s Southern Alberta expansion illustrates how inland locations support Western regional distribution even though goods must double back to the coast for Vancouver deliveries.
Competitive Landscape
The Canada e-commerce warehouse market features fragmentation yet slow consolidation as carriers integrate warehousing. TFI International spent USD 1.1 billion on Daseke and USD 635 million on Hercules Forwarding, forming an asset-rich platform spanning trucking, customs brokerage, and storage.
Purolator’s Livingston deal enlarges its cross-border toolkit and captures growing returns flows. Technology intensity distinguishes leaders: GXO Logistics grew automation units 50% and partnered with Apptronik on humanoid robots, while Walmart Canada’s Vaughan center showcases robotics that slash travel time by 90%.
Cyber-resilience emerges as a differentiator; post-strike Canada Post disruptions in 2024 revealed the profit risk of single-carrier reliance. Mid-tier innovators such as UniUni democratize fulfillment for SMEs via pooled micro-centers, and Shipfusion targets FDA-registered health products requiring strict traceability. White-space remains in pharmaceutical cold chains, pooled subscription logistics, and Atlantic port-centric distribution.
Canada E-Commerce Warehouse Industry Leaders
DHL Group
Canada Post
United Parcel Service of America, Inc.
FedEx
Metro Supply Chain Group
- *Disclaimer: Major Players sorted in no particular order

Recent Industry Developments
- January 2026: UniUni unveiled its Small Business Network in Toronto to simplify SME parcel shipping with real-time platform access.
- February 2025: Purolator bought Livingston International, bolstering customs brokerage and reverse-logistics capabilities.
- January 2025: Walmart Canada committed CAD 6.5 billion (USD 4.74 billion) over five years for new stores and its advanced Vaughan distribution center.
- June 2024: TFI International closed its USD 1.1 billion Daseke acquisition to scale specialized transport assets.


Canada E-Commerce Warehouse Market Report Scope
| Fulfillment Centers |
| Distribution Centers (DCs) |
| Cold-Chain Warehouses |
| Dark Stores / Micro-Fulfillment Centers |
| Others (Reverse Logistics Hubs, Bonded Warehouses, Hybrid-use Spaces, etc.) |
| Storage |
| Picking and Packing |
| Value-Added Services and Others (Kitting, Labelling) |
| Manual |
| Semi-Automated |
| Automated |
| Apparel and Footwear |
| Consumer Electronics |
| Grocery and FMCG |
| Pharmaceuticals, Beauty and Wellness |
| Home Essentials and Furnishings |
| Others |
| By Warehouse Type | Fulfillment Centers |
| Distribution Centers (DCs) | |
| Cold-Chain Warehouses | |
| Dark Stores / Micro-Fulfillment Centers | |
| Others (Reverse Logistics Hubs, Bonded Warehouses, Hybrid-use Spaces, etc.) | |
| By Service Type | Storage |
| Picking and Packing | |
| Value-Added Services and Others (Kitting, Labelling) | |
| By Automation Level | Manual |
| Semi-Automated | |
| Automated | |
| By End-User Industry | Apparel and Footwear |
| Consumer Electronics | |
| Grocery and FMCG | |
| Pharmaceuticals, Beauty and Wellness | |
| Home Essentials and Furnishings | |
| Others |


Key Questions Answered in the Report
What CAGR is forecast for Canada’s e-commerce warehouse segment between 2026 and 2031?
The sector is projected to grow at 5.79% annually over that period.
Which warehouse type is expanding the fastest?
Dark stores and micro-fulfillment centers record the highest 8.58% CAGR as retailers chase 15-minute delivery promises.
Which service category provides the best growth opportunity?
Value-added services such as kitting and custom packaging rise at 7.05% CAGR, outpacing basic storage.
How serious are power constraints for new automated sites?
Grid limitations in Ontario and Quebec can delay projects up to 18 months and add millions in connection costs, making electricity access a key site-selection factor.
Which end-user group will drive incremental demand?
Grocery and FMCG segments expand at 7.08% CAGR as online food shopping normalizes and cold-chain capacity scales.
Why are reverse-logistics hubs proliferating?
Cross-border return rates above 30% for apparel compel retailers to build inspection and refurbishment centers close to major gateways to cut processing time and recover product value.
Page last updated on:


