United Kingdom Artificial Intelligence (AI) Data Center Market Size and Share
Market Overview
| Study Period | 2020 - 2031 |
|---|---|
| Forecast Data Period | 2026 - 2031 |
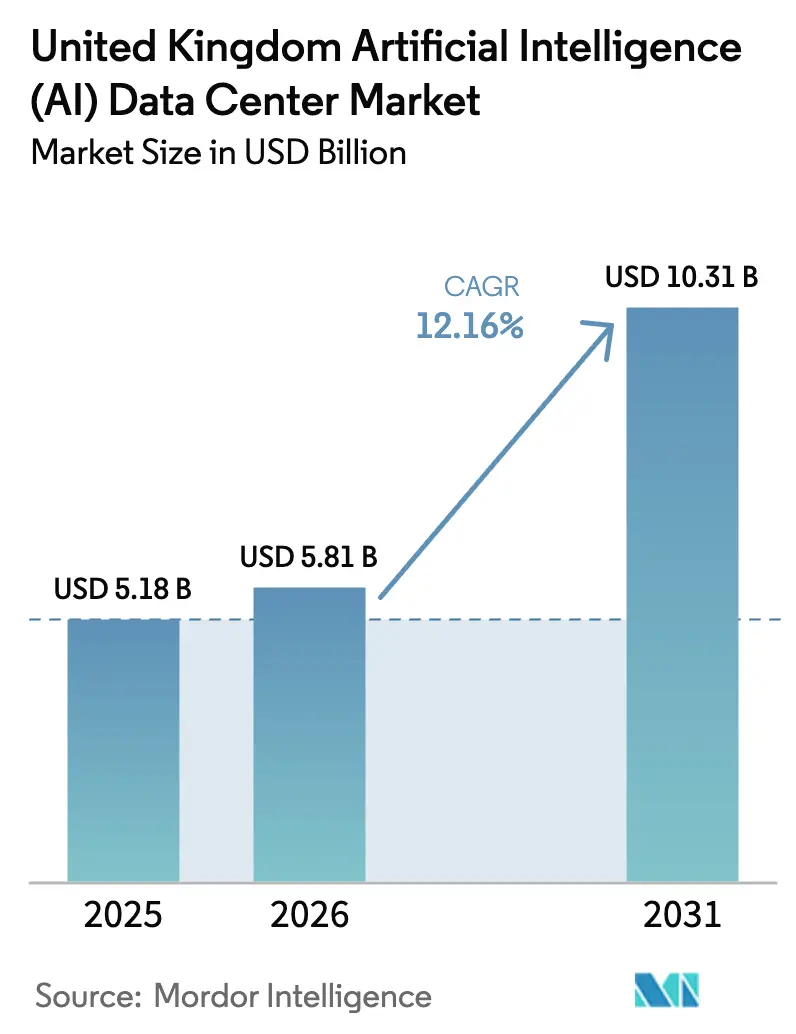
| Base Year Market Size (2025) | USD 5.18 Billion |
| Market Size (2026) | USD 5.81 Billion |
| Market Size (2031) | USD 10.31 Billion |
| Growth Rate (2026 - 2031) | 12.16% CAGR |
| Market Concentration | Medium |
Major Players *Disclaimer: Major Players sorted in no particular order Image © Mordor Intelligence. Reuse requires attribution under CC BY 4.0. | |
United Kingdom Artificial Intelligence (AI) Data Center Market Analysis by Mordor Intelligence
The United Kingdom AI data center market size in 2026 is estimated at USD 5.81 billion, growing from 2025 value of USD 5.18 billion with 2031 projections showing USD 10.31 billion, growing at 12.16% CAGR over 2026-2031. The current AI data center market size mirrors unprecedented public and private investment momentum, underpinned by the government’s GBP 900 million Bletchley super-compute program and more than GBP 25 billion in corporate commitments.[1]“£25 billion private investment to grow UK’s AI sector,” GOV.UK, gov.uk The rapid adoption of generative AI in enterprises, stricter data-residency requirements, and demand-side renewable power purchase agreements are reshaping digital infrastructure strategies. Operators are redirecting build plans toward regions with shorter grid-access queues and abundant clean energy, while accelerating deployment of liquid-cooled racks that handle power densities five times higher than traditional loads.[2]“Connections Action Plan,” Ofgem, ofgem.gov.uk Competitive intensity is growing as hyperscalers race for scarce high-capacity sites, and specialized colocation players leverage proximity advantages around London’s upgraded sub-2 millisecond Internet Gateway. Labor shortages in certified electrical engineering and tightening environmental audits are adding execution risks that favor experienced incumbents able to fund in-house talent pipelines.
Key Report Takeaways
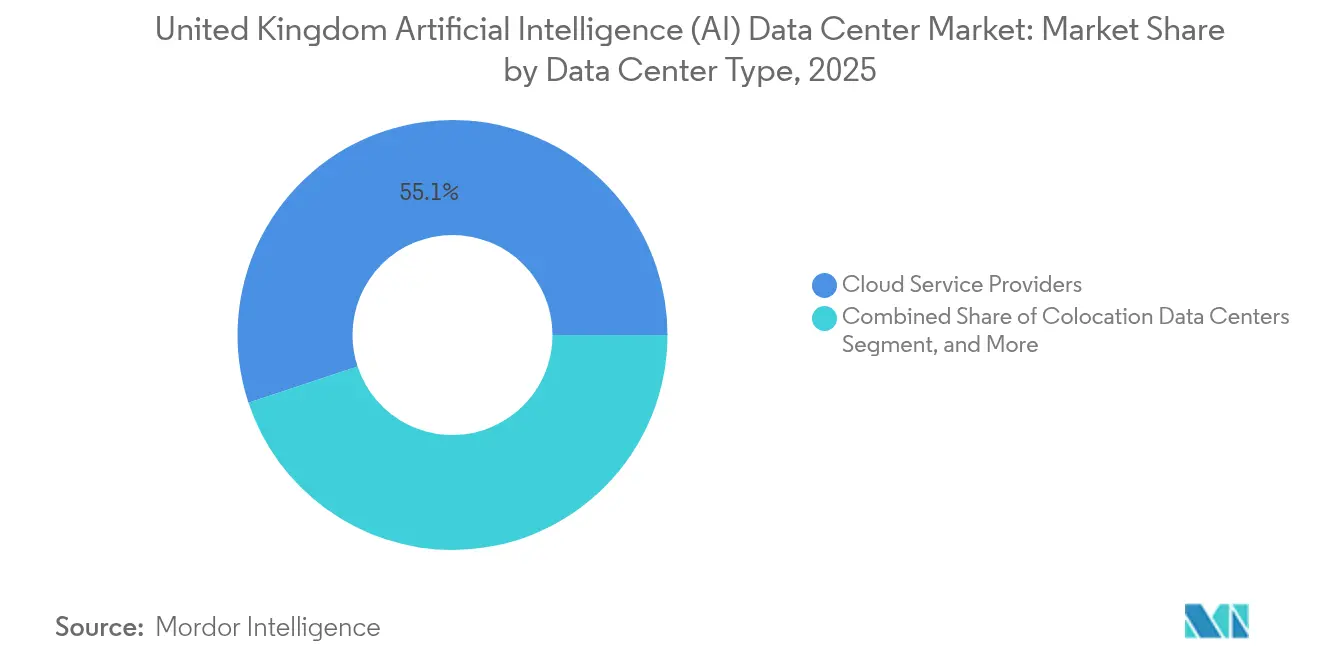
- By data center type, Cloud Service Providers led with 55.10% of the United Kingdom's AI data center market share in 2025, while Colocation Data Centers are expected to advance at a 15.05% CAGR to 2031.
- By component, software accounted for a 45.25% share of the United Kingdom's AI data center market size in 2025, while hardware is expected to expand at a 14.22% CAGR through 2031.
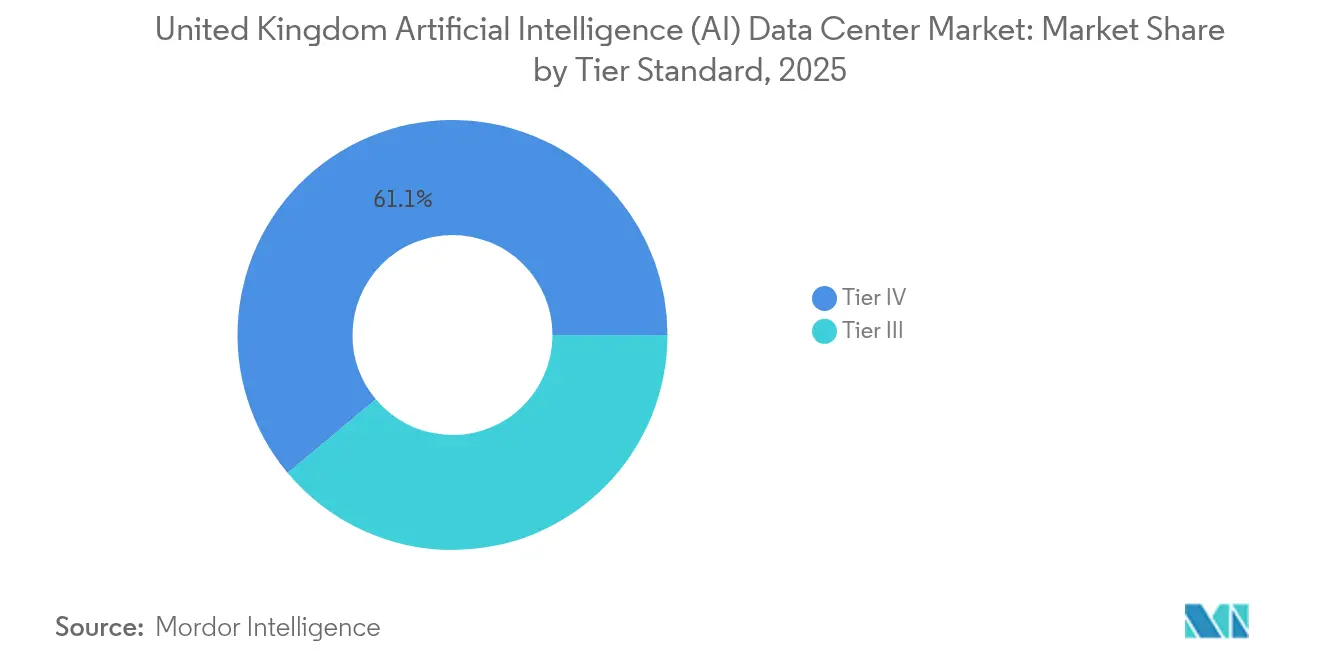
- By tier standard, Tier IV facilities captured 61.10% of the United Kingdom's AI data center market share in 2025, and Tier III is projected to grow at a 15.40% CAGR through 2031.
- By end-user industry, IT and ITES held 33.40% of the United Kingdom's AI data center market share in 2025, whereas the Internet and Digital Media sector is forecast to post the fastest CAGR of 13.71% through 2031.
Note: Market size and forecast figures in this report are generated using Mordor Intelligence’s proprietary estimation framework, updated with the latest available data and insights as of 2026.
Country specific signals from United kingdom may or may not directly align with patterns observed across other geographies. The global artificial intelligence (ai) data center market brings these into a unified structure.
United Kingdom Artificial Intelligence (AI) Data Center Market Trends and Insights
Drivers Impact Analysis*
| Driver | (~) % Impact on CAGR Forecast | Geographic Relevance | Impact Timeline |
|---|---|---|---|
| Generative-AI adoption by UK enterprises | +2.1% | National, focus on London and Manchester | Medium term (2–4 years) |
| Demand-side renewable PPAs | +1.8% | National, early in Scotland and Wales | Long term (≥ 4 years) |
| Venture funding with UK data-residency clauses | +1.5% | London and Edinburgh financial districts | Short term (≤ 2 years) |
| Tax “full-expensing” regime for AI hardware | +1.2% | National, stronger in enterprise segments | Medium term (2–4 years) |
| GBP 900 million Bletchley super-compute plan | +0.9% | National research clusters | Long term (≥ 4 years) |
| London sub-2 ms Internet Gateway upgrades | +0.7% | London and Southeast England | Short term (≤ 2 years) |
| Source: Mordor Intelligence | |||
Rapid Adoption of Generative-AI by UK Enterprises
Enterprises across finance, healthcare, and retail are embedding large-language models into mission-critical workflows, driving demand for tensor-optimized processors and high-bandwidth memory that legacy facilities cannot accommodate. Organizations are splitting workloads between cloud-based model training and on-premises inference to maintain data sovereignty, which increases connectivity requirements between private and public environments.[3]“Financial Stability Report December 2024,” Bank of England, bankofengland.co.uk Power draws per rack have risen to 50 kilowatts, compelling operators to redesign switchgear and power-distribution zones. Edge nodes clustered around London and Manchester are gaining traction to support sub-20-millisecond latency goals in algorithmic trading and imaging diagnostics. GDPR enforcement further motivates firms to keep sensitive training datasets within UK borders, reinforcing localized capacity demand.
Demand-Side PPAs for Renewable-Powered AI Workloads
Data-center siting decisions increasingly prioritize proximity to wind and solar resources over traditional metropolitan grids. Operators craft 24/7 renewable PPAs that align workload scheduling with generation peaks, unlocking dynamic electricity pricing benefits. AI training clusters are shifted to off-peak windows when renewable energy output is highest, thereby reducing the energy cost per tera-operation. Battery storage and automated demand-response participation earn ancillary-service revenue, improving project returns. Enterprises specify hourly-matched renewable certificates, raising the bar on transparency and prompting suppliers to adopt real-time tracking.
Rising Venture Funding that Mandates UK Data-Residency
Venture capital term sheets now embed clauses requiring critical AI models and datasets to remain on UK soil to mitigate sovereignty risk. Fintech and health-tech startups, therefore, contract with domestic AI-ready colocation facilities offering turnkey compliance portals and audit trails. This captive demand stimulates build-to-suit projects around London and Edinburgh, and accelerates provisioning of secure interconnects to hyperscale cloud zones for burst training runs. The geopolitical backdrop underscores the importance of demonstrable data governance, enhancing the value of UK-based infrastructure in European expansion strategies.
Tax “Full-Expensing” Regime for AI Hardware Cap-Ex
Immediate cost deduction for qualifying AI hardware compresses payback periods on GPU clusters, quantum accelerators, and immersion-cooling systems. Operators bring forward refresh cycles to secure relief before policy sunset, intensifying procurement and widening lead times for cutting-edge components. Domestic facilities gain pricing flexibility over their international peers, who lack comparable tax relief, nudging multinational tenants to favor UK footprints for their next AI deployment tranche. Rapid depreciation also unlocks funding for experimental hardware such as photonic interconnect fabrics.
Restraints Impact Analysis*
| Restraint | (~) % Impact on CAGR Forecast | Geographic Relevance | Impact Timeline |
|---|---|---|---|
| Grid-connection queue times exceeding 24 months | -0.8% | National, with severe impact in Southeast England | Medium term (2-4 years) |
| Shortage of certified data-center electrical engineers | -0.6% | National, with acute shortages in London and Manchester | Long term (≥ 4 years) |
| Planning-permission limits near London Green Belt | -0.4% | Southeast England, particularly Greater London area | Medium term (2-4 years) |
| Environment Agency's stricter water-usage audits | -0.3% | National, with higher impact on high-density AI facilities | Short term (≤ 2 years) |
| Source: Mordor Intelligence | |||
Grid-Connection Queue Times Exceeding 24 Months
Connection requests for 50-megawatt-plus AI campuses have tripled since 2024, straining the capacity of distribution network operators and adding two years to typical build schedules. Developers redirect capital toward retrofit acquisitions of brownfield sites with existing feeds, pushing valuations higher and limiting greenfield entrants. Modular deployments that scale in 10-megawatt phases are gaining favor to align with staged grid upgrades. Uneven capacity across regions nudges investment northward, potentially rebalancing the historically London-centric topology. Electricity market reform proposals promise queue-reduction mechanisms, yet their implementation will not materially ease constraints before 2027.
Shortage of Certified Data-Center Electrical Engineers
AI-grade topologies require high-density busways, leak-free liquid-cooling loops, and instrumentation that few UK engineers have mastered. Vacancy rates exceed 20% in London, driving up salaries and extending commissioning timelines. Operators respond by partnering with technical colleges and sponsoring accelerated apprenticeships, but experiential learning curves limit near-term relief. Wage inflation widens cost differentials between Tier III edge projects and Tier IV mega-campuses, complicating ROI calculations for speculative builds.
*Our forecasts treat driver/restraint impacts as directional, not additive. The impact forecasts reflect baseline growth, mix effects, and variable interactions.
Segment Analysis
By Data Center Type: Cloud Dominance Faces Colocation Challenge
Cloud Service Providers retained 55.10% of the United Kingdom AI data center market share in 2025 as their hyperscale footprints anchored national capacity. The colocation segment, however, is posting a 15.05% CAGR through 2031, reflecting the enterprise's desire for hybrid architectures that keep inference nodes within sovereign borders while utilizing cloud bursts for training. Startups drawn to venture-funding residency clauses prefer colocation suites that bundle compliance reporting and high-bandwidth cross-connects to public cloud GPU clusters. Edge micro-sites attached to 5G aggregation points enable AI inference within 20 milliseconds of end users, while enterprise on-premises nodes satisfy workloads bound by data-sensitivity or deterministic latency needs.
The cloud segment counters this by carving out “AI zones” within existing hyperscale data centers, offering bare-metal GPU pods with deterministic throughput. Bundled ML-platform services further entrench cloud incumbents; however, regulatory scrutiny over data localization prevents the full repatriation of sensitive use cases. As a result, the AI data center market continues to lean on colocation for compliance and proximity advantages, while the cloud retains dominance in compute-intensive training cycles.


By Component: Hardware Acceleration Outpaces Software Growth
Software held 45.25% of 2025 revenue, but hardware is growing faster at a 14.22% CAGR, reflecting a shift from algorithmic tuning to infrastructure scaling. Power-delivery units and liquid-cooling manifolds account for the largest hardware spend as operators retrofit racks for 50-kilowatt loads. Specialized accelerators such as tensor cores, quantum-ready processors, and photonic-interconnect NICs lead the refresh wave, financed by the full-expensing incentive. Software revenues remain robust in model-ops platforms, autoML tools, and inference runtimes optimized for energy efficiency; however, incremental gains plateau without corresponding hardware improvements.
Services revenue rides the complexity curve; managed AI infrastructure contracts bundle 24/7 monitoring, model lifecycle security, and predictive maintenance of pumps and heat exchangers. That professional-services layer locks tenants into longer contracts, shoring up recurring revenue streams as the UK AI data center market transitions from the build-out phase to optimization.
By Tier Standard: Tier IV Stability Meets Tier III Agility
Tier IV commanded 61.10% of the AI data center market share in 2025, as financial services and healthcare clients require continuous availability during model training runs that can last for weeks. Tier III is advancing at a 15.40% CAGR, making it a favored choice for cost-sensitive inference clusters and development and test environments that can withstand controlled downtime. Enhanced Tier III designs incorporate dual utility feeds, N+1 power paths, and liquid-cooling redundancy, which is sufficient for AI edge nodes deployed within metropolitan fiber hubs.
Meanwhile, Tier IV campuses evolve with trip-redundant pump loops and localized heat recovery, achieving a power usage effectiveness (PUE) metric of 1.15 on sustained 100-megawatt loads. Financial services regulators continue to mandate Tier IV for AI-driven risk-modeling functions, sustaining a high baseline of demand, although growth skews toward more agile Tier III builds positioned near user clusters.
By End-User Industry: IT Dominance Challenged by Media Innovation
IT and ITES players captured a 33.40% share in 2025, reflecting the long-standing demand for outsourcing and cloud services. Yet, Internet and Digital Media workloads are scaling at a 13.71% CAGR, driven by generative content pipelines and real-time audience personalization engines. Media firms deploy transformer-based models that simulate non-player characters in video games or auto-draft streaming captions, requiring low-latency inference nodes co-located with content-delivery networks.
BFSI institutions expand fraud-detection meshes and algorithmic-trading sandboxes, cementing a premium colocation footprint in Docklands. Healthcare utilizes AI-assisted diagnostics hosted in regional hubs to comply with NHS data sovereignty policies. Manufacturing outfits adopt predictive-maintenance analytics in edge nodes adjacent to plant floors, and the government commands stable demand for cyber-defense analytics. Telecoms embed AI in network-edge cabinets for traffic management and anomaly detection, fortifying a distributed build pattern that complements core-cloud campuses.
Geography Analysis
London and Southeast England together account for the majority of AI data-center installed capacity, anchored by proximity to the City’s finance ecosystem and sub-2 millisecond gateway latency. The region benefits from dense fiber, mature supply chains, and an abundance of technical talent; however, planning restrictions around the Green Belt and protracted grid queues constrain incremental builds. As a result, the AI data center market size in London is growing at a moderated pace relative to emerging hubs.
Northern England clusters around Manchester and Leeds are ascending as alternative destinations, offering lower land costs, faster grid connections, and a Midlands-to-Scotland fiber spine that supports edge-inference distribution. Regional universities provide a steady stream of graduates for colocation operations, and municipal authorities expedite zoning approvals to attract digital infrastructure tax revenue.
Scotland leverages its abundant onshore and offshore wind to attract high-density AI training campuses, pairing 24/7 renewable PPAs with battery-augmented power blocks. Edinburgh’s financial-services cluster amplifies demand for latency-sensitive inference nodes, and the government’s green-data strategy subsidizes heat-recovery networks that export waste heat to district-energy grids. Wales employs enterprise zones and favorable property-tax schemes to attract modular builds near Cardiff, while improved subsea cable landing points connect Irish and continental traffic routes. Collectively, these regional pushes diversify risk away from Southeast congestion and expand national resilience.
Analysis of the artificial intelligence (ai) data center market by Mordor Intelligence spans multiple other regional evaluations across Europe, Middle East and Africa, and North America, supported by country-level insights for Netherlands, Germany, Saudi Arabia, Canada, Thailand, and Australia, wherein local market conditions keep varying from one country to another.
Competitive Landscape
Competition in the United Kingdom AI data center market is moderate and intensifying. Hyperscalers, such as AWS, Microsoft, and Google, pursue multi-billion-pound expansions to secure capacity head starts, while institutional investors acquire independent colocation chains to achieve scale aggregation. Differentiation pivots on liquid-cooling competence, renewable integration guarantees, and certified compliance toolkits, rather than relying solely on raw cubic footage.[4]“UK data center industry standards,” Data Centre Alliance, datacentrealliance.org
Specialized operators deploy micro-data-center pods inside urban cores, achieving location advantages that hyperscale footprints cannot replicate. Partnerships between cloud giants and energy suppliers experiment with real-time renewable matching, signaling a future where workload orchestration responds to grid carbon intensity. Talent scarcity confers an advantage to firms that invest in apprenticeship pipelines and proprietary training curricula, thereby reducing their dependence on contractors. The resulting United Kingdom AI data center market exhibits a blended structure where top providers command sizable but not dominant shares, leaving room for innovative regional entrants.
United Kingdom Artificial Intelligence (AI) Data Center Industry Leaders
Amazon.com, Inc. (AWS)
Microsoft Corporation
Google Cloud (Google LLC)
Meta Platforms, Inc.
NVIDIA Corporation (DGX Cloud)
- *Disclaimer: Major Players sorted in no particular order

Recent Industry Developments
- October 2025: AWS announced an additional GBP 8 billion expansion targeting AI-optimized liquid-cooled halls and region-wide renewable energy sourcing.
- September 2025: Blackstone completed a GBP 10 billion acquisition of QTS Realty Trust’s European assets, including major UK sites earmarked for AI retrofits.
- August 2025: Microsoft partnered with Octopus Energy to enable real-time 24/7 renewable matching for AI workloads.
- July 2025: CyrusOne committed GBP 6.3 billion to five new UK campuses featuring 100-megawatt AI training blocks and district-heating integration.
- June 2025: Digital Realty has launched an AI-ready colocation platform in London, featuring pre-configured GPU clusters and compliance automation.
- May 2025: Equinix has opened its third London AI facility, offering quantum research bays with precision cooling.


Research Methodology Framework and Report Scope
Market Definitions and Key Coverage
Our study treats the United Kingdom artificial-intelligence-optimised data center market as all revenue linked to building, equipping, and operating facilities purposely engineered for AI workloads, including hyperscale owner-operated campuses, colocation halls retrofitted for liquid-cooled GPU racks, and edge nodes that support inference close to users. Spend on electrical and mechanical infrastructure, IT hardware, specialist middleware, and managed AI hosting services is captured throughout the value chain.
Scope exclusion: High-performance computing clusters housed within universities and sovereign super-computers are not included.
Segmentation Overview
- By Data Center Type
- Cloud Service Providers
- Colocation Data Centres
- Enterprise / On-Premises / Edge
- By Component
- Hardware
- Power Infrastructure
- Cooling Infrastructure
- IT Equipment
- Racks and Other Hardware
- Software Technology
- Machine Learning
- Deep Learning
- Natural Language Processing
- Computer Vision
- Services
- Managed Services
- Professional Services
- Hardware
- By Tier Standard
- Tier III
- Tier IV
- By End-user Industry
- IT and ITES
- Internet and Digital Media
- Telecom Operators
- Banking, Financial Services and Insurance (BFSI)
- Healthcare and Life Sciences
- Manufacturing and Industrial IoT
- Government and Defense
Detailed Research Methodology and Data Validation
Primary Research
We interviewed facility design engineers, colocation sales managers, UK grid-planner advisers, and procurement leads at hyperscalers across London, Manchester, and emerging AI Growth Zones. These talks clarified average rack power (now cresting 120 kW), lead-time realities for 132 kV substations, and typical service price bands, which sharpened assumptions surfaced from desk work.
Desk Research
Mordor analysts began with public datasets from sources such as the UK Office for National Statistics, Ofgem grid-connection registers, Companies House filings, and industry associations like the TechUK Data Centre Council. Technical insights were enriched through peer-reviewed papers on liquid cooling efficiency and GPU rack density, patents via Questel, and shipment data from Volza for key components. Paid databases, D&B Hoovers for financials and Dow Jones Factiva for capex news, helped map operator pipelines. This list is illustrative; many other materials fed initial estimates.
Market-Sizing & Forecasting
Top-down sizing began with commissioned and under-construction megawatt capacity, converted to spend through a bill-of-materials cost curve and validated against ASP x volume roll-ups from sampled suppliers. Penetration rates for AI racks, PUE trends, grid-waiting-list delays, GPU price erosion, and rack density shifts formed the key model variables. Multivariate regression, refreshed annually, projects each driver and feeds an ARIMA overlay for scenario checks before selective bottom-up cross-checks on flagship sites. Gaps where operator disclosures were thin were bridged by triangulating import values, tender awards, and expert guidance.
Data Validation & Update Cycle
Outputs pass an anomaly screen, peer review, and management sign-off. Models are rebuilt every twelve months, with interim refreshes when material events, grid policy changes or mega-campus approvals, occur.
Why Our United Kingdom Artificial Intelligence (AI) Optimised Data Center Baseline Is Trusted by Decision-Makers
Published estimates differ because firms choose dissimilar scopes, currencies, refresh cadences, and cost structures.
Key gap drivers include whether hyperscaler self-build capex is counted, how liquid-cooling retrofits are priced, the split between training and inference capacity, and the year in which grid-connection costs are booked. Mordor Intelligence applies one transparent scope, aligns all values to constant-2025 USD, and revisits variables each quarter, producing a balanced midpoint others rarely match.
Benchmark comparison
| Market Size | Anonymized source | Primary gap driver |
|---|---|---|
| USD 51.80 bn (2025) | Mordor Intelligence | - |
| USD 0.98 bn (2025) | Global Consultancy A | Excludes self-built hyperscale spend; limited primary validation |
| USD 0.73 bn (2024) | Industry Journal B | Narrow component list; relies on capacity x static ASP without grid-delay adjustment |
These contrasts show that Mordor's disciplined scope choice and variable tracking offer a dependable, reproducible baseline for investors planning long-term AI infrastructure bets.


Key Questions Answered in the Report
How large is the AI data center market in the United Kingdom in 2026?
The AI data center market size stands at USD 5.81 billion in 2026 and is forecast to grow at a 12.16% CAGR to 2031.
Which segment is growing fastest within United Kingdom AI facilities?
Colocation data centers lead growth with a projected 15.05% CAGR through 2031 as enterprises pursue hybrid AI deployment models.
What share do cloud providers currently hold?
Cloud Service Providers command 55.10% of AI data center market share as of 2025.
Which tier standard dominates new builds?
Tier IV facilities hold 61.10% share because mission-critical AI training workloads demand maximum uptime.
What is driving regional expansion beyond London?
Grid-connection bottlenecks and favorable renewable-energy access are pushing operators toward hubs in Manchester, Edinburgh, and Cardiff.
How are operators meeting sustainability mandates?
They sign 24/7 renewable PPAs, deploy liquid-cooling, and integrate heat-recovery systems to align AI workloads with clean-energy generation.
Page last updated on:


