Connected TV Market Size and Share
Market Overview
| Study Period | 2020 - 2031 |
|---|---|
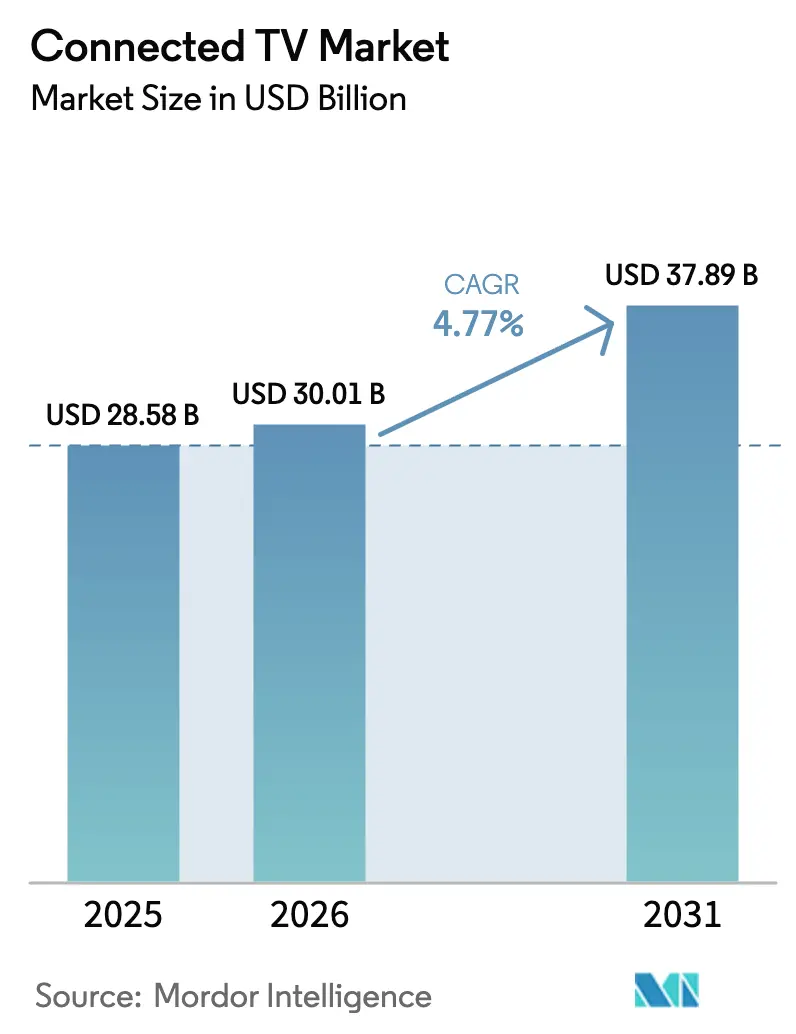
| Market Size (2026) | USD 30.01 Billion |
| Market Size (2031) | USD 37.89 Billion |
| Growth Rate (2026 - 2031) | 4.77% CAGR |
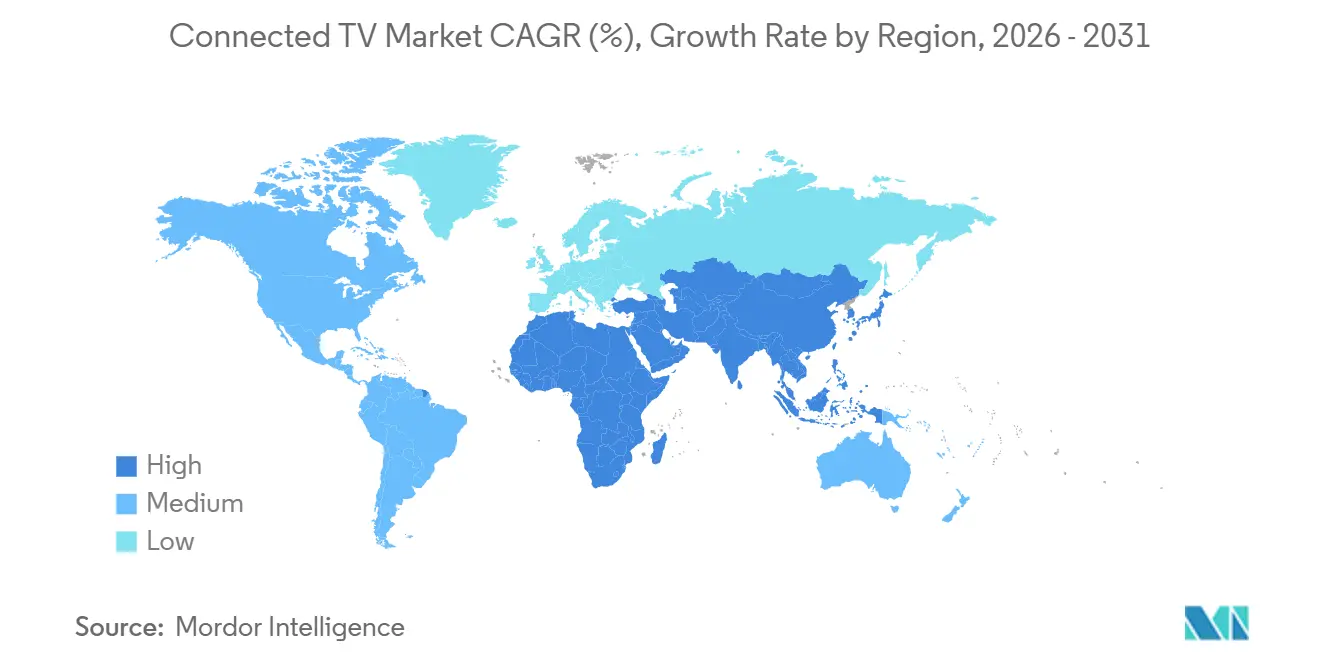
| Fastest Growing Market | Middle East and Africa |
| Largest Market | Asia Pacific |
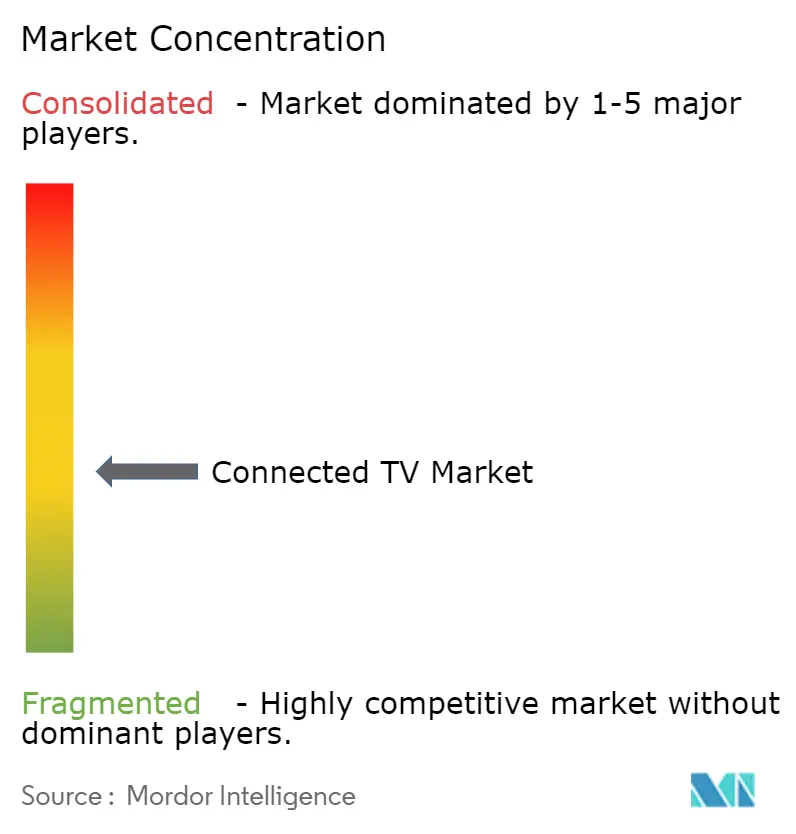
| Market Concentration | Medium |
Major Players *Disclaimer: Major Players sorted in no particular order Image © Mordor Intelligence. Reuse requires attribution under CC BY 4.0. | |
Connected TV Market Analysis by Mordor Intelligence
The Connected TV Market size is projected to expand from USD 28.58 billion in 2025 and USD 30.01 billion in 2026 to USD 37.89 billion by 2031, registering a CAGR of 4.77% between 2026 to 2031.
Growing free ad-supported streaming, operator-subsidized hardware, and on-device generative AI are widening the revenue base beyond unit sales, while cloud-rendered gaming and unified measurement frameworks unlock fresh advertising budgets. Asia Pacific dominates on shipment volume, North America leads in advertising yield, and the Middle East and Africa are pacing the fastest growth thanks to aggressive fiber rollouts. Hardware vendors increasingly subsidize entry price to capture post-sale advertising and subscription revenue, which encourages households to own multiple screens and shortens replacement cycles. Meanwhile, European energy rules and SoC shortages constrain 8K adoption and margin expansion.
Key Report Takeaways
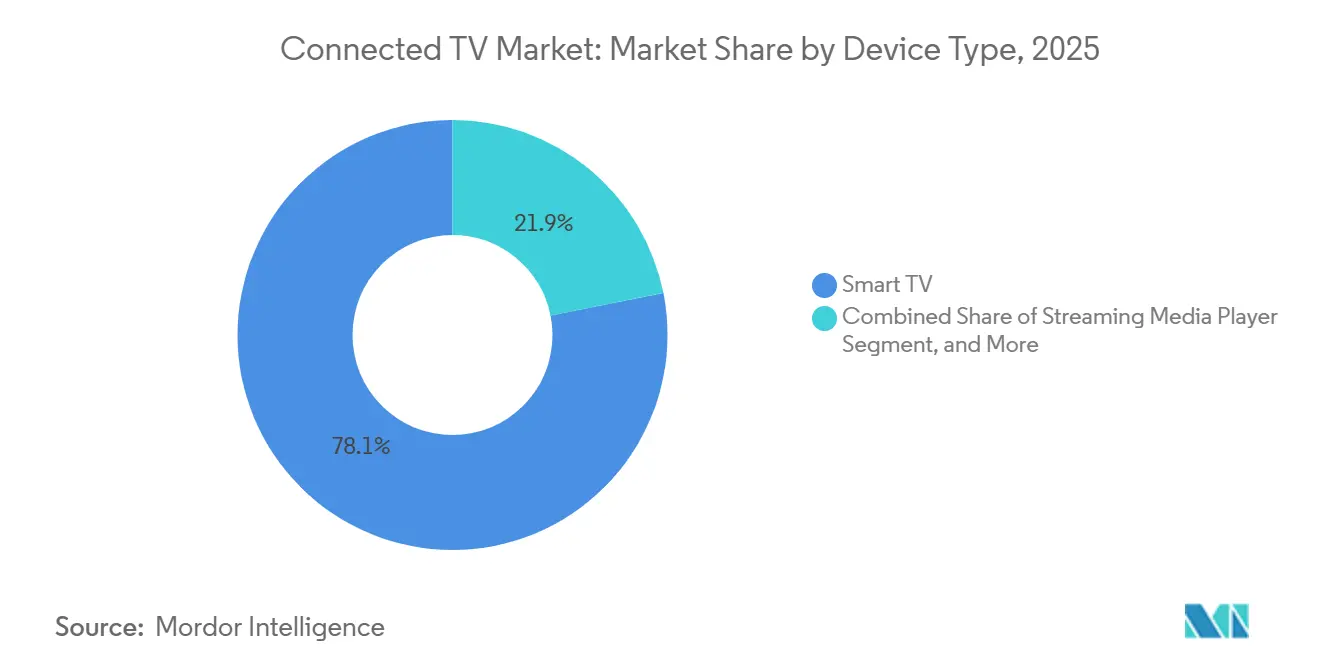
- By device, smart TVs held 78.12% of the connected TV market share in 2025, whereas streaming media players are projected to post a 5.12% CAGR through 2031.
- By operating system, Tizen commanded 21.43% revenue share in 2025, while Android TV and Google TV are expanding at a 5.89% CAGR to 2031.
- By screen size, the 46-55 inch category accounted for 32.16% of the connected TV market size in 2025, and panels above 66 inches are advancing at a 5.21% CAGR during the same window.
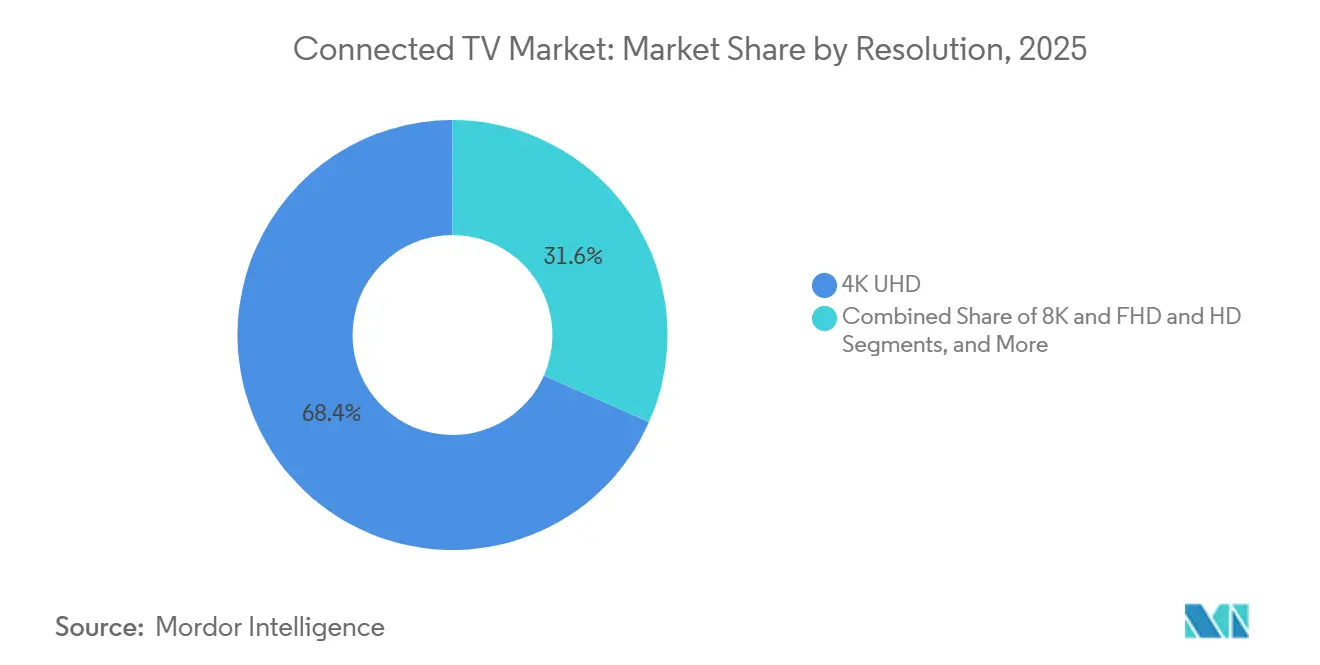
- By resolution, 4K UHD covered 68.37% share in 2025, whereas 8K models are pacing at a 5.56% CAGR despite regulatory headwinds.
- By panel technology, LED and Mini-LED captured 82.53% revenue share in 2025; RGB Mini-LED is forecast to expand at a 6.01% CAGR through 2031.
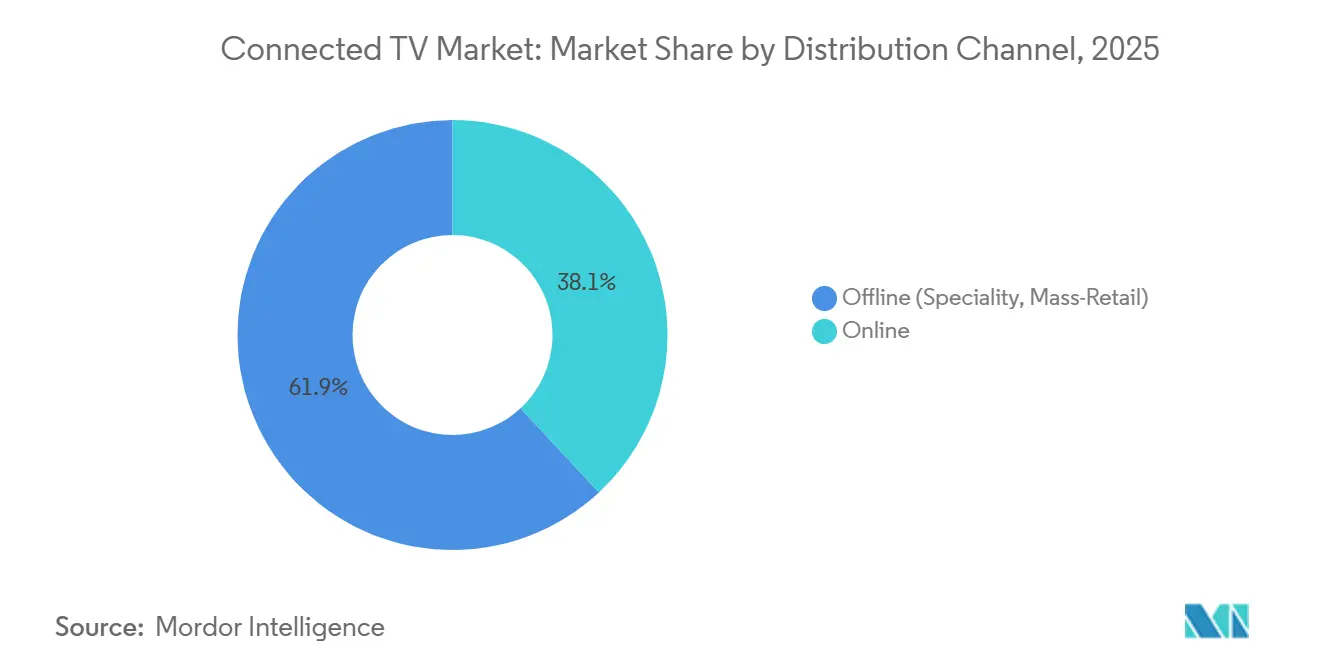
- By distribution channel, offline retail retained 61.92% share in 2025, but online sales are growing at a 5.92% CAGR as direct-to-consumer models compress mark-ups.
- By end use, residential installations led with 87.34% share in 2025, while commercial deployments are growing at a 5.33% CAGR on rising demand for hospitality and education displays.
- By geography, Asia Pacific dominated with a 44.53% share in 2025; the Middle East and Africa is poised to record the fastest 5.72% CAGR to 2031.
Note: Market size and forecast figures in this report are generated using Mordor Intelligence’s proprietary estimation framework, updated with the latest available data and insights as of January 2026.
Global Connected TV Market Trends and Insights
Drivers Impact Analysis*
| Driver | (~) % Impact on CAGR Forecast | Geographic Relevance | Impact Timeline |
|---|---|---|---|
| Proliferation of Ad-Supported FAST Channels Elevating ARPU in North America | +1.20% | North America, with spillover to Western Europe and Australia | Medium term (2-4 years) |
| Subsidised Operator-Bundled Smart TVs Accelerating First-Time Adoption in India and Indonesia | +0.90% | India, Indonesia, with emerging traction in Philippines and Vietnam | Short term (≤ 2 years) |
| On-Device GenAI Upscaling Spurs 4K Upgrade Cycle in China and South Korea | +0.80% | China, South Korea, Japan, with gradual adoption in North America and Europe | Medium term (2-4 years) |
| Household Fibre Roll-outs Above 100 Mbps Boosting UHD Streaming in Nordics | +0.60% | Nordic countries (Sweden, Finland, Norway, Denmark), expanding to Central Europe | Long term (≥ 4 years) |
| Advertising Measurement Standardisation (OpenAP, CFlight) Driving Brand Budgets to CTV in US | +0.70% | United States, with pilot programs in Canada and United Kingdom | Medium term (2-4 years) |
| Cloud-Rendered Gaming Partnerships Creating New Use-Cases | +0.50% | Global, with early adoption in North America, China, and South Korea | Long term (≥ 4 years) |
| Source: Mordor Intelligence | |||
Proliferation of Ad-Supported FAST Channels Elevating ARPU in North America
Free ad-supported streaming television generated USD 10.39 billion in 2025 as 96.4 million U.S. homes streamed 43% more hours than a year earlier. Advertisers pay premium CPMs for deterministic targeting, lifting average revenue per user faster than audience growth. Roku logged 35.4 billion platform hours that year, highlighting dwell-time advantages over short-form social video. FAST momentum incentivizes vendors to subsidize device prices, a model Amazon and Roku have proven at scale. Higher advertising yield therefore supports hardware penetration, deeper engagement, and recurring revenue all at once.[1]Comscore, “Connected TV Households and FAST Channel Revenue Data,” comscore.com
On-Device GenAI Upscaling Spurs 4K Upgrade Cycle in China and South Korea
Samsung and LG fitted 2025 smart-TV lineups with neural processors that upscale HD streams into near-4K images, eliminating cloud latency. MediaTek’s MT9638 chip pushed similar capability into mid-tier sets from TCL and Hisense, lowering the cost barrier for AI viewing. Chinese homes rich in legacy HD libraries now see tangible benefits in new 4K panels, while South Korean buyers view AI as futureproofing. Replacement cycles shortened from seven to five years in major metros, raising premium-tier volumes and ASPs.[2]Samsung, “Generative AI Upscaling and QD-OLED Technology,” samsung.com
Subsidised Operator-Bundled Smart TVs Accelerating First-Time Adoption in India and Indonesia
Reliance Jio, Airtel, Telkomsel, and the merged XL Axiata-Smartfren group treat the television as a customer-acquisition cost, bundling 43- and 55-inch sets with fiber plans. Hardware subsidies trim upfront price to zero, bringing millions of tier-2 and tier-3 households online for the first time. Integrated OTT packs remove app-discovery friction and stimulate higher broadband ARPU. The model is expanding across Southeast Asia as operators seek stickier contracts and cross-sell opportunities.[3]Reliance Jio, “JioTele OS Launch and Fiber-to-the-Home Bundles,” jio.com
Advertising Measurement Standardisation Driving Brand Budgets to CTV in United States
A Joint Industry Committee set baseline metrics in 2025, while OpenAP and CFlight delivered cross-platform reach and GRP translation tools. This common currency reassures buyers that connected TV impressions are comparable to linear spots, prompting reallocations of brand spend. The Interactive Advertising Bureau’s Conversions API further unifies post-impression attribution, enabling privacy-compliant outcome reporting. Standardisation thus feeds a virtuous cycle where larger ad pools finance richer content, lower device prices, and higher household penetration.
Restraints Impact Analysis*
| Restraint | (~) % Impact on CAGR Forecast | Geographic Relevance | Impact Timeline |
|---|---|---|---|
| Fragmented CTV OS Ecosystem Escalates App Porting and QA Costs for OTT Providers | -0.80% | Global, with acute impact on smaller OTT platforms lacking multi-OS development resources | Medium term (2-4 years) |
| Restrictive EU Energy-Efficiency Caps Curb 8K Panel Shipments | -0.50% | European Union, with potential spillover to markets adopting similar ecodesign standards | Long term (≥ 4 years) |
| Persistent Mid-Tier TV SoC Shortages Inflating BOM Costs | -0.60% | Global, with supply constraints concentrated in 28nm and 40nm process nodes | Short term (≤ 2 years) |
| Heightened Consumer Data-Privacy Scrutiny Limits Cross-Device Targeting | -0.40% | North America and Europe under GDPR and CCPA, with emerging regulations in Asia Pacific | Medium term (2-4 years) |
| Source: Mordor Intelligence | |||
Fragmented CTV OS Ecosystem Escalates App Porting and QA Costs for OTT Providers
OTT players juggle codebases for Tizen, Android TV, webOS, Roku OS, and Fire OS. Each platform demands its own SDK, certification, and regression testing cycle, stretching smaller teams. Pluto TV ceased support for older devices in late-2025, showing how fragmentation accelerates obsolescence. Platform-specific ad-tech implementations multiply costs, curbing the long-tail of niche services and concentrating power with incumbents that can shoulder multi-OS development burdens.
Restrictive EU Energy-Efficiency Caps Curb 8K Panel Shipments
The European Union’s Ecodesign Regulation 2019/2024 sets tight on-mode wattage ceilings that current 8K sets seldom meet. Samsung and LG, therefore, limited European 8K launches to sub-75-inch models or lowered brightness to comply, fragmenting global SKU strategies. Lower efficiency labels deter eco-conscious shoppers and shrink economies of scale, slowing 8K cost decline until lower-power Mini-LED and Micro-LED backlighting matures.
*Our forecasts treat driver/restraint impacts as directional, not additive. The impact forecasts reflect baseline growth, mix effects, and variable interactions.
Segment Analysis
By Device: Streaming Media Players Outgrow Embedded Screens
Streaming dongles and boxes claim a faster 5.12% CAGR through 2031 while smart TVs still hold a dominant 78.12% unit share. The connected TV market size for streaming players benefits from households adding cheap dongles to legacy panels and from cord-cutters whose embedded storage or OS age out. Amazon has sold more than 300 million Fire TV devices, recently refreshing UI with Alexa+ generative AI for conversational discovery. Roku OS, topping sales in United States, Canada, and Mexico in early 2025, straddles both embedded and external profiles, helping the connected TV market expand without waiting for full-set replacement.
Gaming-centric buyers favour consoles or TVs with integrated cloud-gaming clients. Microsoft broadened Xbox Cloud Gaming to LG sets in 2025, and TCL introduced X11L with native 144 Hz cloud-gaming support in 2026. While consoles remain niche, their presence extends session length and lifts premium-tier ASPs, cushioning vendor margins even when entry hardware is heavily subsidized.


By Operating System: Android TV and Google TV Narrow the Gap
Android TV and Google TV are on the rise, boasting a 5.89% CAGR during 2026 to 2031. This shift comes as manufacturers pivot from proprietary systems, seeking access to Google Play and the advantages of Gemini AI. With the introduction of mandatory Android TV OS 10+ specifications, performance and longevity have seen marked improvements, effectively tackling past fragmentation issues. These advancements have made Android TV and Google TV increasingly attractive to manufacturers aiming to deliver consistent and high-performing user experiences.
The growing adoption of these platforms highlights the industry's focus on standardization and enhanced functionality to meet evolving consumer expectations. Both webOS and Roku OS, each capturing a mid-single-digit share, focus on delivering an intuitive user interface and maximizing ad revenues. Amazon's Fire OS, a derivative of Android, powers both Amazon's streaming sticks and select third-party devices, with a clear emphasis on advertising monetization. Notably, smaller brands are increasingly leaning towards Roku OS or Fire OS, sidestepping the need for in-house software development. This trend is gaining momentum in emerging markets, where rapid market entry is prioritized over extensive product differentiation. The preference for these platforms among smaller brands underscores the importance of cost efficiency and faster time-to-market in competitive and resource-constrained environments.
By Screen Size: Big Screens Command the Premium
As living rooms evolve and 100-inch class prices decline, panels exceeding 66 inches are witnessing a 5.21% CAGR. Omdia forecasts an increase in units of 80 inches and above, projecting 13 million by 2029, a rise from 9 million in 2025. This growth is driven by consumer demand for larger screens that enhance the viewing experience, particularly in home entertainment setups. In 2025, Samsung, Hisense, and TCL introduced 115-inch models, targeting both home-theater enthusiasts and commercial venues that previously relied on projectors. These larger screens are increasingly appealing to consumers seeking immersive experiences and businesses aiming to upgrade their display solutions. The 46–55-inch segment, commanding a 32.16% share in 2025, continues to dominate, striking a balance between price and viewing distance.
The 46–55-inch segment remains popular among households due to its affordability and suitability for average living room dimensions. Meanwhile, with improving yields, 65-inch sets are increasingly being offered at entry-level prices, encouraging households to upgrade to larger screens. Sub-32-inch screens, on the other hand, maintain their presence in kitchens, bedrooms, and hospitality settings, where space and budget limitations dictate size. These smaller screens cater to niche applications, ensuring their relevance in specific use cases despite the growing preference for larger displays.
By Resolution: 4K Retains Mass Appeal While 8K Waits
4K UHD captured 68.37% of 2025 shipments and is expected to preserve its lead as panel cost converges with full-HD for screens 50 inches and larger. Generative AI upscaling embedded in Samsung, LG, and MediaTek chipsets makes compressed HD streams look sharper, so households with sub-100 Mbps broadband can still enjoy near-4K images. That technical bridge accelerates upgrades in bandwidth-constrained regions and extends the life of older content libraries. At the premium edge, 8K models ship at a 5.56% CAGR, but true demand hinges on native video pipelines, live sports trials, and energy-efficient backlighting that can satisfy European Ecodesign limits without dimming brightness.
Momentum for 8K is stronger in Asia Pacific and North America, where early adopters view the format as long-term futureproofing and can afford electricity costs outside the European Union’s caps. Panel makers court this niche with 75-inch plus screens bundled with cloud-gaming and AI services that justify higher ASPs. Meanwhile, full-HD and HD sets persist in operator-subsidized bundles across India, Indonesia, and other price-sensitive markets, where lowering upfront cost outweighs resolution gains. As fiber penetration expands and compression codecs such as AV1 and VVC mature, the step from 4K to 8K will depend less on bandwidth ceilings and more on whether content owners can fill the pipeline with differentiated ultra-high-resolution programming.
By Panel Technology: Mini-LED Challenges OLED Margins
LED and Mini-LED panels together accounted for 82.53% of 2025 volume, benefiting from mature supply chains and a 30-40% cost edge over OLED equivalents. RGB Mini-LED backlights add thousands of local dimming zones, closing the contrast gap with organic panels and driving a forecast 6.01% CAGR for the technology. Samsung’s QD-OLED and LG Display’s OLED.EX lines respond with higher peak brightness and longer lifespan, while TCL’s USD 4.1 billion Guangzhou fab aims to scale OLED output and compress price premiums even further. In the mid-tier, QLED keeps costs down by layering quantum dots over standard LED, offering wider color gamut without the structural expense of self-emissive pixels.
The strategic battleground now shifts to value-added processing rather than raw panel type. Sony leans on cognitive processors for superior motion handling and AI upscaling, offsetting lower unit share with elevated ASPs. TCL and Hisense tap Mini-LED to gain credibility in the premium tier, bundling large screens with 144 Hz refresh rates targeted at cloud-gaming audiences. Supply constraints on Mini-LED backlights have eased as chip-on-board packaging scales, but OLED material costs remain tied to iridium and other scarce metals, limiting rapid price decline. Over the forecast period, competitive positioning will hinge on balancing bill-of-materials savings against consumer willingness to pay for thinner profiles, perfect blacks, and burn-in assurances.
By Distribution Channel: Online Gains From Direct-to-Consumer Economics
Offline retail still held 61.92% share in 2025, fueled by hands-on demonstration, same-day pickup, and value-added installation services. Big-box chains used door-buster TV deals during holiday periods to drive foot traffic, while specialty stores bundled wall-mounting and calibration to preserve premium pricing. In emerging markets, durable relationships with neighborhood dealers and installment-payment schemes keep physical channels relevant, especially for first-time buyers wary of shipping damage on large screens. At the same time, omnichannel concepts, such as order online, collect in store, blur the boundary, letting brands satisfy consumers who research digitally but prefer local pickup.
E-commerce grows at a 5.92% CAGR as direct-to-consumer brands sidestep 15-20% retail mark-ups and harvest first-party data. Amazon’s Ember Artline launch at USD 899 showcases agile pricing that can adjust hourly to competitor moves, inventory levels, or advertising demand. Pure-play online sellers also leverage flash sales and influencer live-streams to spur impulse buys in younger demographics. Logistical hurdles around 75-inch plus sets are easing through white-glove networks that schedule delivery and wall-mounting within 48 hours, shrinking a service gap once owned by brick-and-mortar. As return policies liberalize and augmented-reality apps help consumers visualize screen sizes in their rooms, the swing toward digital storefronts is likely to accelerate even for premium ticket items.
By End-Use: Commercial Settings Catch Up
Residential installations represented 87.34% of 2025 units, driven by multi-TV households where living-room anchors average 55-65 inches and secondary rooms rely on sub-43-inch sets. Replacement cycles shortened from seven to five years in high-income markets as generative AI, gaming integrations, and ad-subsidized pricing encouraged earlier upgrades. Increased cord-cutting prompts consumers to add streaming sticks or buy new smart TVs rather than pay for set-top boxes, keeping the connected device count rising even as total viewing minutes flatten. As subscription fatigue pushes viewers toward free ad-supported channels, households perceive value in displays offering robust operating-system support and long-term firmware updates.
Commercial deployments, forecast to expand at a 5.33% CAGR, are moving beyond traditional hotel room screens. Hospitality chains now require casting capability and property-management integration to cut in-room pay-per-view churn and lower call-center costs. Schools and universities adopt interactive flat panels that merge whiteboard, videoconference, and learning-management functions, extending display size to 86 inches in lecture halls. Corporate lobbies favor bezel-less 4K video walls for branding and wayfinding, while retailers shift to centrally managed digital signage that updates promotions in minutes rather than days. Although commercial buyers refresh hardware less often than consumers, they pay higher ASPs for ruggedized components, on-site warranties, and remote management suites, which collectively raise vendor margin even on lower unit volumes.
Geography Analysis
Asia Pacific owned 44.53% market share in 2025 thanks to China’s output scale, India’s operator subsidies, and South Korea’s premium leadership. Chinese brands such as Xiaomi, Haier, and TCL priced aggressively at home while exporting to stabilize factory loads. Reliance Jio and Airtel’s bundles drove penetration beyond tier-1 cities in India. South Korea commanded outsized OLED and QLED revenue through proprietary panels and operating systems.
The Middle East and Africa is set for the fastest 5.72% CAGR as United Arab Emirates and Saudi Arabia fibre rollouts remove bandwidth bottlenecks. Government broadband initiatives under Saudi Vision 2030 stimulate UHD streaming and large-screen uptake. North America stays high value due to advertising yield. Comscore counted 96.4 million connected-TV households in 2025, and OpenAP plus CFlight now let advertisers buy across platforms with de-duplicated reach metrics, moving budgets from linear TV.
Europe grapples with strict energy rules throttling 8K and ultra-bright panels. Yet Nordic nations, with fiber penetration above 90% in Sweden and strong streaming subscriptions across Norway, Sweden, and Denmark, enjoy robust UHD take-up. South America and Africa remain entry-level smart-TV territories. Urbanization and mobile-broadband expansion open opportunities, but price sensitivity and weaker distribution limit premium penetration for now.

Competitive Landscape
In 2025, Samsung, LG, TCL, and Hisense collectively accounted for just over 50% of unit shipments, highlighting a moderate market concentration. This indicates that while the market is not highly fragmented, it is also not dominated by a single player, leaving room for competitive dynamics. Meanwhile, platform giants like Amazon, Roku, and Google are shifting the competitive landscape. By focusing on post-sale monetization, these platforms are subsidizing hardware, thereby expanding their advertising reach and creating new revenue streams. Samsung and LG are using their proprietary systems, Tizen and webOS, to bolster their device economics and maintain control over their ecosystems. In contrast, TCL and Hisense are opting for quicker market entry by licensing Roku OS and Fire OS, which allows them to focus on scaling their hardware production and distribution.
Direct-to-consumer players, such as Amazon's Ember Artline, are undercutting traditional retail mark-ups, disrupting established pricing models and forcing competitors to rethink their strategies. Furthermore, partnerships with cloud-gaming leaders like Microsoft, Nvidia, and Amazon Luna are not only extending gaming sessions but also validating the need for premium specifications. These alliances are driving demand for high-performance devices, as consumers increasingly seek seamless gaming experiences. In 2025, a shortage of mid-tier SoCs, particularly in the 28-40 nm range, tightened profit margins. This supply chain constraint compelled smaller brands to either absorb the heightened costs, which impacted their profitability, or withdraw from the mid-price segment, reducing competition in this category.
On another front, privacy regulations like GDPR and CCPA are amplifying compliance costs. This dynamic not only fortifies the position of larger platforms, which have the resources to manage these requirements, but also deters smaller ad-tech newcomers from entering the market. As a result, the significance of first-party data and on-device processing has surged, as companies aim to mitigate regulatory risks while enhancing user privacy and data security.
Connected TV Industry Leaders
Samsung Corporation
LG Electronics
Hisense
TCL
Sony Corporation
- *Disclaimer: Major Players sorted in no particular order

Recent Industry Developments
- May 2025: StackAdapt extended its Samba TV alliance to Australia, giving buyers richer audience insights for regional Connected TV campaigns.
- May 2025: Samba TV partnered with IRIS.TV to enable privacy-compliant contextual targeting across 55 million video assets using Samba AI.
- February 2025: Mediaocean completed its Innovid acquisition, integrating it with Flashtalking to create an omnichannel ad-tech suite spanning linear and Connected TV.
- January 2025: TCL released QM6K mini-LED TVs featuring a Super High Energy backlight chip that lifts brightness 53% on 50- to 98-inch models.
- January 2025: LG introduced a four-stack OLED panel boosting brightness three-fold and enabling 165 Hz refresh on webOS 25 sets up to 83 inches.


Research Methodology Framework and Report Scope
Market Definitions and Key Coverage
According to Mordor Intelligence, the connected-TV market covers every television or plug-in device that ships from an original equipment factory with in-built internet capability, is able to run streaming applications natively, and can be updated over-the-air. This spans smart-TV sets, streaming media players, and current-generation game consoles that double as streaming hubs, valued at ex-factory hardware revenues only.
Scope exclusion: Subscription fees, advertising revenue, replacement remote controls, and legacy flat-panel sets that need external dongles are not part of our sizing.
Segmentation Overview
- By Device
- Smart TV
- 4K and UHD Smart TV
- 8K Smart TV
- HD/FHD Smart TV
- Streaming Media Player
- Gaming Console (Streaming Enabled)
- Smart TV
- By Operating System
- Android TV / Google TV
- Tizen
- webOS
- Roku OS
- Fire OS
- By Screen Size
- Up to 32 inch
- 33-45 inch
- 46-55 inch
- 56-65 inch
- Above 66 inch
- By Resolution
- 4K UHD
- 8K
- FHD and HD
- By Panel Technology
- LED / Mini-LED
- OLED
- QLED
- By Distribution Channel
- Online
- Offline (Speciality, Mass-Retail)
- By End-Use
- Residential
- Commercial (Hospitality, Education, Corp-Lobby, Digital-Signage)
- Geography
- North America
- United States
- Canada
- Mexico
- Europe
- Germany
- United Kingdom
- France
- Italy
- Spain
- Rest of Europe
- Asia Pacific
- China
- Japan
- South Korea
- India
- South East Asia
- Australia
- Rest of Asia Pacific
- South America
- Brazil
- Rest of South America
- Middle East
- United Arab Emirates
- Saudi Arabia
- Rest of Middle East
- Africa
- South Africa
- Rest of Africa
- North America
Detailed Research Methodology and Data Validation
Primary Research
We interviewed chipset vendors, panel suppliers, regional distributors, and large multi-country retailers across North America, Europe, and Asia Pacific. These conversations helped us stress-test assumed sell-in versus sell-through ratios, clarify BOM cost shifts, and obtain forward views on promotional ASP cuts around major sporting events.
Desk Research
Our analysts began with public data from organizations such as the International Telecommunication Union, OECD broadband statistics, China Customs export dockets, and HDMI adopter shipments, which together reveal device flows and connectivity ratios. Industry associations like the Consumer Technology Association and Japan Electronics and Information Technology Industries Association supply quarterly unit shipments and average selling prices, while patent families pulled from Questel hint at future SoC and panel innovations.
To validate pricing and mix, we reviewed 10-K filings of leading TV makers, global retail scanner data, and product catalogs scraped every quarter. Supplementary depth came from paid databases including D&B Hoovers for OEM financials and Dow Jones Factiva for contract news on FAST-channel integrations. The sources listed illustrate our desk work; many additional references were tapped to round out numbers and definitions.
Market-Sizing & Forecasting
We build a top-down model that begins with global flat-panel production, subtracts non-connected units, and then reconstructs regional demand pools through broadband household penetration and smart-TV attachment rates. Supplier roll-ups of sampled ASP × volume plus retail channel checks serve as a selective bottom-up lens to fine-tune totals. Key variables include LCD and OLED panel yields, broadband subscriptions, median TV screen size migration, SoC connectivity attach rates, energy-efficiency regulations affecting 8 K sets, and promotional discount depth. A multivariate regression links these drivers to annual unit uptake before an ARIMA overlay projects five-year trends. Data gaps in country splits are bridged with weighted proxies from import records and operator shipment disclosures.
Data Validation & Update Cycle
Outputs pass three rounds of analyst review, variance checks against independent shipment trackers, and anomaly flags. Reports refresh each year, and interim updates fire when panel tariffs, major component shortages, or regulatory shifts move the baseline. A last-mile review is completed just before client delivery.
Why Mordor's Connected TV Baseline earns trust
Published estimates often differ because firms choose unlike scopes, input series, and refresh cadences.
Key gap drivers include whether advertising and content revenues are blended with hardware value, the choice of retail versus factory pricing, and how non-streaming flat panels are filtered. Our study keeps a strict hardware-only lens and applies annual ASP audits, while some external publishers lift figures from broader entertainment datasets or average multi-year currency conversions.
Benchmark comparison
| Market Size | Anonymized source | Primary gap driver |
|---|---|---|
| USD 10.39 B (2025) | Mordor Intelligence | - |
| USD 290.54 B (2025) | Global Consultancy A | Blends content and ad revenue, uses retail prices without currency normalization |
| USD 93.30 B (2025) | Industry Journal B | Includes all internet-enabled flat panels, limited device-level deducts |
| USD 2.60 B (2024) | Regional Consultancy C | Narrows scope to streaming dongles only, omits smart-TV shipments |
These contrasts show why decision-makers lean on Mordor's disciplined variable selection, single-source gap checks, and annual refresh, giving them a balanced, transparent baseline that can be retraced and replicated by any diligent analyst.


Key Questions Answered in the Report
How large is the connected TV market in 2026 and where is it heading by 2031?
The connected TV market size reached USD 30.01 billion in 2026 and is projected to reach USD 37.89 billion by 2031, expanding at a 4.77% CAGR.
Which device segment is growing faster than overall market demand?
Streaming media players are projected to grow at a 5.12% CAGR through 2031, outpacing integrated smart TVs.
What geography is expected to log the fastest growth through 2031?
The Middle East and Africa is forecast to record a 5.72% CAGR, driven by fiber roll-outs in United Arab Emirates and Saudi Arabia.
How do advertising-supported FAST channels influence hardware pricing?
Rising advertising revenue per user lets platform owners subsidize device prices, reducing upfront cost to households and boosting penetration.
Why is 8K adoption slower in Europe than in Asia Pacific?
European Union energy-efficiency caps restrict on-mode power, limiting 8K screen availability and deterring buyers despite falling panel costs.
Which operating system is gaining on Tizens lead?
Android TV and Google TV are growing at a 5.89% CAGR as manufacturers seek Google Play access and Gemini AI features.
Page last updated on:


