Video Wall Market Size and Share
Market Overview
| Study Period | 2020 - 2031 |
|---|---|
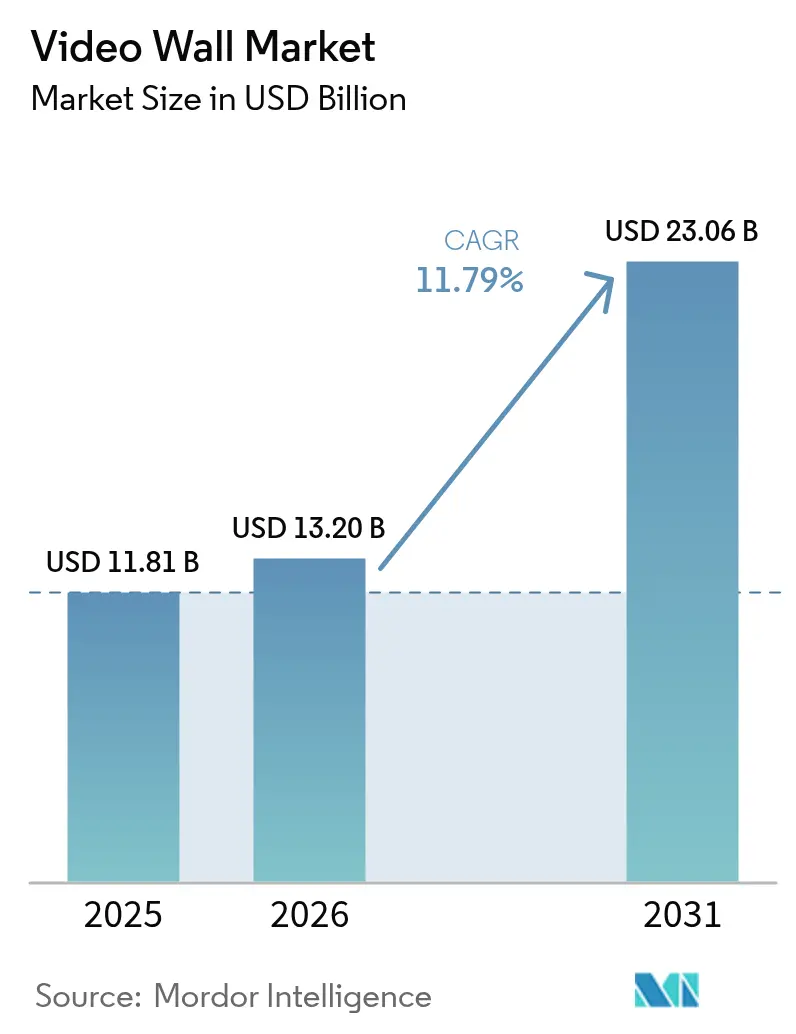
| Market Size (2026) | USD 13.2 Billion |
| Market Size (2031) | USD 23.06 Billion |
| Growth Rate (2026 - 2031) | 11.79% CAGR |
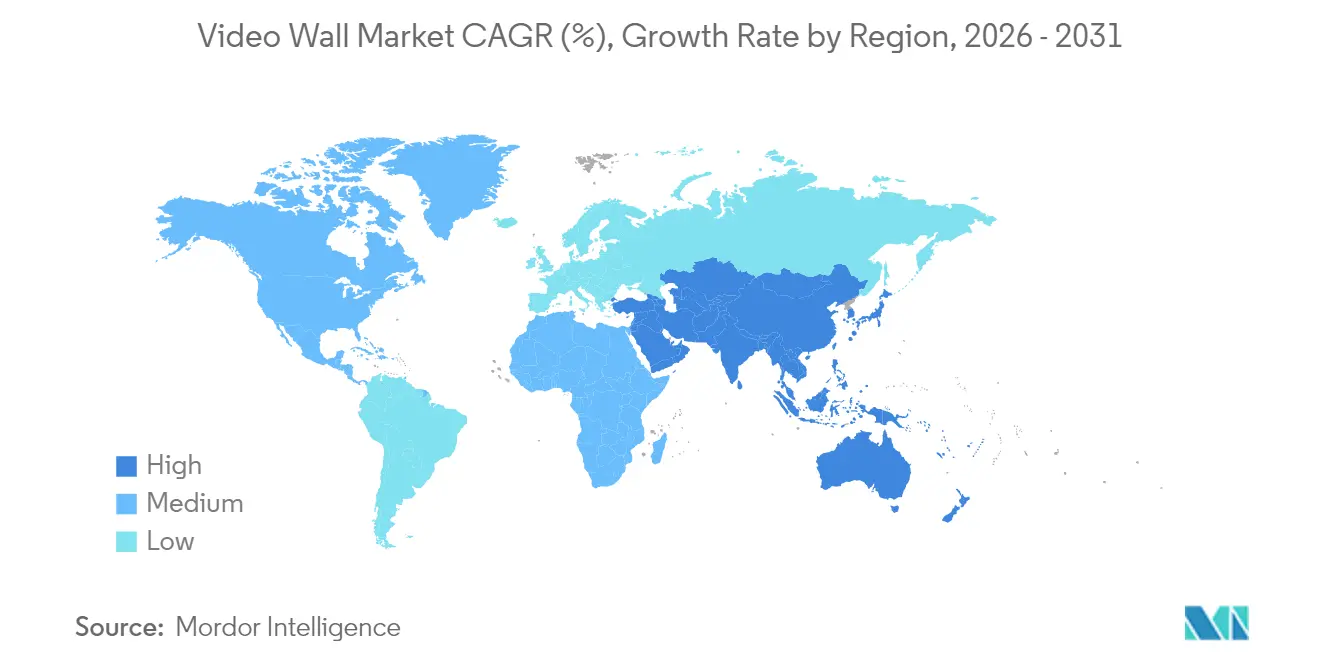
| Fastest Growing Market | Middle East |
| Largest Market | Asia Pacific |
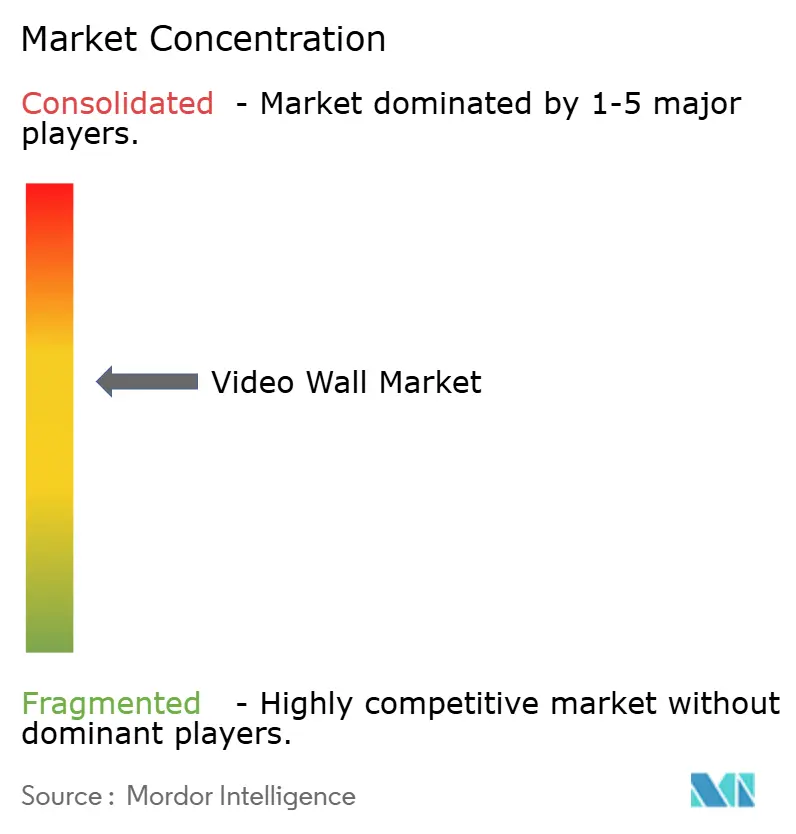
| Market Concentration | Medium |
Major Players *Disclaimer: Major Players sorted in no particular order Image © Mordor Intelligence. Reuse requires attribution under CC BY 4.0. | |
Video Wall Market Analysis by Mordor Intelligence
The video wall market size was valued at USD 11.81 billion in 2025 and estimated to grow from USD 13.2 billion in 2026 to reach USD 23.06 billion by 2031, at a CAGR of 11.79% during the forecast period (2026-2031). Strong capital shifts from static signage toward dynamic, data-rich arrays are accelerating adoption, helped by falling LED pixel pitches, the commercial roll-out of MicroLED, and updated energy-efficiency rules that favor solid-state displays. Transportation hubs across Asia-Pacific and the Middle East are replacing printed boards with direct-view screens that merge way-finding and advertising, while North American and European command centers are retiring front-projection cubes in favor of LED walls that deliver tighter brightness uniformity and lower service overheads. On the supply side, Chinese manufacturers are integrating chip production to offset component volatility, and global brands are bundling hardware with predictive-maintenance software to lock in multiyear service revenue. Cost, power consumption, and tightening light-pollution ordinances remain friction points, yet operators are lengthening refresh cycles rather than cancelling projects outright.
Key Report Takeaways
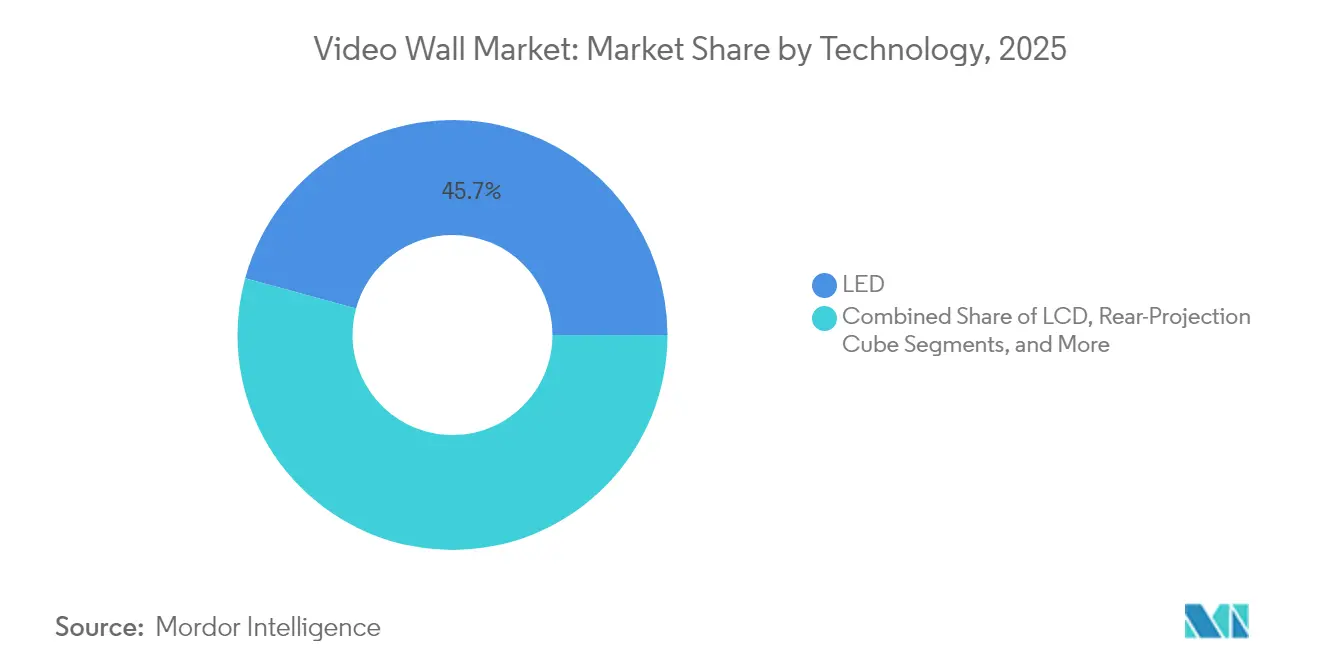
- By technology, LED captured 45.74% of 2025 revenue, while MicroLED is forecast to expand at a 26.11% CAGR to 2031.
- By end-user, transportation led with 28.22% of 2025 share, whereas hospitality and entertainment is expected to grow at a 20.29% CAGR through 2031.
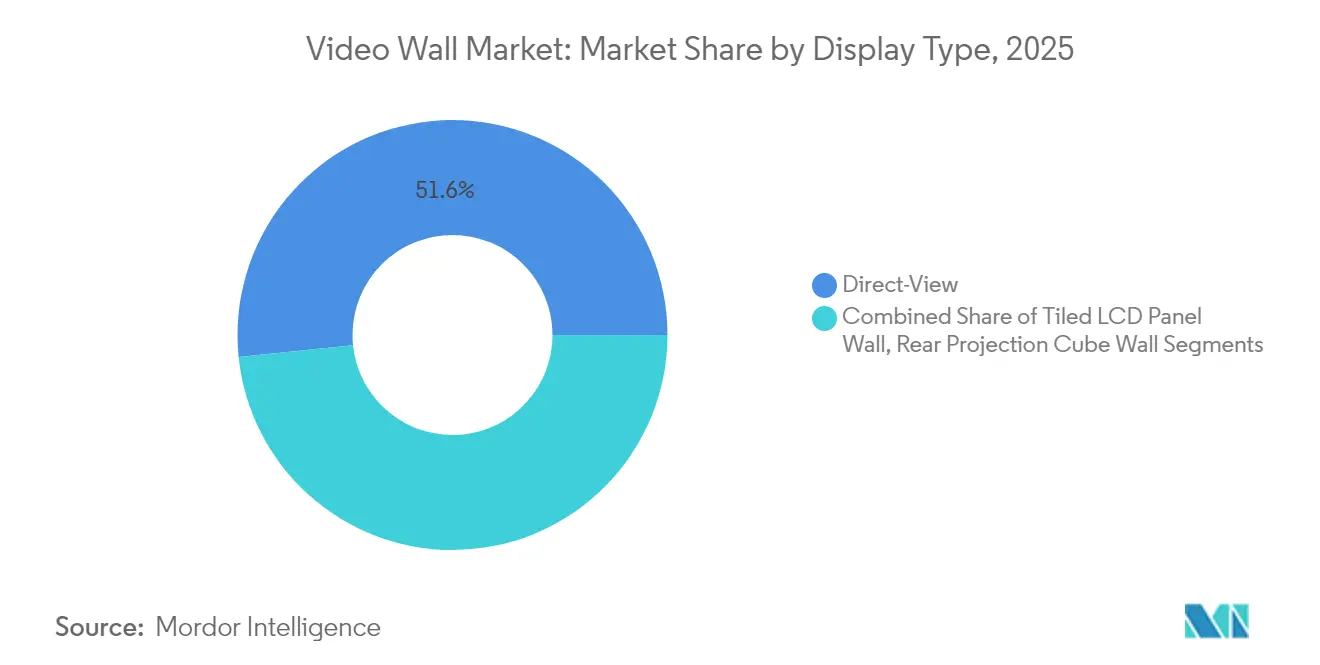
- By display type, direct-view systems held 51.63% of the 2025 base and are projected to rise at a 23.42% CAGR to 2031.
- By installation location, indoor deployments accounted for 60.78% of 2025 revenue; outdoor deployments are expected to advance at a 16.92% CAGR, driven by smart-city rollouts across the Asia-Pacific and the Gulf.
- By geography, the Asia-Pacific region held 37.92% of the 2025 revenue, and the Middle East is poised for a 13.72% CAGR through 2031, driven by mega-projects in Saudi Arabia and the UAE.
Note: Market size and forecast figures in this report are generated using Mordor Intelligence’s proprietary estimation framework, updated with the latest available data and insights as of 2026.
Global Video Wall Market Trends and Insights
Drivers Impact Analysis*
| Driver | (~) % Impact on CAGR Forecast | Geographic Relevance | Impact Timeline |
|---|---|---|---|
| Growing Adoption of LED Video Walls in Transportation Hubs | +2.3% | Asia-Pacific core, spillover to Middle East and North America | Medium term (2-4 years) |
| Increasing Demand for Digital Signage in Retail Environments | +1.8% | Global, concentration in North America and Europe | Short term (≤ 2 years) |
| Advancements in Narrow-Bezel LCD Panels | +1.2% | North America and Europe, gradual uptake in Asia-Pacific | Medium term (2-4 years) |
| Emergence of MicroLED Video Wall Solutions | +2.7% | Global, early traction in corporate and entertainment venues | Long term (≥ 4 years) |
| Integration with Command-Center Visualization Platforms | +1.5% | North America and Europe, expanding to Asia-Pacific utilities | Medium term (2-4 years) |
| Expansion of Immersive Venues and eSports Arenas | +2.1% | Global hotspots in China, South Korea, United States | Short term (≤ 2 years) |
| Source: Mordor Intelligence | |||
Emergence of MicroLED Video Wall Solutions
MicroLED brings per-pixel dimming and contrast ratios beyond 1,000,000:1, attributes now written into RFPs for broadcast studios and luxury retail. Samsung’s The Wall and LG’s MAGNIT, commercialized in 2024, eliminate the organic layers found in OLED, extending lifespans beyond 100,000 hours and removing burn-in risk. Sony’s Crystal LED installation in Tokyo in early 2025 adds AI-based color calibration that adjusts output regardless of ambient changes. Taiwan-based foundries are shifting to 8-inch sapphire to lift yields and compress pricing, enabling the 27.47% forecast growth. Compliance with IEC 62341 photobiological safety norms is now mandatory in many public installations.
Growing Adoption of LED Video Walls in Transportation Hubs
Airport and metro operators are turning dwell time into revenue by streaming dynamic ads alongside real-time flight or platform data. Edinburgh Airport’s 12-meter curved LED wall and Kansas City’s new terminal’s 18 direct-view displays both went live in 2024. Incheon Airport’s 24-meter ribbon integrates facial-recognition triggers to personalize content, drawing privacy scrutiny from EU regulators. The 2.3% growth lift arises because these 24/7 facilities lock in 10-year service contracts that assure recurring revenue.
Integration with Command-Center Visualization Platforms
Public-safety and utility agencies are swapping rear-projection cubes for LED walls tied directly to GIS, SCADA, and video-management feeds. Barco’s Overture in London’s Metropolitan Police command hub runs 8K across an 18-panel grid and has cut incident-response times by 18%. Christie Digital’s 4K wall at New York’s system operator merges live grid load and weather overlays, avoiding two brownouts during the 2024 heat wave. Replacement cycles of earlier-generation cubes installed from 2012-2016 underpin a predictable upgrade wave peaking between 2025-2027.
Expansion of Immersive Venues and eSports Arenas
Operators monetize immersive environments through premium tickets and sponsorships. ROE Visual’s 360-degree ribbon at Esports Stadium Arlington generated USD 2.4 million in first-year sponsorships. Resorts World Las Vegas’ 100,000 square-foot LED ceiling shifted daylight skies to night shows, lifting average guest dwell time by 22 minutes. The hospitality and entertainment vertical’s 20.81% CAGR outpaces all others because display-driven experiences yield direct revenue.
Restraints Impact Analysis*
| Restraint | (~) % Impact on CAGR Forecast | Geographic Relevance | Impact Timeline |
|---|---|---|---|
| High Initial Investment and Total Cost of Ownership | -1.9% | Global, most acute in South America and Africa | Short term (≤ 2 years) |
| Significant Heat and Power Consumption | -1.3% | Middle East and tropical Asia-Pacific, secondary impact in North America | Medium term (2-4 years) |
| Supply-Chain Volatility for Mini-LED and ICs | -1.1% | Global, acute shortages affecting Asia-Pacific manufacturers | Short term (≤ 2 years) |
| Outdoor Light-Pollution Regulations | -0.8% | Europe and selected North American cities, emerging rules in Asia-Pacific | Long term (≥ 4 years) |
| Source: Mordor Intelligence | |||
High Initial Investment and Total Cost of Ownership
Premium MicroLED arrays can top USD 5,000 per square meter, pushing education and municipal buyers toward lower-resolution LCD alternatives. Five-year ownership studies by several airport operators in 2024 show LED walls costing roughly USD 320,000 for a 20-panel build versus USD 180,000 for tiled LCD, though the gap narrows once longer LED lifespans and lower failure rates are factored. To maintain budgets, corporate customers are bundling hardware, installation, and maintenance into fixed monthly fees that place component-failure risk on vendors. Currency swings and tariffs inflate landed costs by up to 50% in South America and Africa, making leasing the primary adoption path.
Outdoor Light-Pollution Regulations in Major Urban Centers
Paris now requires brightness cuts of 50% after 23:00 and full shutdowns from 01:00–06:00, trimming impressions by 18% in early 2024.[1]French Ministry of Ecological Transition, “Outdoor Display Brightness Rules,” ecologie.gouv.fr The United Kingdom recommends capping brightness at 400 cd/m² near residences. Because outdoor displays deliver high revenue per square meter, mandatory dimming systems and curfews shave 0.8% off forecast growth yet spur demand for adaptive-brightness controllers.
*Our forecasts treat driver/restraint impacts as directional, not additive. The impact forecasts reflect baseline growth, mix effects, and variable interactions.
Segment Analysis
By Technology: MicroLED Ascends as Premium Tier Consolidates
LED retained 45.74% of 2025 revenue, anchoring the video wall market thanks to sub-1.2-millimeter pixel pitches that ensure seamless imagery at close range. MicroLED is set to expand at a 26.11% CAGR through 2031 as luxury retail, broadcast, and corporate lobby buyers favor its near-infinite contrast and 100,000-hour lifespan. LCD, while benefiting from bezels under 1 millimeter, is ceding high-profile projects because brightness uniformity degrades faster in 24/7 service. Rear-projection cubes continue to exit control-room specifications as LED eliminates lamp replacements and simplifies scaling.
Manufacturers are vertically integrating chip lines to secure gallium-nitride wafers and blunt pricing swings that rattled Mini-LED in 2024. Sony’s April 2024 decision to bring MicroLED fabrication in-house illustrates a broader pivot among premium brands toward end-to-end control. LCD still appeals in budget-sensitive education and secondary control rooms where capital savings exceed 40% versus LED.


By End-User: Transportation Leads Share, Entertainment Leads Growth
Transportation held 28.22% of 2025 revenue in the video wall market, driven by terminal-wide upgrades that combine flight data and advertising. Hospitality and entertainment is forecast to grow at 20.29% CAGR, fueled by venues that monetize immersive environments via sponsorships. Retail remains sizable yet slower as chains prioritize e-commerce infrastructure, deferring secondary-store upgrades. Corporate adopters equip hybrid meeting spaces with narrow-bezel walls that align video conferencing with in-person presence, leaning toward LCD for cost reasons.
Government and utilities progress steadily but are bound by multi-year procurement cycles, while education and healthcare demand turnkey bundles with training and software included. Accessibility features, including embedded text-to-speech, are now standard to satisfy ADA requirements.
By Display Type: Direct-View Dominance Reflects Bezel Innovation
Direct-view systems held 51.63% of 2025 installations and are projected to climb at a 23.42% CAGR as bezels shrink below 0.5 millimeters and seams disappear. LCD walls retain traction where viewing distances exceed 5 meters and ambient light is controlled. Rear-projection cubes, once standard in control rooms, survive in simulation environments that need stereoscopic 3D content.
Modular LED cabinets now swap in under 10 minutes, limiting downtime in mission-critical sites. Tiled LCD costs rise once backlight failures begin around 50,000 hours, tipping long-term economics toward LED even for mid-sized rooms. Cube walls continue in air-traffic-control simulators where their optical engines handle parallax-free 3D imagery.
By Installation Location: Outdoor Gains as Cities Digitize Public Spaces
Indoor deployments captured 60.78% of 2025 revenue in the video wall market, led by corporate, retail, and control-room use. Outdoor installations are projected to rise at 16.92% CAGR as smart-city programs across the Gulf and Southeast Asia fund plaza screens and transit-corridor displays. Ruggedized designs rated for -30 °C to +50 °C conditions add 25-35% to system cost but are essential for extreme climates.
Regulatory caps on brightness and operating hours in Europe force advertisers to integrate auto-dimming and curfews, boosting controller demand. High-brightness LEDs above 5,000 nits and anti-reflective coatings preserve daylight visibility while meeting power caps of 200 W/m² outlined in IEC energy standards. Solar-assisted shelters in Southeast Asia reduce grid strain and ensure uptime during outages.
Geography Analysis
The Asia-Pacific region generated 37.92% of 2025 revenue, sustained by vertically integrated Chinese vendors exporting turnkey systems at prices 20-30% lower than those of Western peers. India’s major airports and metros are mid-upgrade, while Japan’s replacements align with 2024 efficiency codes from METI. Australia’s mining command centers require dust-proof, temperature-tolerant models.
The Middle East is forecast to have a 13.72% CAGR through 2031, as Saudi Arabia’s NEOM and the UAE’s airport expansions demand sunlight-readable, 50 °C-rated outdoor walls. Retail groups in Turkey are turning to large-format displays to spur in-store experiences. North America advances steadily as enterprises retrofit LCD walls with narrow-bezel LED models compatible with hybrid work suites. European adoption reflects tough energy and light-pollution rules. U.K. transportation hubs move from projection cubes to direct-view LED for 10-year savings. German automakers utilize 4K walls in their design studios to visualize paint and trim in real-time. France’s nighttime curfews redirect budgets indoors, while South America’s growth hinges on reduced tariffs under Brazil’s airport privatization program.

Competitive Landscape
Samsung, LG, and Sony leverage consumer-electronics economies of scale to bundle hardware, CMS, and five-year service deals that lower entry barriers for enterprise buyers. Chinese leaders Leyard, Unilumin, Absen, and AOTO maintain cost leadership through chip-line integration and are building Mexican and Polish plants to dodge tariffs, compressing mid-tier margins. Barco and Christie Digital defend control-room niches with proprietary calibration and lifetime service contracts, though commoditizing LED is eroding premiums.
Disruptors include Taiwanese and South Korean chip startups licensing MicroLED IP to second-tier display vendors, enabling premium specs at mid-range prices. Patent filings show Samsung and LG investing in AI-driven color calibration that auto-corrects aging and flags component failures before blackout, creating platform lock-in. Municipal tenders now favor suppliers with local assembly and service footprints, rewarding integrators that partner with regional contractors to satisfy domestic-content rules.
Video Wall Industry Leaders
Samsung Electronics Co., Ltd.
LG Electronics Inc.
Leyard Optoelectronic Co., Ltd.
Barco NV
Sharp NEC Display Solutions, Ltd.
- *Disclaimer: Major Players sorted in no particular order

Recent Industry Developments
- January 2025: Samsung partnered with Incheon International Airport to install 32 MicroLED walls worth USD 18 million, expected to yield USD 6 million in annual ad revenue.
- November 2024: LG opened a USD 120 million LED plant in Monterrey, Mexico, adding 10,000-panel annual capacity for tariff-free North American supply.
- October 2024: Barco acquired German integrator Eyevis for USD 90 million to broaden ruggedized control-room offerings.
- September 2024: Leyard won a USD 22 million deal to outfit Riyadh Metro’s 85 stations with LED walls under a 10-year maintenance pact.


Global Video Wall Market Report Scope
The video wall market refers to the industry focused on large, multi-display visual systems that combine multiple screens to create a single, seamless display for high-impact content delivery. These systems, which use technologies such as LCD, LED, rear-projection cubes, and MicroLED, are deployed across indoor and outdoor environments for applications in retail, transportation, government, corporate settings, and entertainment. Overall, the market enables immersive, large-format visual communication and real-time information display across global end-use sectors.
The Video Wall Market Report is Segmented by Technology (LCD, LED, Rear-Projection Cube, MicroLED), End-User (Retail, Transportation, Government and Public Utilities, Corporate, Hospitality and Entertainment, Others), Display Type (Direct-View, Tiled LCD Panel, Rear Projection Cube), Installation Location (Indoor, Outdoor), and Geography (North America, South America, Europe, Asia-Pacific, Middle East and Africa). Market Forecasts are Provided in Terms of Value (USD).
| LCD |
| LED |
| Rear-Projection Cube |
| MicroLED |
| Retail |
| Transportation |
| Government and Public Utilities |
| Corporate |
| Hospitality and Entertainment |
| Others |
| Direct-View Video Wall |
| Tiled LCD Panel Wall |
| Rear Projection Cube Wall |
| Indoor |
| Outdoor |
| North America | United States | |
| Canada | ||
| Mexico | ||
| South America | Brazil | |
| Argentina | ||
| Rest of South America | ||
| Europe | United Kingdom | |
| Germany | ||
| France | ||
| Spain | ||
| Italy | ||
| Rest of Europe | ||
| Asia Pacific | China | |
| India | ||
| Japan | ||
| Australia | ||
| South Korea | ||
| Rest of Asia-Pacific | ||
| Middle East and Africa | Middle East | Saudi Arabia |
| United Arab Emirates | ||
| Turkey | ||
| Rest of Middle East | ||
| Africa | South Africa | |
| Kenya | ||
| Rest of Africa | ||
| By Technology | LCD | ||
| LED | |||
| Rear-Projection Cube | |||
| MicroLED | |||
| By End-User | Retail | ||
| Transportation | |||
| Government and Public Utilities | |||
| Corporate | |||
| Hospitality and Entertainment | |||
| Others | |||
| By Display Type | Direct-View Video Wall | ||
| Tiled LCD Panel Wall | |||
| Rear Projection Cube Wall | |||
| By Installation Location | Indoor | ||
| Outdoor | |||
| By Geography | North America | United States | |
| Canada | |||
| Mexico | |||
| South America | Brazil | ||
| Argentina | |||
| Rest of South America | |||
| Europe | United Kingdom | ||
| Germany | |||
| France | |||
| Spain | |||
| Italy | |||
| Rest of Europe | |||
| Asia Pacific | China | ||
| India | |||
| Japan | |||
| Australia | |||
| South Korea | |||
| Rest of Asia-Pacific | |||
| Middle East and Africa | Middle East | Saudi Arabia | |
| United Arab Emirates | |||
| Turkey | |||
| Rest of Middle East | |||
| Africa | South Africa | ||
| Kenya | |||
| Rest of Africa | |||


Key Questions Answered in the Report
What is the current global video wall market size?
The video wall market size stands at USD 13.2 billion in 2026.
How fast is the market expected to grow through 2031?
The market is forecast to advance at an 11.79% CAGR, reaching USD 23.06 billion by 2031.
Which technology segment will expand the fastest?
MicroLED is projected to grow at a 26.11% CAGR due to its superior contrast and lifespan.
Which end-user segment is leading growth?
Hospitality and entertainment venues are forecast to expand at 20.29% CAGR through 2031.
Which region holds the largest revenue share?
Asia-Pacific accounted for 37.92% of global 2025 revenue, driven by Chinese manufacturing scale.
What is the main barrier to wider adoption?
High initial investment and total cost of ownership remain the principal restraints, especially in price-sensitive regions.
Page last updated on:


