Television And Set Top Box Market Size and Share
Market Overview
| Study Period | 2020 - 2031 |
|---|---|
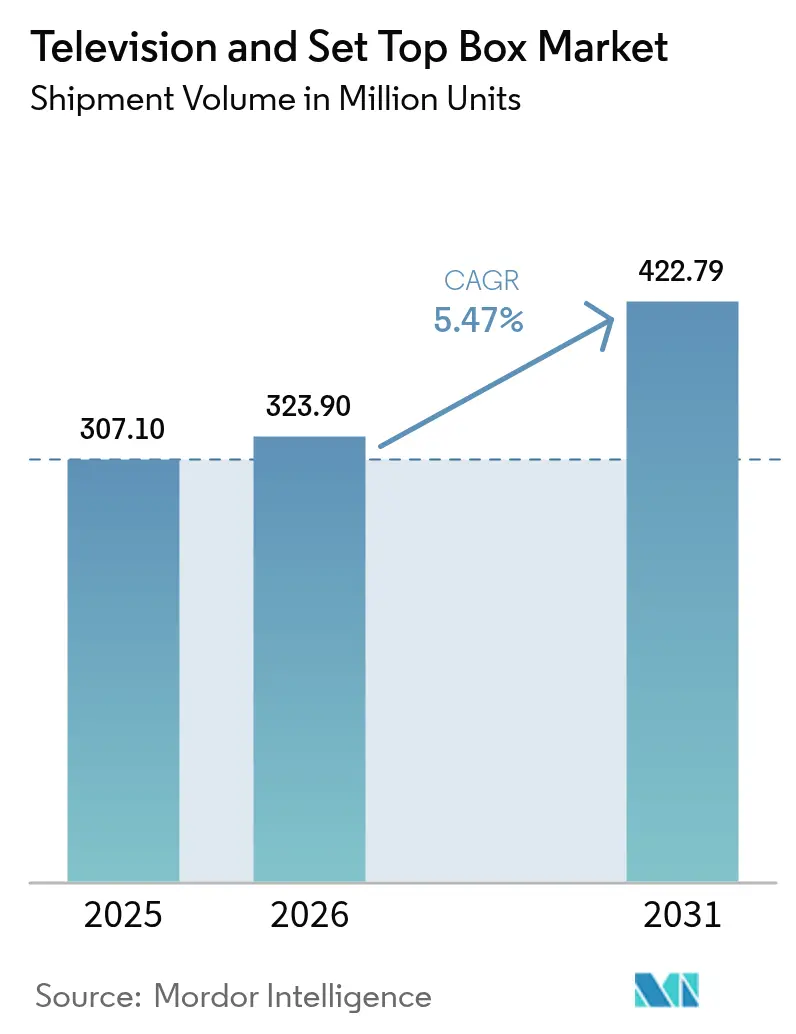
| Market Volume (2026) | 323.9 Million units |
| Market Volume (2031) | 422.79 Million units |
| Growth Rate (2026 - 2031) | 5.47% CAGR |
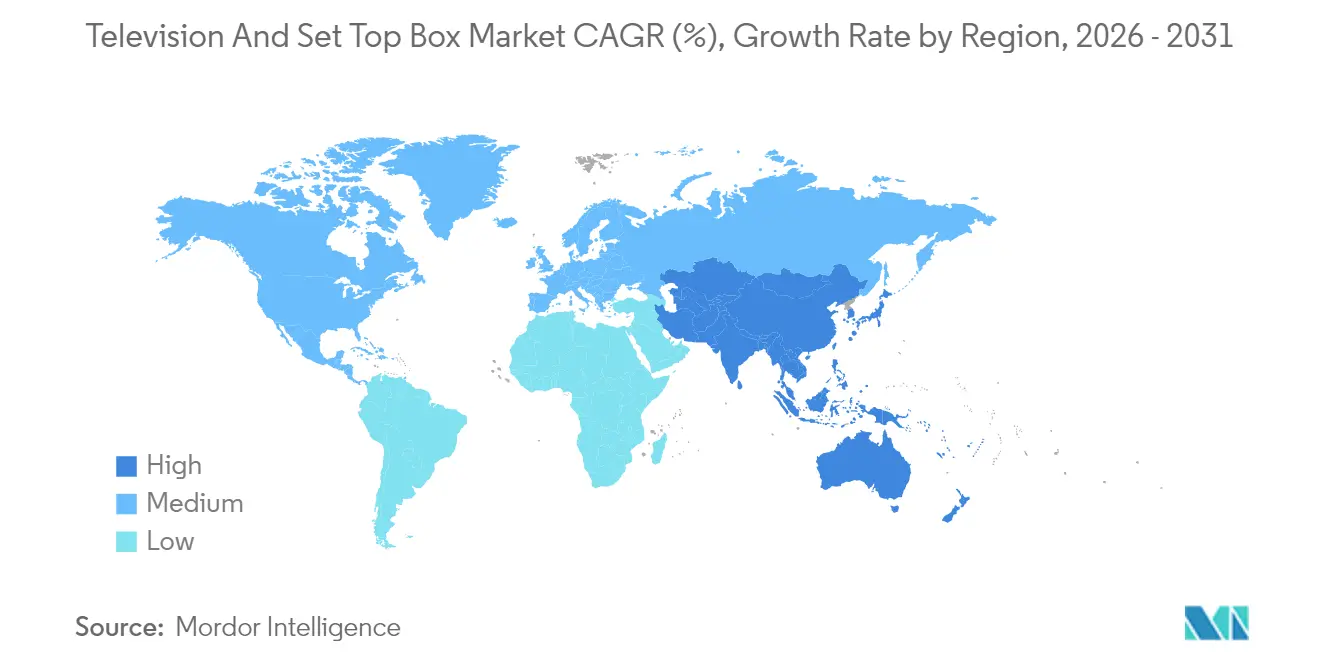
| Fastest Growing Market | Asia-Pacific |
| Largest Market | Asia-Pacific |
| Market Concentration | Medium |
Major Players *Disclaimer: Major Players sorted in no particular order Image © Mordor Intelligence. Reuse requires attribution under CC BY 4.0. | |
Television And Set Top Box Market Analysis by Mordor Intelligence
The Television and Set Top Box market size is expected to grow from 307.10 million units in 2025 to 323.9 million units in 2026 and is forecast to reach 422.79 million units by 2031 at 5.47% CAGR over 2026-2031. The Television and Set Top Box market is moving away from legacy broadcast hardware toward connected ecosystems where smart-TV operating systems, streaming dongles, and AI-driven interfaces reshape upgrade cycles and pricing power. Ultra-high-definition 4K remains the mainstream resolution driver, while government-led digital switchover programs and expanding rural satellite-IP–IP hybrids open fresh addressable demand. Asia-Pacific manufacturers leverage scale to shorten product lead times and compress costs, even as North American and European buyers gravitate to large-format premium panels. Meanwhile, edge-based advertising models create recurring revenue streams that partially offset margin pressure from rising semiconductor and panel input costs.[1]Samsung Electronics, “Samsung Maintains Global TV Leadership for 19th Consecutive Year,” samsung.com
Key Report Takeaways
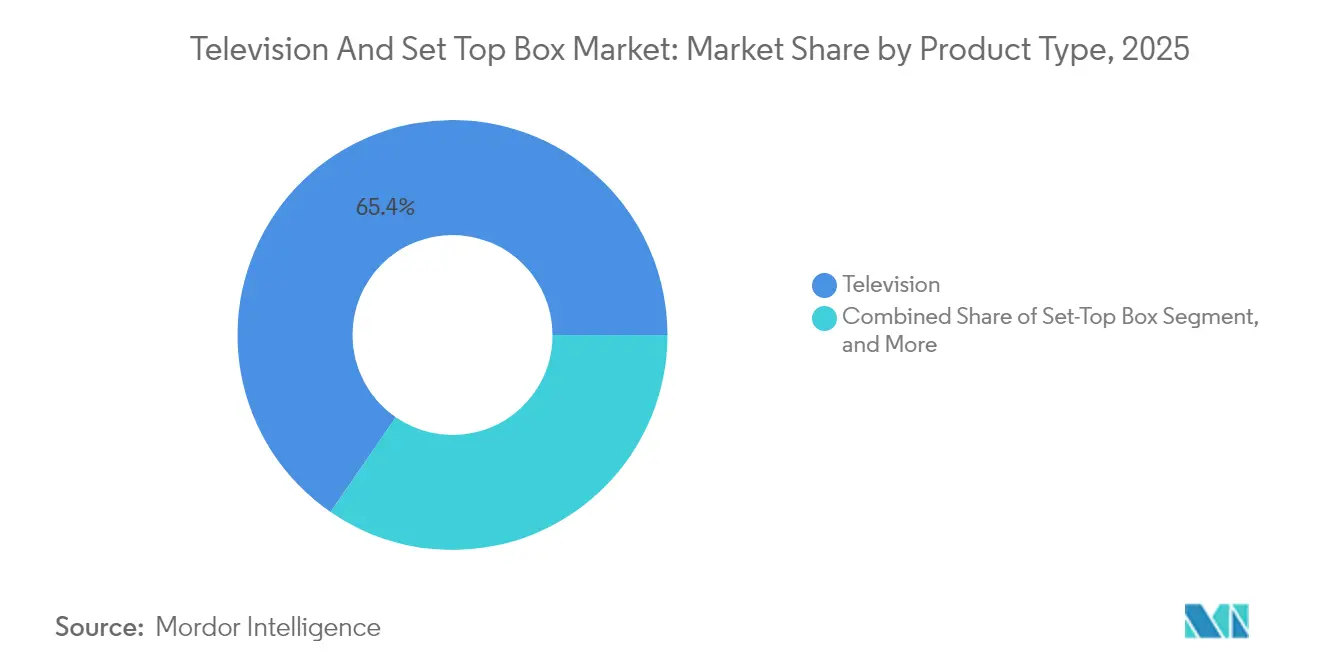
- By product type, streaming dongles and sticks expanded at a 7.74% CAGR between 2026 and 2031, outpacing televisions, which retained 65.40% of the television and set-top box market share in 2025.
- By resolution, 4K accounted for 43.85% of the television and set-top box market share in 2025, while the 8K segment posted the fastest growth at 6.95% CAGR to 2031.
- By screen size, the 56-64-inch class led with 31.95% of the television and set-top box market share in 2025; screens of 75 inches and above are projected to deliver a 7.58% CAGR through 2031.
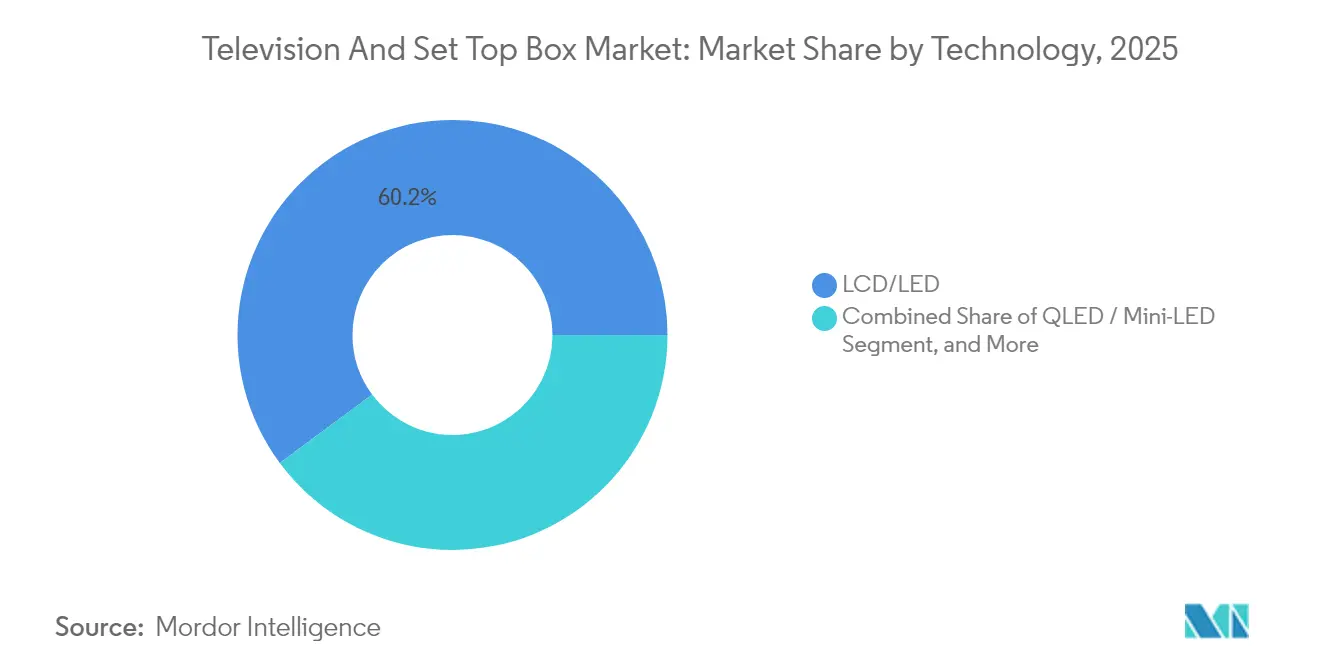
- By technology, LCD/LED held 60.15% of the television and set-top box market share in 2025, whereas QLED and Mini-LED combined are forecast to rise 7.46% annually to 2031.
- By end-user, residential applications commanded 75.85% of the television and set-top box market size in 2025; the commercial and institutional segment is on track for 7.06% CAGR through 2031.
- By geography, Asia-Pacific accounted for 42.20% of the television and set-top box market share in 2025, and is set for a 6.53% CAGR through 2031.
Note: Market size and forecast figures in this report are generated using Mordor Intelligence’s proprietary estimation framework, updated with the latest available data and insights as of 2026.
Global Television And Set Top Box Market Trends and Insights
Drivers Impact Analysis*
| Driver | (~) % Impact on CAGR Forecast | Geographic Relevance | Impact Timeline |
|---|---|---|---|
| Rapid consumer migration to 4K and 8K UHD | +1.2% | Asia-Pacific, North America | Medium term (2-4 years) |
| Smart-TV OS ecosystems | +1.0% | Developed markets globally | Short term (≤2 years) |
| Government-mandated digital switchover | +0.8% | Emerging Asia-Pacific, Africa, Latin America | Long term (≥4 years) |
| AI-enabled personalized interfaces | +0.7% | North America, Europe, developed Asia-Pacific | Medium term (2-4 years) |
| Edge-based interactive advertising | +0.5% | North America, Europe, Asia-Pacific | Medium term (2-4 years) |
| LEO-satellite rural reach | +0.4% | Rural areas worldwide | Long term (≥4 years) |
| Source: Mordor Intelligence | |||
Rapid Consumer Migration to 4K and 8K UHD Content
Surging demand for higher-resolution screens is compressing replacement cycles and lifting average selling prices. Although 8K hardware exists, limited native content keeps adoption muted, so 4K continues to dominate upgrade decisions. BenQ forecasts that widescale 8K take-up remains at least six years away, reinforcing the mid-term commercial primacy of 4K panels.[2]BenQ Corporation, “Why 8K Adoption Will Take 6–10 Years,” benq.com Samsung’s extensive 8K patent portfolio is also likely to influence cost structures and competitive licensing. The Television and Set Top Box market, therefore, leans on 4K as the principal value driver while treating 8K as a longer-run premium pathway.
Smart-TV OS Ecosystems Accelerating Replacement Cycles
Software ecosystems are now the heart of product differentiation. Samsung’s 2025 sets integrate Vision AI to tailor recommendations and voice commands. LG is pairing Microsoft Copilot to add productivity features, shortening perceived product life and encouraging 4- to 5-year upgrade intervals. Platform fragmentation, Android TV, Roku, webOS and others, creates sticky ecosystems that lock users into branded interfaces. As a result, service revenue and targeted advertising are growing alongside hardware revenue, boosting the Television And Set Top Box market.
Government-Mandated Digital-Switchover Programs
The International Telecommunication Union coordinates analog switch-off deadlines, spurring equipment demand in countries such as Nigeria, South Africa, and Indonesia.[3]International Telecommunication Union, “Status of the Digital Terrestrial Television Transition Worldwide,” itu.int Subsidies for compliant set-top boxes and energy-efficient displays generate predictable multi-year procurement. These staggered transitions give manufacturers clear production visibility and support local assembly initiatives that tap emerging-market employment incentives.
AI-Enabled Personalized User Interfaces Enhancing ARPU
AI routines filter vast viewing histories to push bespoke channels, which lifts engagement metrics and advertising CPMs. Samsung’s Vision AI, for instance, parses intent and habits to sharpen contextual promotions. Voice assistants gather additional household data, allowing granular ad segmentation. While Roku’s experience shows that device growth without refined targeting offers limited monetization, the broader Television And Set Top Box industry expects incremental ARPU gains as AI maturity rises.
Restraints Impact Analysis*
| Restraint | (~) % Impact on CAGR Forecast | Geographic Relevance | Impact Timeline |
|---|---|---|---|
| Escalating panel and semiconductor costs | -1.1% | Global | Short term (≤2 years) |
| Saturation in developed markets | -0.9% | North America, Europe, developed Asia-Pacific | Long term (≥4 years) |
| Cord-shifting to mobile and PC | -0.6% | Global, younger demographics | Medium term (2-4 years) |
| Carbon and e-waste regulation on big screens | -0.3% | Europe, North America, expanding to Asia-Pacific | Long term (≥4 years) |
| Source: Mordor Intelligence | |||
Escalating Panel and Semiconductor Input Costs
Display glass, driver ICs, and memory have seen cost rebound since mid-2024. Concentrated panel fabrication in East Asia exposes brands to geopolitical and logistics risks. Smaller suppliers lack hedge leverage and must either absorb costs or raise retail prices, pressuring margins. Larger firms pursue vertical integration and long-term wafer agreements, but these hedges only partially offset the negative 1.1-percentage-point drag on the Television and Set Top Box market CAGR.
Saturation in Developed Markets
Penetration near 100% in North America and Western Europe extends replacement cycles and shifts focus to premium SKUs rather than volume. Software updates can refresh existing sets, further diluting near-term hardware demand. Consequently, manufacturers pivot toward commercial displays, emerging-market rollouts, and software monetization to sustain growth in the Television and Set Top Box market.
*Our forecasts treat driver/restraint impacts as directional, not additive. The impact forecasts reflect baseline growth, mix effects, and variable interactions.
Segment Analysis
By Product Type: Streaming Devices Reshape Viewing
The Television and Set Top Box market size for televisions retained a 65.40% slice of 2025 revenue, yet streaming dongles and sticks posted the segment’s top 7.74% CAGR. Dongles thrive on portability, quick setup, and low entry prices, eroding traditional cable and satellite box relevance. In regions where legacy pay-TV retains sway, hybrid satellite-IP-IP boxes address both linear and OTT viewing. Meanwhile, smart-TV integration lowers future standalone dongle demand in developed economies, but emerging markets still adopt low-cost add-ons as the first step into connected content. Brands increasingly bundle free ad-supported streaming television (FAST) channels in the interface, increasing engagement and data collection.
Price wars in sticks, Roku versus Amazon Fire TV and Xiaomi, compress margins yet expand installed base, which in turn fuels ad inventory. Television manufacturers counter by embedding comparable OS functionality in-panel, retaining value chain control. This tug-of-war ensures product diversity but also blurs category lines, meaning that many households now run multiple streaming devices alongside smart panels, inflating total addressable units within the Television And Set Top Box market.


By Resolution: 4K Mainstay, 8K Aspirant
The Television And Set Top Box market share for 4K rose to 43.85% in 2025 and continues to command mid-cycle upgrades, propelled by mature production yields and abundant native content via OTT platforms. Upgraders see tangible visual benefits over HD at mainstream panel sizes, helping 4K sets maintain compelling value. Conversely, the 8K class, while logging a 6.95% CAGR, shipped only 143,000 units in 2024, reflective of its content deficit and premium price positioning. Hardware makers nevertheless push 8K to defend ASPs and brand leadership.
Manufacturers apply AI upscaling to mitigate native content scarcity, hoping to seed an install base ahead of true 8K broadcast. BenQ anticipates mass adoption no sooner than 2031, suggesting continued dominance of 4K through the forecast period. HD and Full HD persist in cost-focused emerging nations and commercial installations where bandwidth and content constraints make 4K overkill.
By Screen Size: Bigger Becomes Standard
The 56-64-inch class captured 31.95% of 2025 sales, but the 75-inch-plus band will clock a 7.58% CAGR as consumers chase theater-like immersion. Price per diagonal inch for 75-inch LCD has fallen below USD 500 at mainstream retailers, narrowing the upgrade premium and encouraging buyers to leapfrog intermediate sizes. Manufacturers push area-based marketing, selling bigger screens rather than just more units, to maintain revenue per household.
Commercial buyers mirror the trend, specifying 98-inch displays for boardrooms and signage. Consequently, panel makers retool fabs for larger substrates, achieving scale efficiencies that feed back into lower end-user prices, reinforcing the virtuous cycle in the Television And Set Top Box market.
By Technology: QLED and Mini-LED Narrow the Gap
LCD/LED still led the Television and Set Top Box market size with 60.15% revenue share in 2025, thanks to favorable cost structures. Yet QLED and Mini-LED surged 7.46% annually as value-conscious buyers traded up for quantum-dot vibrancy and local-dimming brightness. Samsung shipped 8.34 million QLED TVs in 2024, equal to 46.8% of that sub-segment. Chinese brands' fast-follower strategies, Hisense and TCL, double premium volumes annually, pressuring established leaders.
Mini-LED’s micro-lens arrays raise peak luminance while avoiding OLED burn-in, making it a household favorite for bright living rooms. OLED, once the pinnacle, faces a margin squeeze as production costs converge with advanced LCD. Manufacturers now mix technology lineups to hedge volatile material costs and shifting consumer tastes.
By End-User: Commercial Demand Diversifies Revenue
Residential remained dominant at 75.85% of 2025 sales, but commercial and institutional applications expanded 7.06% annually, cushioning cyclical consumer replacement dips. Retail, hospitality, and quick-service restaurants deploy digital menu boards and interactive wayfinding, driving volume in specialized signage panels. Corporations install IPTV and OTA-capture systems for campus communications, favoring ruggedized set-top boxes with extended firmware support.
Education budgets allocate funds to large-screen interactive displays and lecture-streaming appliances, upgrading classroom engagement. Healthcare’s telemetry boards and infotainment solutions require certified hygienic enclosures, commanding premium pricing. This diversification limits revenue volatility and spreads component procurement risk across the Television and Set Top Box market.
Geography Analysis
Asia-Pacific generated 42.20% of global 2025 revenue and will advance at a 6.53% CAGR, fueled by China’s scale production and India’s double-digit smart-TV household expansion. Domestic champions TCL and Hisense leverage lower labor costs and state incentives to accelerate premium shipments, narrowing the gap with Korean incumbents. Government digital initiatives in Indonesia, Vietnam, and the Philippines enlarge unit volumes, while Japan and South Korea maintain technology leadership through 8K trials and immersive audio-visual standards.
North America presents a mature yet lucrative arena where large-format 4K and 8K panels dominate living-room real estate. Korean brands captured 52% unit share among U.S. adults, reflecting durable brand equity. The region shows solid 7.92% revenue CAGR driven by premium upselling rather than unit expansion, with consumers embracing voice assistants, console gaming, and advanced HDR variants. Trade under the USMCA agreement supports just-in-time logistics from Mexican assembly hubs, moderating inventory risk for retailers.
Europe’s growth is steadier, constrained by energy-efficiency mandates and early analog switch-off completion. Eco-design rules force power-saving firmware and recyclable packaging, adding compliance costs that smaller Asian entrants may struggle to meet. Nevertheless, Germany, the UK, and France prioritize 65-inch-plus 4K sets, and OLED adoption remains strongest in Western capitals. Emerging Central and Eastern Europe sees digital switchover tailwinds similar to select African states, affording brands a long-term replacement runway once economic indicators stabilize.

Competitive Landscape
The Television And set-top box market exhibits moderate fragmentation. Samsung retained overall leadership for a 19th consecutive year with 28.3% global share and nearly 50% command of TVs priced above USD 2,500. LG focuses on OLED and cloud-gaming alliances to reinforce its premium standing, yet TCL’s Q4 2024 surge into the high-end bracket illustrates how aggressive Chinese price-performance tactics erode Korean dominance. Hisense’s sustained double-digit shipment growth further reshapes share hierarchies.
Strategically, leaders invest in software ecosystems to differentiate beyond panel technology. Samsung’s Vision AI and LG’s Copilot partnership exemplify the convergence of productivity, smart-home control, and entertainment within one screen. Supply-chain resilience now determines gross-margin stability; vertically integrated panel fabs or secure OLED tie-ups, such as Sony’s use of Samsung Display QD-OLED, mitigate component shocks.
Streaming-device specialists like Roku and Amazon represent adjacent competition, siphoning living-room interface influence. Yet as panel vendors embed equivalent OS layers, standalone streamer ASPs compress, forcing those brands deeper into advertising and platform licensing. The competitive matrix therefore spans hardware, software and services layers, with success hinging on brand resonance, platform lock-in and disciplined cost management across the Television And Set Top Box market.
Television And Set Top Box Industry Leaders
Samsung Electronics Co., Ltd.
LG Electronics Inc.
TCL Technology Group Corp.
Hisense Co., Ltd.
Sony Group Corporation
- *Disclaimer: Major Players sorted in no particular order


Recent Industry Developments
- March 2025: Samsung rolled out Vision AI across Neo QLED and QLED models, deepening personalized content curation and targeted advertising.
- February 2025: LG and Microsoft extended Copilot AI to 2025 smart TVs, embedding voice-controlled productivity and smart-home management.
- January 2025: TCL surpassed LG in premium-TV quarterly sales, underscoring Chinese momentum in high-margin categories.
- December 2024: Sony expanded QD-OLED sourcing from Samsung Display for next-gen flagship models.


Global Television And Set Top Box Market Report Scope
The study covers market sizes and trends for television sets and set-top boxes. A set-top box is a device that facilitates the television's becoming a user interface to the internet and equips a television to receive and decode digital television (DTV) broadcasts. The market study has also mapped the significant impacts of the COVID-19 pandemic and other macroeconomic indicators to arrive at the overall market projections.
The set-top box market is segmented by technology (satellite/DTH, IPTV, and cable), resolution (SD, HD, and ultra-HD and higher), and geography (North America, Europe, Asia-Pacific, and the rest of the world). The television market is segmented by resolution (HD/FHD, 4K, and 8K), size (32 inch and below, 39-43-inch, 48-50-inch, 55-60 inch, and 65 inch and above), technology (LCD, OLED, and QLED), and geography (North America, Europe, Asia-Pacific, and rest of the world). The market sizes and forecasts are provided in terms of value in (USD) for all the above segments.
| Television |
| Set-Top Box |
| Streaming Dongles/Sticks |
| SD |
| HD/FHD |
| 4K |
| 8K and Above |
| 32” and Below |
| 33–43” |
| 44–55” |
| 56–64” |
| 65–74” |
| 75” and Above |
| LCD/LED |
| QLED / Mini-LED |
| OLED |
| Laser / Projection TV |
| Residential |
| Commercial and Institutional |
| North America | United States |
| Canada | |
| Mexico | |
| South America | Brazil |
| Argentina | |
| Rest of South America | |
| Europe | Germany |
| United Kingdom | |
| France | |
| Italy | |
| Rest of Europe | |
| Asia-Pacific | China |
| Japan | |
| South Korea | |
| India | |
| Rest of Asia-Pacific | |
| Middle East | Saudi Arabia |
| United Arab Emirates | |
| Rest of Middle East | |
| Africa | South Africa |
| Rest of Africa |
| By Product Type | Television | |
| Set-Top Box | ||
| Streaming Dongles/Sticks | ||
| By Resolution | SD | |
| HD/FHD | ||
| 4K | ||
| 8K and Above | ||
| By Screen Size | 32” and Below | |
| 33–43” | ||
| 44–55” | ||
| 56–64” | ||
| 65–74” | ||
| 75” and Above | ||
| By Technology | LCD/LED | |
| QLED / Mini-LED | ||
| OLED | ||
| Laser / Projection TV | ||
| By End-User | Residential | |
| Commercial and Institutional | ||
| By Geography | North America | United States |
| Canada | ||
| Mexico | ||
| South America | Brazil | |
| Argentina | ||
| Rest of South America | ||
| Europe | Germany | |
| United Kingdom | ||
| France | ||
| Italy | ||
| Rest of Europe | ||
| Asia-Pacific | China | |
| Japan | ||
| South Korea | ||
| India | ||
| Rest of Asia-Pacific | ||
| Middle East | Saudi Arabia | |
| United Arab Emirates | ||
| Rest of Middle East | ||
| Africa | South Africa | |
| Rest of Africa | ||


Key Questions Answered in the Report
How large is the Television And Set Top Box market in 2026?
The market stands at USD 323.9 billion in 2026 with a forecast to reach USD 422.79 billion by 2031, implying a 5.47% CAGR.
Which segment is expanding most rapidly by product type?
Streaming dongles and sticks post a 7.74% CAGR, outpacing televisions and traditional set-top boxes.
What resolution leads consumer adoption?
4K panels hold 43.85% revenue share and remain the upgrade driver, while 8K adoption is still nascent.
Which region contributes the highest revenue?
Asia-Pacific commands 42.20% of 2025 revenue and maintains the fastest 6.53% regional CAGR to 2031.
Who is the global TV market leader?
Samsung retained first position for the 19th straight year with 28.3% global share and near-half control of the USD 2,500-plus price band.
Why are commercial installations important?
Commercial and institutional deployments grow at 7.06% CAGR, providing a stable revenue stream that buffers consumer market saturation.
Page last updated on:


