Market Overview
| Study Period | 2020 - 2031 |
|---|---|
| Forecast Data Period | 2026 - 2031 |
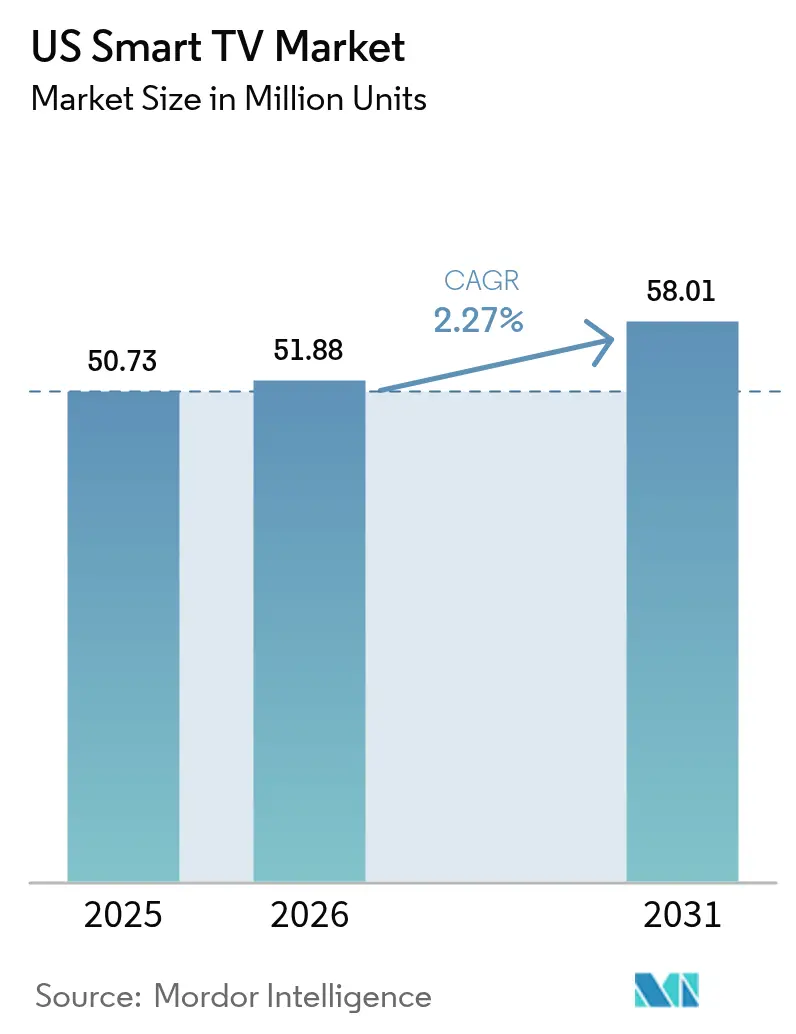
| Base Year Market Size (2025) | 50.73 Million units |
| Market Volume (2026) | 51.88 Million units |
| Market Volume (2031) | 58.01 Million units |
| Growth Rate (2026 - 2031) | 2.27% CAGR |
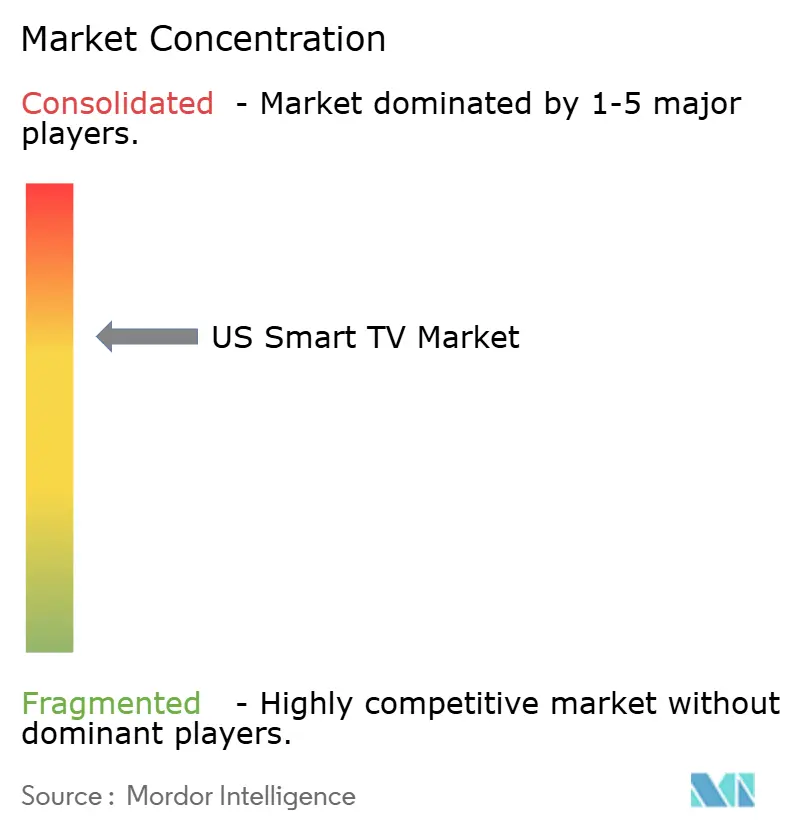
| Market Concentration | Medium |
Major Players *Disclaimer: Major Players sorted in no particular order Image © Mordor Intelligence. Reuse requires attribution under CC BY 4.0. | |
US Smart TV Market Analysis by Mordor Intelligence
The US Smart TV market size was valued at 50.73 million units in 2025 and estimated to grow from 51.88 million units in 2026 to reach 58.01 million units by 2031, at a CAGR of 2.27% during the forecast period (2026-2031). End-user demand is shifting toward premium picture quality, integrated streaming ecosystems, and gaming-ready features, even as overall growth moderates in a maturing consumer electronics category. The momentum behind large formats, notably 55-64 inch sets, continues to anchor mainstream volumes, while ultra-large 75-inch-plus screens turn into the primary aspirational purchase. At the same time, panel innovation cycles, 4-stack OLED, mini-LED, and emerging RGB backlighting, are shortening replacement timelines. Platform monetization through connected-TV (CTV) advertising now subsidizes hardware prices, helping brands defend unit share against aggressive price compression from new Chinese entrants. Finally, state-level energy incentives and tightening data-privacy rules both shape product development priorities, underlining the complex regulatory environment surrounding the US Smart TV market.
Key Report Takeaways
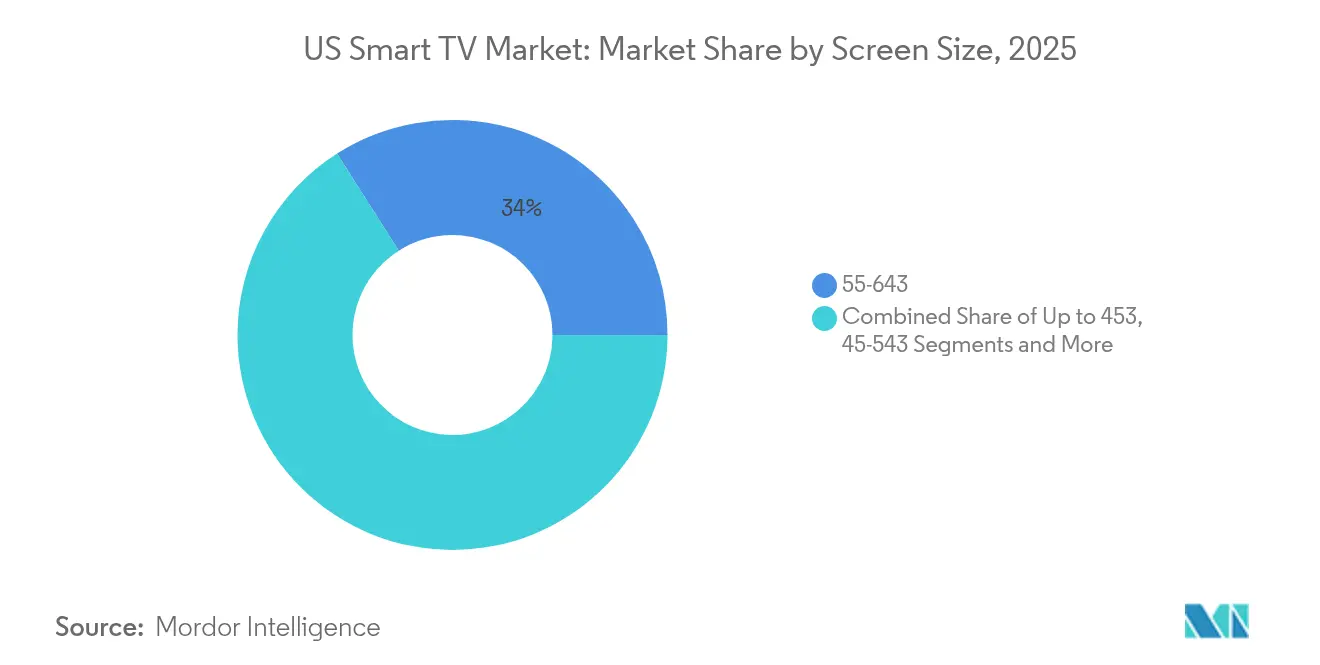
- By screen size, 55–64 inch models led with 34.02% market share in 2025, while 75-inch-and-above models posted the fastest growth at a 2.69% CAGR through 2031.
- By resolution, 4K UHD captured 54.02% of the US Smart TV market in 2025; 8K UHD leads with a 3.17% CAGR outlook through 2031.
- By panel technology, LCD/LED captured 60.45% of the US Smart TV market size in 2025, while, OLED generated a 2.62% CAGR forecast, outpacing the broader US Smart TV market size.
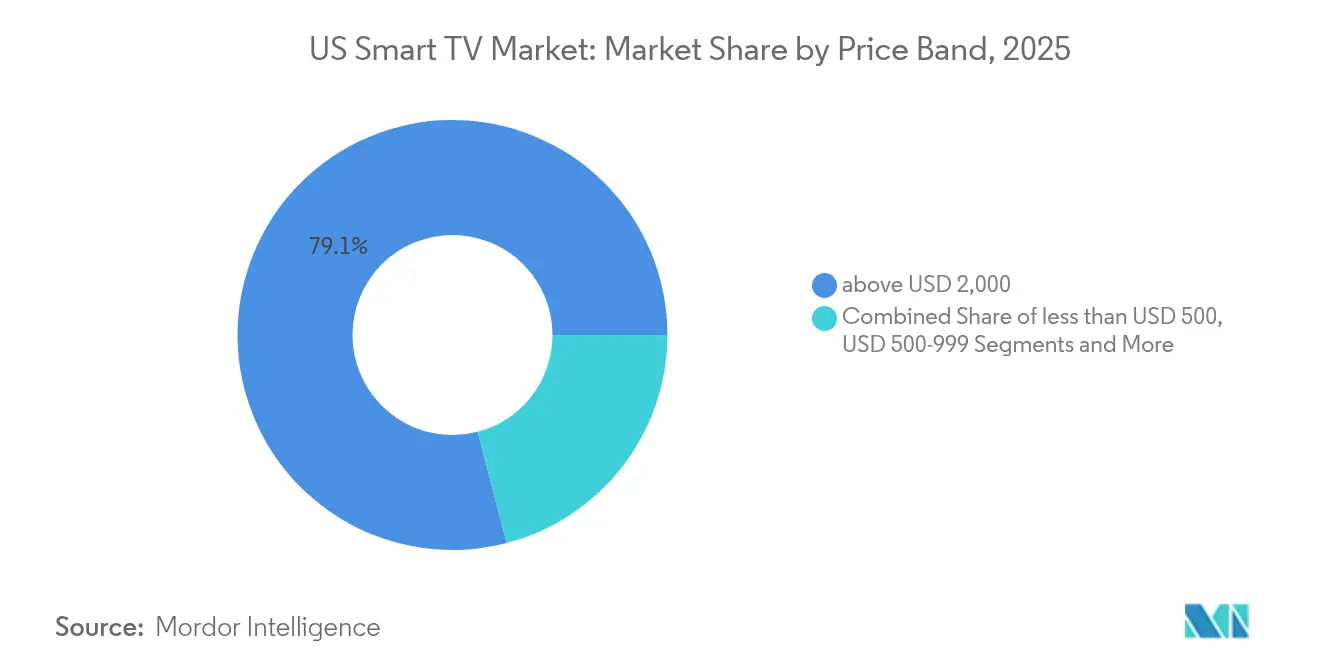
- By price band, sets priced above USD 2,000 contributed 79.05% of premium-segment revenue in 2025 and are projected to rise at a 2.61% CAGR through 2031.
- By operating system, Roku OS led with 38.12% of premium-segment revenue in 2025, while Google TV is expected to grow at a 2.6% CAGR through 2031.
- Samsung, LG, and TCL together held 78.95% of premium-segment revenue in 2025, underscoring concentrated brand strength at the high end.
Note: Market size and forecast figures in this report are generated using Mordor Intelligence’s proprietary estimation framework, updated with the latest available data and insights as of 2026.
US Smart TV Market Trends and Insights
Drivers Impact Analysis*
| Driver | (~) (%) Impact on CAGR Forecast | Geographic Relevance | Impact Timeline |
|---|---|---|---|
| Rapid 4K/8K upgrade cycle | +0.8% | National metropolitan clusters | Medium term (2–4 years) |
| Built-in streaming and app ecosystems | +0.6% | Cord-cutting regions nationwide | Short term (≤ 2 years) |
| Surge in larger-than-65″ purchases | +0.7% | High-income markets | Medium term (2–4 years) |
| CTV advertising revenue sharing with OEMs | +0.4% | Major designated market areas | Long term (≥ 4 years) |
| Gaming-optimized TV features | +0.3% | Gaming-dense demographics | Short term (≤ 2 years) |
| Energy-efficiency tax incentives | +0.2% | States with rebate schemes | Medium term (2–4 years) |
| Source: Mordor Intelligence | |||
Rapid 4K/8K upgrade cycle
4K UHD already dominates more than half of shipments, yet manufacturers are shortening the technology cycle by mainstreaming 8K-ready processors and advanced backlighting. Samsung’s RGB mini-LED prototypes shown in 2025 promise OLED-level contrast while holding LCD cost parity[1]Source: Samsung Electronics, “2025 Neo QLED & OLED TV Launch Highlights,” samsung.com . LG’s four-stack OLED architecture lifts peak brightness by 40%, solving HDR limitations that once slowed premium adoption[2]Source: LG Display, “Four-Stack OLED Architecture Technical Brief,” lg.com. These step-changes jointly nudge existing owners toward earlier replacement, especially as streaming and next-gen consoles gradually expose 8K native content.
Built-in streaming and app ecosystems
Smart-TV operating systems now replicate the functionality of external sticks, bringing storefronts, payments, and targeted ads under the television brand. Roku OS still accounts for the largest footprint, but Google TV is the fastest riser as search personalization drives watch-time. LG reports that its webOS ad-tech revenue surpassed KRW 1 trillion in 2024, proof that platform economics increasingly offset hardware margin compression.[3]Source: LG Electronics, “LG Announces Fourth-Quarter and Full-Year 2024 Financial Results,” lg.com
Surge in larger-than-65″ purchases
The price premium for 75-inch panels has narrowed to roughly 1.3× the cost of a 65-inch set, down from nearly 2× five years earlier. Wireless breakout boxes, now trickling from flagship OLED into upper-mid mini-LED lines, reduce cable clutter and installation fears. Simultaneously, the shift to remote-work lifestyles has turned living rooms into hybrid entertainment hubs, encouraging consumers to justify oversized screens for both daytime productivity and evening streaming.
CTV advertising revenue sharing creates new business models
Platform owners increasingly sign revenue-share agreements that deliver double-digit ARPU growth. LG’s 2024 webOS ad revenue already covers close to 15% of its entire home-entertainment gross profit, demonstrating how data-driven inventory can lower headline pricing without eroding bottom-line contribution.
Restraints Impact Analysis*
| Restraint | (~) (%) Impact on CAGR Forecast | Geographic Relevance | Impact Timeline |
|---|---|---|---|
| Smartphone/tablet viewing cannibalization | −0.5% | Younger urban cohorts | Long term (≥ 4 years) |
| Price compression from low-cost Chinese brands | −0.4% | Price-sensitive segments | Short term (≤ 2 years) |
| OS-level data-privacy pushback | −0.3% | Privacy-focused states | Medium term (2–4 years) |
| Supply-chain volatility in mini-LED backlights | −0.2% | Premium availability | Short term (≤ 2 years) |
| Source: Mordor Intelligence | |||
Smartphone/tablet viewing cannibalization
Mobile screens increasingly capture daytime entertainment minutes, limiting shared viewing occasions that traditionally justified large-screen upgrades. The Federal Trade Commission’s 2024 study highlights how streaming platforms over-index their UI design for handheld devices, reinforcing single-user consumption habits.[4]Source: FTC, “A Look Behind the Screen: Examining the Data Practices of Video Streaming Services,” ftc.gov Yet gaming and premium cinematic content remain television strongholds, tempering the cannibalization effect.
Price compression from low-cost Chinese brands
Vertical integration at TCL CSOT and Hisense’s localized assembly keeps bill-of-materials costs roughly 12–15% below the Korean incumbents. The resulting retail aggression drags mainstream ASPs lower, forcing premium brands to prove differentiated value via panel and platform exclusives.
*Our forecasts treat driver/restraint impacts as directional, not additive. The impact forecasts reflect baseline growth, mix effects, and variable interactions.
Segment Analysis
By Screen Size: Large Formats Cement Aspirational Demand
The 55-64 inch band retained a leading 34.02% shipment share in 2025, confirming its role as the mainstream sweet spot. However, the 75-inch-plus segment is set to grow fastest at 2.69% CAGR, outpacing overall US Smart TV market growth. Early adopters cite immersive gaming and theater-grade streaming as justification for purchasing panels that now cost under USD 2,000 at promotion. Samsung commands roughly one-third of ultra-large formats by leveraging its micro-LED supply chain and aggressive channel promotions. Entry-level sub-45-inch models continue sliding, squeezed by cheap tablets for personal viewing and by mid-sized sets that increasingly fit smaller apartments thanks to bezel minimization.
Installers report that wireless breakout boxes reduce setup time by almost 40%, accelerating acceptance of wall-mounted 75-inch screens in existing homes. ENERGY STAR data suggest power consumption per square inch is falling faster than panel area is rising, muting electricity-cost objections among energy-conscious buyers. Collectively, these trends mean that large-format displays will remain the headline growth driver inside the US Smart TV market.


By Resolution: 8K Finds Foothold Through Gaming
4K UHD reached 54.02% shipment share in 2025, having already become table stakes. The nascent 8K segment is projected to post a 3.17% CAGR, aided by AI-upscaling engines that mask source-content scarcity. Microsoft’s Xbox Series X and Sony’s PlayStation 5 Pro both enabled 8K output in 2025 firmware updates, and streaming providers have begun test runs of 8K VOD in limited markets. Upsell tactics pair 8K panels with shorter finance plans to offset sticker shock, ensuring early adopters rotate into the pool every 3-4 years. Full-HD models now survive mainly in hospitality and price-first retail doorbusters.
OLED providers argue that brightness gains close the perceived advantage of 8K over high-quality 4K HDR, but survey data show that early gamers disproportionately choose 8K sets for their benchmarking bragging rights. As compression codecs mature, bandwidth overhead for 8K streams will fall, removing one of the last technical hurdles to mass deployment.
By Panel Technology: OLED Narrows the Gap
LCD/LED technology still held 60.45% unit share in 2025, but OLED shipments are growing nearly 30 basis points above the overall US Smart TV market CAGR. LG’s four-stack architecture finally pushes peak HDR brightness above 1,500 nits, silencing the “dim-room only” critique. Meanwhile, Samsung’s quantum-dot OLED line rides cadmium-free certification to mitigate environmental-compliance risk. Mini-LED clusters give premium LCD sets almost OLED-like contrast, blurring distinctions for casual buyers and pushing price-driven segmentation into marketing rather than pure tech specs. Supply-chain hiccups in mini-LED boost OLED’s comparative availability, offering LG and Sony temporary leverage in Q4 product cycles.
Micro-LED demonstrations at CES 2025 hinted at mainstream form factors, yet wafer yields remain far from commercial economics. In the interim, OLED and mini-LED will continue their two-horse race to define premium tier differentiation inside the US Smart TV market.
By Price Band: Premium Growth Outpaces Volume
By price band, sets priced above USD 2,000 contributed 79.05% of premium-segment revenue in 2025 and are projected to rise at a 2.61% CAGR through 2031. Samsung and LG together absorbed more than half of that premium revenue, buttressed by panel IP, industrial design, and bundled subscription services. Finance promotions stretch payments over 36-months interest-free, shrinking the delta versus mid-tier monthly outlay. At the other end, sub-USD 500 models face withering margin pressure as TCL and Hisense monetize post-sale via targeted CTV ads rather than hardware markup.
Energy incentives dovetail with premium offerings: mini-LED backlights can exceed 3000 local-dimming zones without breaching California’s Tier 2 power budget. Premium buyers thus view energy efficiency as added justification for higher upfront spend. In middle bands (USD 1,000-1,999), brands fight to hold differentiation through software exclusives, cloud gaming clients, AI voice control, rather than raw display metrics alone.
By Operating System: Platform Wars Define Stickiness
Roku OS still accounts for roughly 38.12% of activated smart screens nationwide, yet Google TV is advancing 2.6% annually on the back of search and YouTube integration. LG’s webOS monetization success has prompted Samsung to relaunch Tizen’s ad-inventory exchange, driving double-digit CPM growth. Amazon’s Fire TV OS funnels Prime-centric household data back into the company’s retail flywheel, giving it an outsized advertising ROI despite smaller unit share. Hisense’s VIDAA U, while a niche player, stresses localized FAST channels to win over cord-cutters seeking free ad-supported programming.
Cloud gaming is rapidly becoming the operating-system killer feature. Microsoft’s 2025 expansion of Xbox Cloud Gaming to LG and Samsung models handed those brands an immediate 50+ title library without console purchase. As other platforms negotiate similar tie-ups, OS-level differentiation may hinge on latency optimization and controller-pairing simplicity. Simultaneously, state privacy laws could force opt-in prompts that curb data-harvesting depth, threatening the ad ARPU gap between closed and open OS ecosystems.
Competitive Landscape
The US Smart TV market shows moderate concentration: the top five vendors capture just above 70% of unit shipments, equating to a market-concentration score of 7. Samsung remains revenue leader, leveraging a deep R&D bench and economies of scale in both LCD and OLED substrates. LG’s pivot to platform revenue allowed it to improve unit economics despite ASP pressure. TCL’s vertical integration via TCL CSOT secures cost advantages, enabling aggressive price positioning without eroding gross margin excessively.
Strategic plays in 2025 center on service bundling. Samsung paired its flagship Neo QLED line with six months of Xbox Game Pass Ultimate, instantly differentiating from price-matched rivals. LG counters with freemium tiers on its webOS Channels FAST service, aiming to double ad impressions per active user. Hisense, intent on graduating from value tier, introduced a 110-inch mini-LED set below USD 3,000, undercutting Korean brands and redefining the ceiling for mainstream big-screen affordability.
Platform openness is the new battleground. Google and Amazon press for reference-design penetration, courting smaller assemblers to proliferate their OS footprint. Samsung and LG defend proprietary stacks by promising post-purchase feature drops: AI upscaling refinements, free trial gaming portals, and on-device language translation. The tug-of-war will intensify as ad budgets continue reallocating from linear TV to programmatic CTV, with platform control dictating revenue capture.
US Smart TV Industry Leaders
LG Electronics Inc.
Samsung Electronics Co. Ltd
Sharp Corporation
Sony Group Corporation
Panasonic Holdings Corporation
- *Disclaimer: Major Players sorted in no particular order

Recent Industry Developments
- January 2025: Microsoft and LG expanded Xbox Cloud Gaming to webOS televisions, giving Game Pass Ultimate subscribers direct access to more than 200 titles without a console.
- January 2025: LG Electronics reported KRW 87.73 trillion FY 2024 revenue, with webOS ad and content sales topping KRW 1 trillion for the first time.
- November 2024: Microsoft enabled streaming of purchased Xbox Store titles to Samsung Smart TVs, broadening cloud-gaming beyond subscription catalogs.
- August 2024: Nvidia and Microsoft introduced single-sign-on between GeForce Now and Xbox accounts, streamlining cloud access on Samsung Gaming Hub displays.


US Smart TV Market Report Scope
By Screen Size
| Up to 45" |
| 45-54" |
| 55-64" |
| 65-74" |
| 75" and Above |
By Resolution Type
| HDTV |
| Full HD |
| 4K UHD |
| 8K UHD |
By Panel Technology
| LCD/LED |
| QLED |
| OLED |
| Mini-LED |
By Price Band
| less than USD 500 |
| USD 500-999 |
| USD 1,000-1,999 |
| More than USD 2,000 |
By Operating System
| Roku OS |
| Google/Android TV |
| Tizen OS |
| webOS |
| Fire TV OS |
| VIDAA U |
| By Screen Size | Up to 45" |
| 45-54" | |
| 55-64" | |
| 65-74" | |
| 75" and Above | |
| By Resolution Type | HDTV |
| Full HD | |
| 4K UHD | |
| 8K UHD | |
| By Panel Technology | LCD/LED |
| QLED | |
| OLED | |
| Mini-LED | |
| By Price Band | less than USD 500 |
| USD 500-999 | |
| USD 1,000-1,999 | |
| More than USD 2,000 | |
| By Operating System | Roku OS |
| Google/Android TV | |
| Tizen OS | |
| webOS | |
| Fire TV OS | |
| VIDAA U |


Key Questions Answered in the Report
What is the projected shipment volume for the US Smart TV market in 2031?
Shipments are expected to reach 58.01 million units by 2031.
Which screen-size segment will expand fastest through 2031?
75-inch-and-above sets are forecast to grow at a 2.69% CAGR.
How are TV makers offsetting hardware margin pressure?
They monetize connected-TV ad inventory; LG’s webOS platform, for instance, generated over KRW 1 trillion in 2024 revenue.
Which operating system currently leads U.S. activations?
Roku OS retains the largest footprint, covering roughly 38.12% of active smart screens.
Page last updated on:


