Turkey Container Glass Market Size and Share
Market Overview
| Study Period | 2019 - 2030 |
|---|---|
| Base Year For Estimation | 2024 |
| Forecast Data Period | 2025 - 2030 |
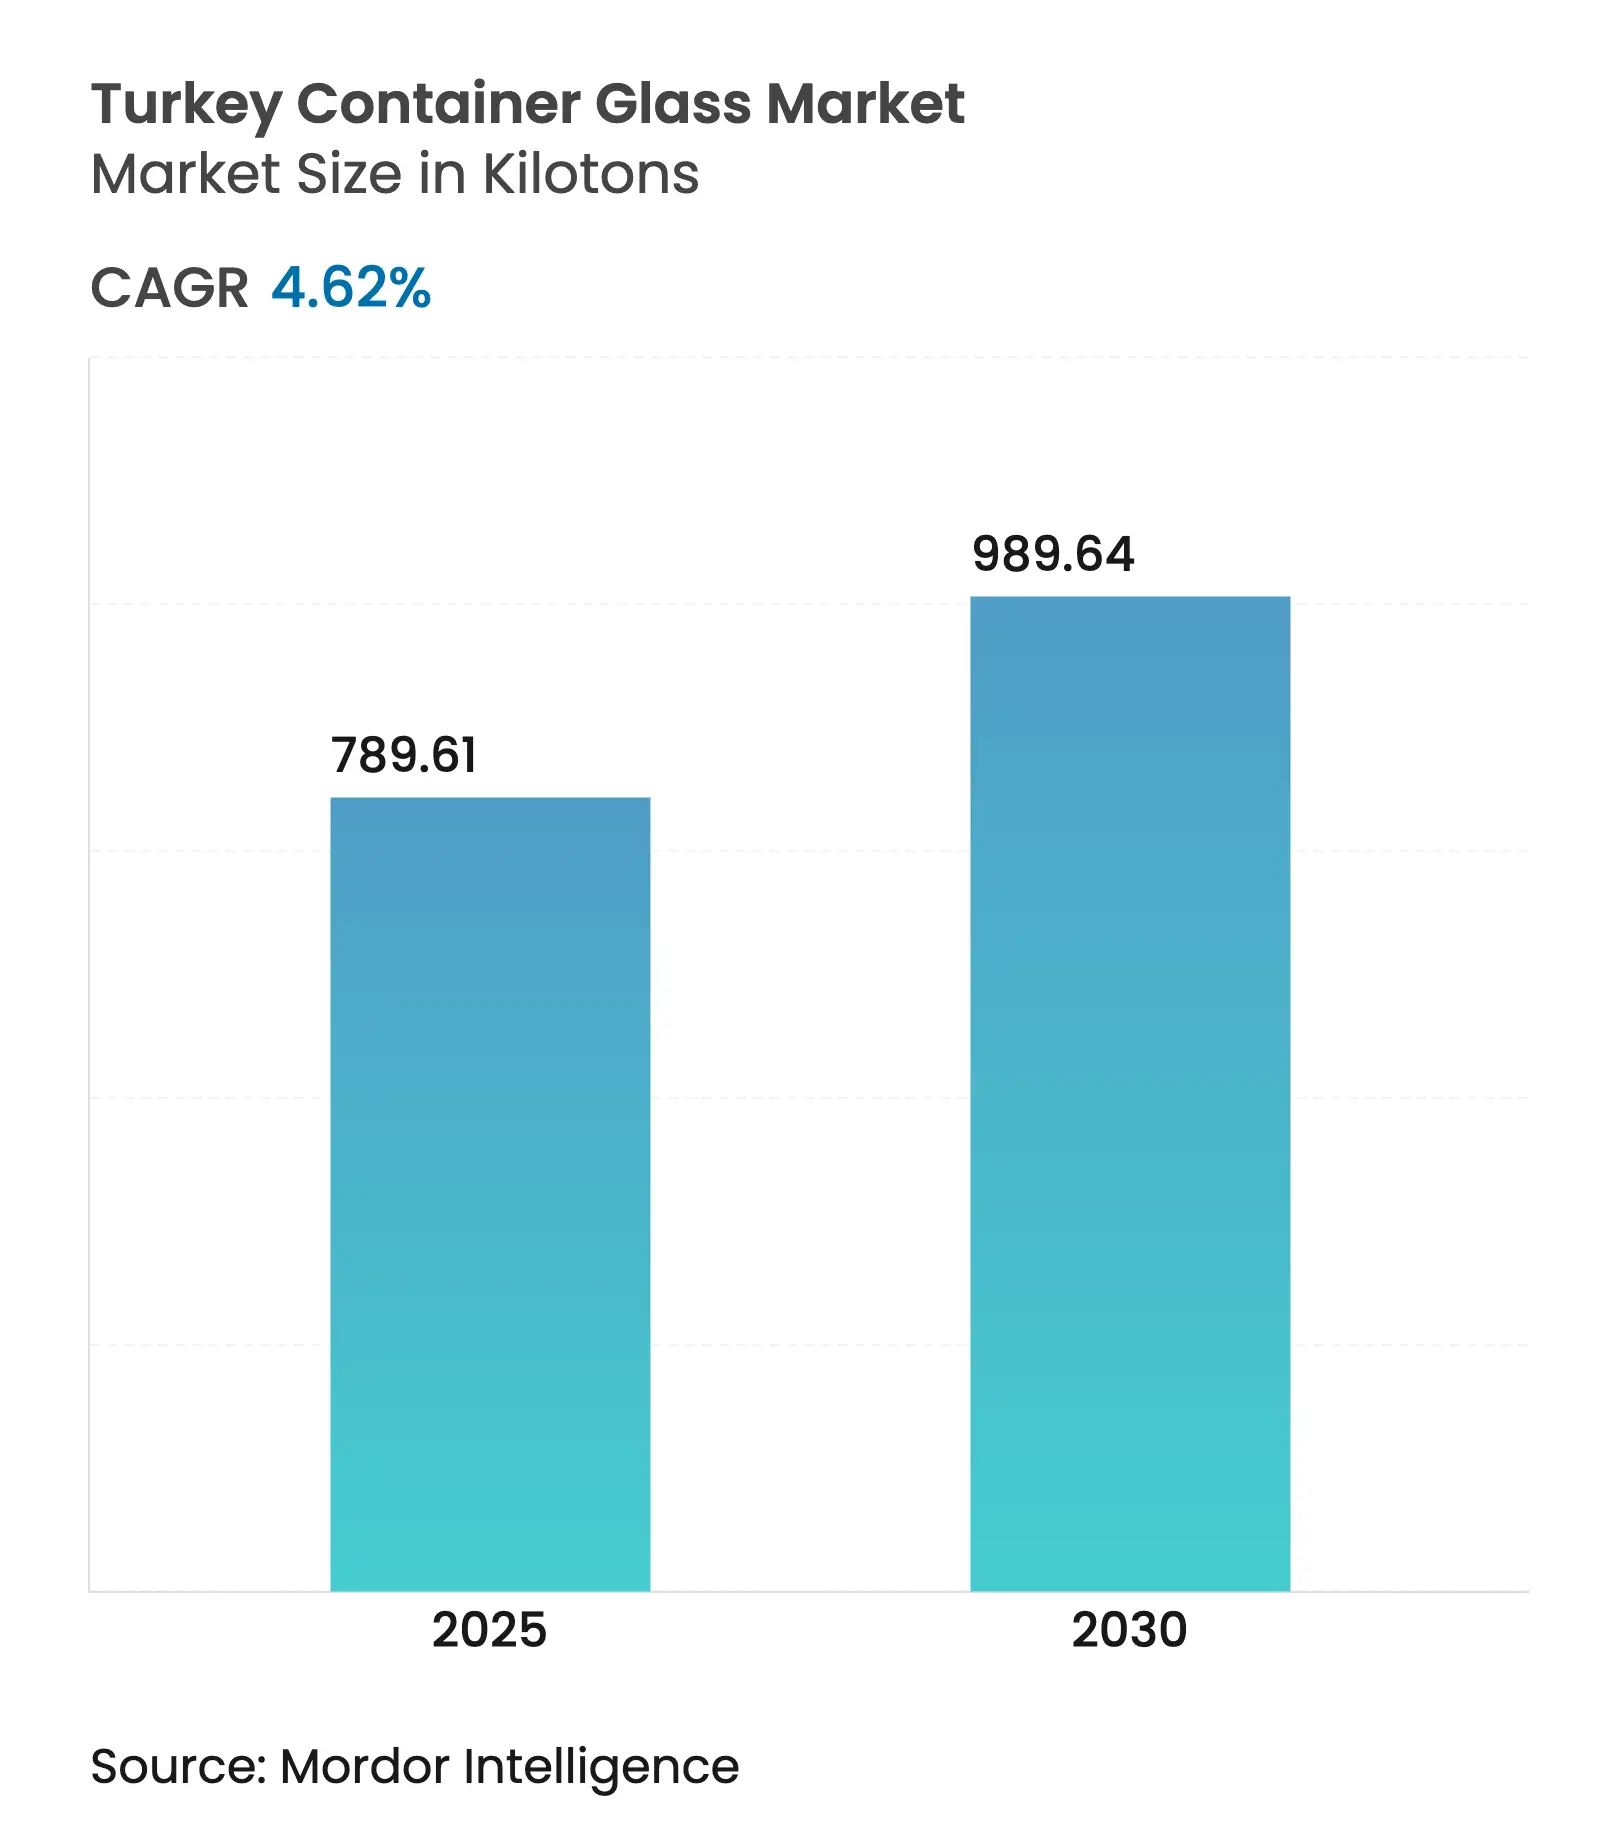
| Market Volume (2025) | 789.61 kilotons |
| Market Volume (2030) | 989.64 kilotons |
| CAGR | 4.62 % |
| Market Concentration | Medium |
Major Players *Disclaimer: Major Players sorted in no particular order. Image © Mordor Intelligence. Reuse requires attribution under CC BY 4.0. |
Turkey Container Glass Market Analysis by Mordor Intelligence
The Turkey container glass market size reached 789.61 kilotons in 2025 and is forecast to expand at a 4.62% CAGR to 989.64 kilotons by 2030, underscoring Turkey’s role as a regional manufacturing hub. Current expansion reflects lower industrial energy tariffs-industrial natural-gas prices fell 13-25% and electricity costs dropped 16% in January 2025-strengthening furnace economics. Rising soda-ash output, with the nation ranked Europe’s second-largest exporter, ensures raw-material security and supports production scalability. Robust tourism recovery to 62.3 million visitors in 2024 is lifting on-premises beverage demand, while pharmaceutical exports rose 15.8% to USD 2.2 billion in 2023, driving specialized amber and flint container uptake. Together, these factors position the Turkey container glass market for stable mid-single-digit growth through the decade.
Key public-policy signals reinforce momentum. The national deposit-return system, launched in 2024, targets 20-25 billion beverage containers annually and structurally increases cullet availability, supporting circular-economy targets. EU Regulation 2025/40 mandating 100% recyclable packaging by 2030 further tilts export-oriented demand in favor of glass. Capacity additions such as Şişecam’s USD 174 million dual-furnace expansion in Eskişehir.
Key Report Takeaways
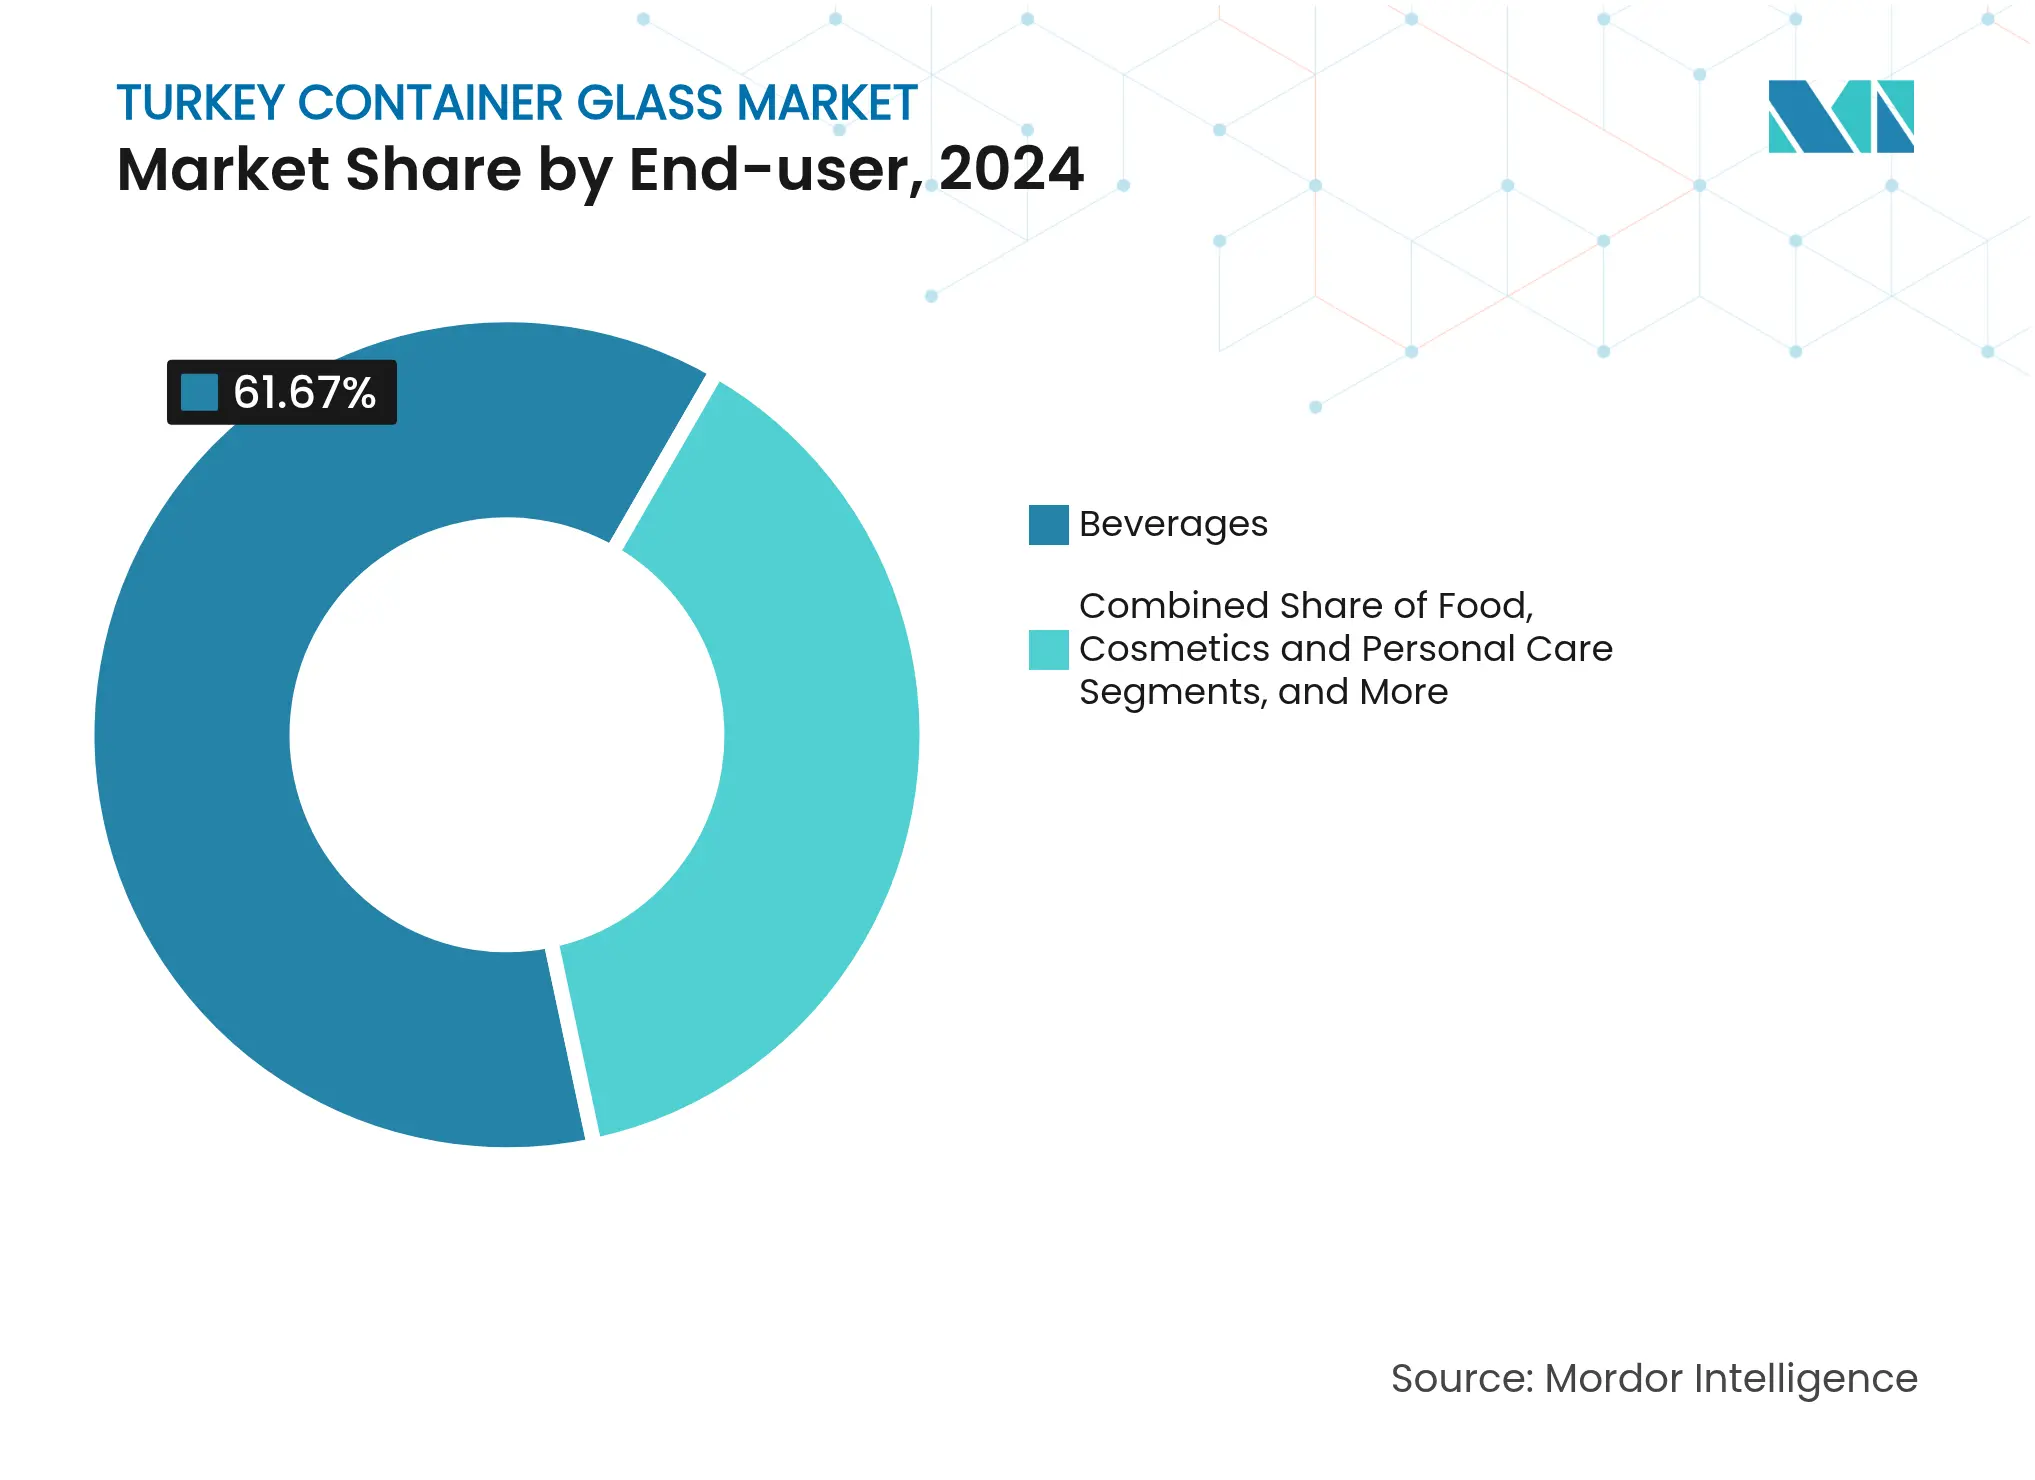
- By end-user, the beverages segment captured 61.67% of the Turkey container glass market share in 2024.
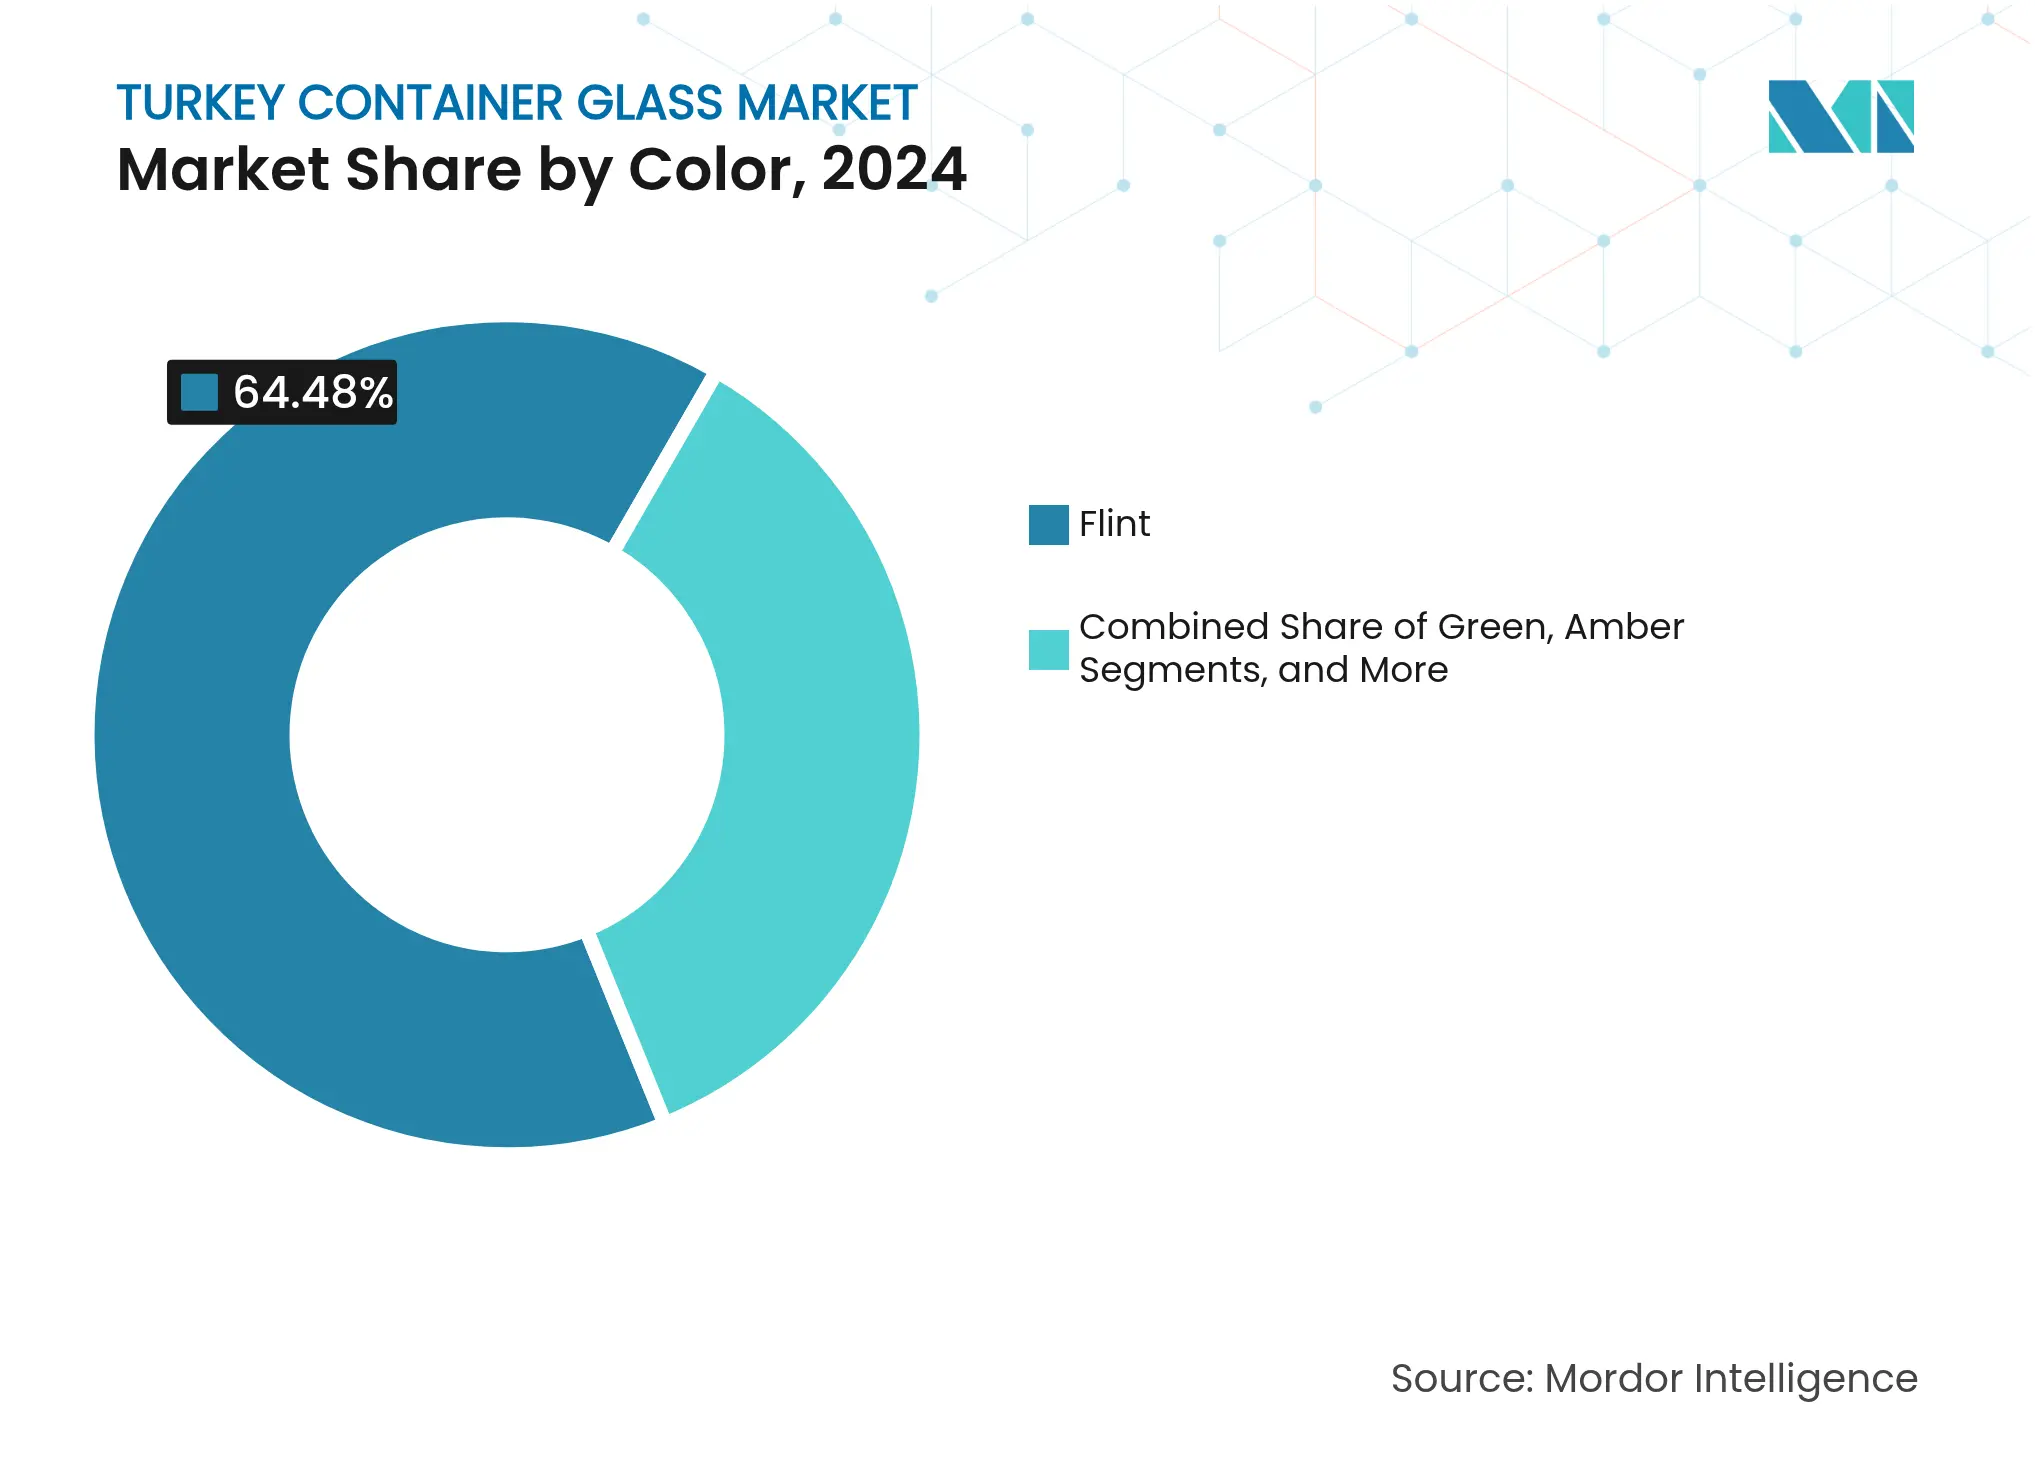
- By color, the amber segment is projected to grow at a 5.62% CAGR between 2025-2030.
Turkey Container Glass Market Trends and Insights
Drivers Impact Analysis
| Driver | (~) % Impact on CAGR Forecast | Geographic Relevance | Impact Timeline | |||
|---|---|---|---|---|---|---|
Shift toward
deposit-return schemes boosts reusable glass demand
Shift toward
deposit-return schemes boosts reusable glass demand
| +0.8% | National, pilot expansion from Sakarya | Medium term (2-4 years) |
(~) % Impact on
CAGR Forecast
:
+0.8%
|
Geographic
Relevance
:
National, pilot
expansion from Sakarya
|
Impact Timeline
:
Medium term (2-4
years)
|
Craft beverage boom
requiring premium small-batch bottles
Craft beverage boom
requiring premium small-batch bottles
| +0.6% | Urban centers: Istanbul, Ankara, İzmir | Short term (≤ 2 years) | |||
Rapid expansion of
Turkey’s pharmaceuticals export hub
Rapid expansion of
Turkey’s pharmaceuticals export hub
| +1.2% | National, Ankara–Istanbul corridor | Long term (≥ 4 years) | |||
EU Green Deal
alignment incentivizing recyclable packaging
EU Green Deal
alignment incentivizing recyclable packaging
| +0.9% | National, EU export focus | Long term (≥ 4 years) | |||
Surging tourism is driving
on-premises glass consumption
Surging tourism is driving
on-premises glass consumption
| +0.7% | Coastal regions: Antalya, Muğla, Mediterranean coast | Short term (≤ 2 years) | |||
Emerging artisanal
food brands choosing glass for differentiation
Emerging artisanal
food brands choosing glass for differentiation
| +0.4% | Urban premium markets | Medium term (2-4 years) | |||
| Source: Mordor Intelligence | ||||||
Shift Toward Deposit-Return Schemes Boosts Reusable Glass Demand
Turkey’s mandatory deposit-return system, launched in 2024, aims to recover 20-25 billion beverage containers each year, roughly half the nation’s beverage-packaging volume. Infrastructure involves 2,000 reverse-vending machines and 5,000 additional collection points, yet glass currently achieves only a 10% recovery rate versus 30% for PET and 50% for aluminum. Istanbul University research shows that crushing bottles before transport yields 65% space-efficiency gains, trimming logistics costs by 50% on 100-kilometer hauls.[1]Sibel Aydın et al., “Effect of Volume Reduction Methods on Beverage Packaging Waste Recycling,” International Journal of Environmental Science and Technology, springer.com Economic modeling forecasts 100 billion TRY (USD 3.04 billion) in savings over 20 years, 20,000 direct jobs, and USD 150-200 million annual import substitution-critical advantages for the Turkey container glass market as cullet availability lowers furnace energy demand and raw-material costs. As pilot programs move nationwide, stable feedstock flows are expected to lift the recycled content in new bottles and enhance competitiveness against alternative substrates.
Craft Beverage Boom Requiring Premium Small-Batch Bottles
Microbreweries and craft distillers clustered in Istanbul, Ankara, and İzmir are scaling niche production runs that favor premium glass formats for differentiation and shelf appeal. Urban consumers demonstrate willingness to pay for artisanal labels, a trend mirrored in boutique wine and cold-brew coffee segments that necessitate small-lot bottle runs with bespoke embossing and decoration. Şişecam and several contract decorators have responded by offering flexible production lines capable of economically short batches under 100,000 units, thereby expanding addressable demand within the Turkey container glass market. The premiumization wave strengthens glass’s value proposition over cans and PET, particularly when brand storytelling and tactile cues influence purchase decisions in crowded retail environments.
Rapid Expansion of Turkey’s Pharmaceuticals Export Hub
Pharmaceutical exports rose 15.8% to USD 2.2 billion in 2023, while domestic production satisfied 90.6% of unit demand, reflecting concerted industrial-policy support. Export-to-import coverage climbed from 23% in 2017 to 48% in H1 2024, evidencing competitiveness gains. High-purity amber and flint vials that block UV exposure are mandatory for biologics and photosensitive formulations, channeling incremental volumes into the Turkey container glass market. Regulatory amendments easing biotech licensing, coupled with state procurement incentives, spur capacity investment in parenteral and ophthalmic packaging lines. These specialized containers command premium margins and longer qualification cycles, anchoring predictable multiyear demand that tempers cyclical swings linked to beverage segments.
EU Green Deal Alignment Incentivizing Recyclable Packaging
EU Regulation 2025/40 requires all packaging placed on the single market to be 100% recyclable by 2030, with interim reduction targets of 5% by 2030 and 10% by 2035.[2]NSF Editorial Team, “New EU Regulation 2025/40 on Packaging and Packaging Waste,” nsf.org Turkey’s Twelfth Development Plan (2024-2028) explicitly endorses compliance, designating non-metallic minerals-including glass, as priority sectors for green and digital transformation. Export-oriented fillers are already redesigning SKUs to eliminate mixed-material sleeves and composite closures that undermine recyclability. Glass’s intrinsic ability to retain quality after multiple cycles positions it as a low-risk solution compared with multilayer plastics struggling with PFAS and BPA restrictions, particularly after the EU’s 2024/3190 ban on bisphenol A in food-contact materials. Consequently, the regulatory tailwind fortifies the Turkey container glass market’s long-term growth outlook in pharmaceuticals, cosmetics, and premium food exports.
Restraints Impact Analysis
| Restraint | (~) % Impact on CAGR Forecast | Geographic Relevance | Impact Timeline | |||
|---|---|---|---|---|---|---|
High natural-gas price volatility is inflating melting
costs
High natural-gas price volatility is inflating melting
costs
| −1.1% | National, industrial zones | Short term (≤ 2 years) |
(~) % Impact on CAGR Forecast
:
−1.1%
|
Geographic Relevance
:
National, industrial zones
|
Impact Timeline
:
Short term (≤ 2 years)
|
Competition from lightweight PET in carbonated drinks
Competition from lightweight PET in carbonated drinks
| −0.8% | National, urban beverage markets | Medium term (2-4 years) | |||
Port congestion is disrupting soda-ash imports
Port congestion is disrupting soda-ash imports
| −0.5% | Coastal industrial regions | Short term (≤ 2 years) | |||
Limited domestic cullet collection infrastructure
Limited domestic cullet collection infrastructure
| −0.6% | National, municipal gaps | Medium term (2-4 years) | |||
| Source: Mordor Intelligence | ||||||
High Natural Gas Price Volatility Inflating Melting Costs
Energy accounts for 25-30% of total container-glass production costs, making furnace economics highly sensitive to fuel swings. Although industrial tariffs fell 13-25% in January 2025, Turkey still imports all of its natural gas, and projected consumption will rise to 53.3 billion Sm³ in 2025 from 51.1 billion Sm³ in 2024. Changes in pipeline supply shares-Russia’s portion declined to 39% in 2022-introduce geopolitical risk that can rapidly widen input-cost spreads versus European peers with diversified LNG contracts. Academic optimization models highlight that every 10% hike in gas prices raises melting-tank variable costs by roughly 3%, compressing margins and impairing investment appetite for new capacity. While some producers co-fire furnaces with petroleum coke or trial hydrogen blends, widespread retrofits require significant capex and regulatory clarity on carbon pricing. Persistent volatility therefore exerts a tangible drag on the Turkey container glass market in the near term.
Limited Domestic Cullet Collection Infrastructure
Turkey’s municipal waste-recovery rate stood at 30.13% in 2022, and glass represented a modest 2.6 million tons of cumulative material recycled under the Zero Waste program. Budget allocations for solid-waste management average 5% of municipal spending versus the World Bank’s recommended 20-50%, leaving collection networks under-resourced. Enforcement actions that curbed informal scavenging further squeezed feedstock flows, while formal facilities report high rejection rates from color-mixed or contaminated shards that fail furnace specifications. Academic studies in Sinop show strong income-linked variance: districts in the top quintile generate nearly double the glass discards of lower-income zones, complicating route-planning efficiency.[3]Sinop University Researchers, “Recycling of Municipal Solid Waste in Sinop,” dergipark.org.tr Şişecam’s color-sorted cullet plants partially offset shortfalls, yet insufficient throughput raises virgin-raw-material dependence and inflates melting energy per ton, muting circular-economy gains for the Turkey container glass market. Medium-term corrective measures hinge on the nationwide roll-out of deposit-return infrastructure and municipal incentives that reward high-purity stream capture.
Segment Analysis
By End User: Beverages Retain Scale While Cosmetics Accelerate
The beverage segment dominated with 61.67% of the Turkey container glass market share in 2024, reflecting historic alliances between bottlers and local furnace operators. Segment tonnage is forecast to track a mid-single-digit trajectory despite lightweight-PET pressure because on-premises sales tied to tourism favor glass for perceived quality and reuse economics. The Turkey container glass market size attached to beverages is projected to reach 615 kilotons by 2030, equal to a 4.1% CAGR, supported by craft beer and premium mineral-water launches. PET substitution remains acute in colas where Coca-Cola İçecek trialed recycled-PET bottles, yet brand owners still specify glass for flagship SKUs aimed at hospitality channels.
Pharmaceutical, cosmetics, and personal-care fillers represent the fastest-growing demand pool, expanding at a 6.01% CAGR to 2030 on the strength of export-led drug manufacturing and premium beauty trends. Amber vials and flint jars are increasingly selected for light-sensitive formulations, lifting average selling price and margin capture within the Turkey container glass market. Boutique cosmetics houses leverage frosted-glass aesthetics for shelf impact, while parenteral-drug makers require stringent dimensional tolerances that few offshore rivals can match, reinforcing domestic kiln utilization.
Note: Segment shares of all individual segments available upon report purchase
By Color: Flint Holds Lead, Amber Gains
Flint glass accounted for 64.48% of the Turkey container glass market share in 2024, favored across food, beverage, and cosmetics lines seeking product visibility. The Turkey container glass market size for flint containers is forecast to climb to 650 kilotons by 2030 on sustained demand from clear-label trends. Growth rates, however, will lag those of amber bottles that protect biologics and craft beers from UV-induced spoilage. Amber capacity is projected to post a 5.62% CAGR through 2030, narrowing the historical volume gap as pharmaceutical exports climb to USD 3 billion by mid-decade.
Green glass maintains a secondary niche within wine and mainstream beer, but volume growth stays modest given craft brewers’ shift to amber for differentiation. Şişecam’s furnace campaigns now alternate between flint and amber to optimize color economics, and its cullet-sorting investment further cuts melt energy by 20% when recycled feed exceeds 50% batch weight. Color-specific momentum supports a diversified output mix that hedges against end-use volatility inside the broader Turkey container glass market.
Geography Analysis
Turkey’s container-glass manufacturing belt arcs from Eskişehir through Kütahya to Bilecik, co-locating furnaces near soda-ash deposits and rail corridors. The provincial cluster handled more than 70% of national output in 2024, enabling rapid dispatch to Marmara ports for European exports. Government-brokered natural-gas discounts of up to 25% in 2025 conferred an energy-cost edge over EU peers, underpinning the Turkey container glass market size advantage in the short run.
Marmara and Aegean coastal regions absorb sizable domestic tonnage owing to dense beverage-bottling and pharmaceutical-filling footprints. Istanbul’s logistics hub status expedites container turnaround, while Izmir’s free-trade zone offers duty relief on imported inputs. The Turkey container glass market share tied to exports into the EU is poised to climb as Regulation 2025/40 tightens recyclability mandates that favor glass over multi-material plastics.
International diversification is gathering pace. Ciner Glass’s Belgian plant, coming online in 2027, will ship to Germany, France, and the U.K. within 24 hours, shortening lead times and reducing freight emissions for clients who previously sourced from Turkey. Such outbound FDI crystallizes Turkey’s transition from purely domestic producer to an integrated pane-European supplier, indirectly relieving capacity pressure at home and stabilizing furnace run rates across the Turkey container glass market.

Competitive Landscape
Market Concentration
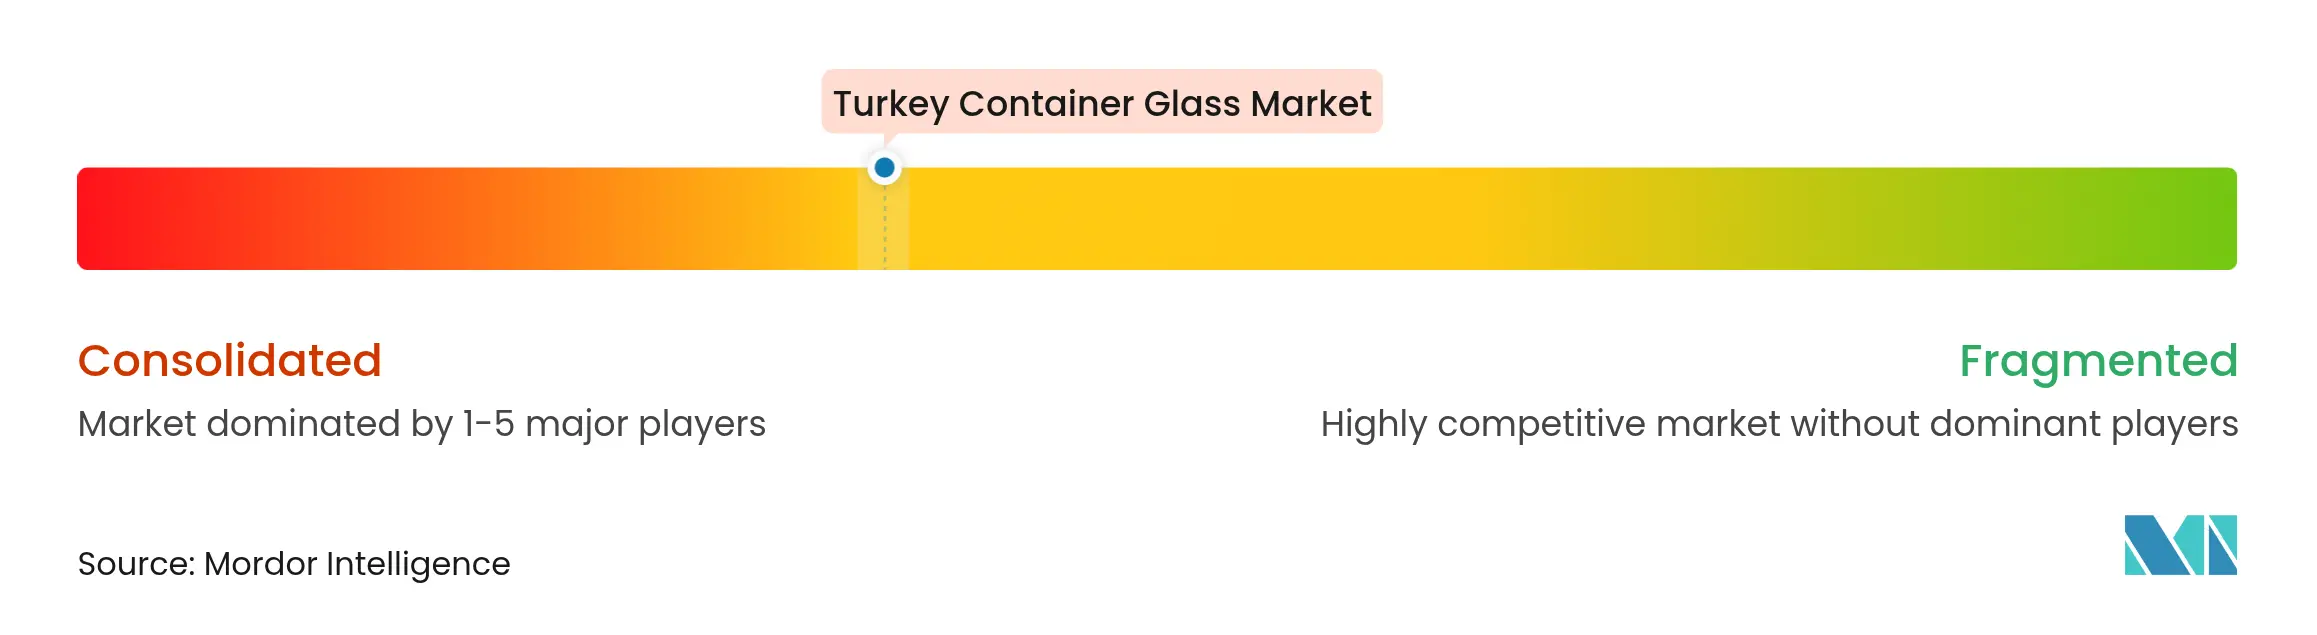
Moderate concentration characterizes the Turkey container glass market, with Şişecam controlling roughly two-thirds of installed capacity through 10 sites across four countries. Its Eskişehir double-furnace addition in 2024 lifted the complex to 1 million ton annual output, the world’s largest single-site glass facility. Vertical integration from soda ash to cullet processing shields Şişecam from raw-material volatility and aligns with EU-bound recyclability thresholds.
Ciner Glass is scaling rapidly; the Belgian greenfield aims for 1,300 metric tons daily capacity and signals ambition to penetrate premium beer and food-jar segments in Western Europe. Anadolu Cam and Gürallar ArtCraft maintain niche positions in specialty bottles and high-end tableware, respectively, banking on flexible batch sizes and design services. Strategic moves in 2024-25 focused on digital furnace controls, with Şişecam deploying predictive-maintenance analytics that cut unplanned downtime by 8%, and Anadolu Cam piloting electric-booster technology to trim specific-energy consumption by 5%.
Sustainability credentials are center-stage. Leading players are committed to lifting the average recycled content in domestic glass packaging to 60% by 2028, in tandem with deposit-return rollouts; pilot furnaces already hit 70% cullet ratios on select amber lines. Corporate PPA (power-purchase-agreement) announcements for wind and solar arrays totaled 180 MW in 2025, buffering electricity-price shocks while shrinking Scope 2 emissions footprints. These initiatives reinforce competitive differentiation and satisfy multinational customer scorecards, buttressing margins inside the Turkey container glass market.
Turkey Container Glass Industry Leaders

*Disclaimer: Major Players sorted in no particular order
Recent Industry Developments
- April 2025: Turkey’s Electrical Engineers Chamber reported an electricity-generation mix of 27% natural gas and 34% coal in Feb 2025, with installed capacity at 116,852 MW.
- March 2025: Coca-Cola İçecek completed 2024 with investments of 12.5 billion TRY (USD 380.3 million), allocating 25% to Turkish plants, underpinning additional returnable-glass capacity
- January 2025: The EU formally adopted Regulation 2024/3190 banning BPA in food-contact materials, compelling closure suppliers to shift to BPA-free liners.
- March 2024: Şişecam brought two new furnaces online at Eskişehir after a USD 174 million spend, lifting complex capacity to 1 million tons.
Table of Contents for Turkey Container Glass Industry Report
1. INTRODUCTION
- 1.1Study Assumptions and Market Definition
- 1.2Scope of the Study
2. RESEARCH METHODOLOGY
3. EXECUTIVE SUMMARY
4. MARKET LANDSCAPE
- 4.1Market Overview
- 4.2Market Drivers
- 4.2.1Shift Toward Deposit-Return Schemes Boosts Reusable Glass Demand
- 4.2.2Craft Beverage Boom Requiring Premium Small-Batch Bottles
- 4.2.3Rapid Expansion of Turkey's Pharmaceuticals Export Hub
- 4.2.4EU Green Deal Alignment Incentivizing Recyclable Packaging
- 4.2.5Surging Tourism Driving On-Premises Glass Consumption
- 4.2.6Emerging Artisanal Food Brands Choosing Glass for Differentiation
- 4.3Market Restraints
- 4.3.1High Natural Gas Price Volatility Inflating Melting Costs
- 4.3.2Competition from Lightweight PET in Carbonated Drinks
- 4.3.3Port Congestion Disrupting Soda Ash Imports
- 4.3.4Limited Domestic Cullet Collection Infrastructure
- 4.4PESTEL Analysis
- 4.5Industry Value Chain Analysis
- 4.6Container Glass Furnace Capacity and Locations in Turkey
- 4.6.1Plant Locations and Year of Commencement
- 4.6.2Production Capacities
- 4.6.3Types of Furnaces
- 4.6.4Color of Glass Produced
- 4.7Export-Import Data of Container Glass - Covering Key Import and Export Destinations
- 4.7.1Import Volume and Value, 2021-2024
- 4.7.2Export Volume and Value, 2021-2024
- 4.8Porter's Five Forces Analysis
- 4.8.1Threat of New Entrants
- 4.8.2Bargaining Power of Suppliers
- 4.8.3Bargaining Power of Buyers
- 4.8.4Threat of Substitutes
- 4.8.5Competitive Rivalry
- 4.9Raw Material Analysis
- 4.10Recycling Trends for Glass Packaging
- 4.11Demand vs Supply Analysis for Glass Packaging
5. MARKET SIZE AND GROWTH FORECASTS (VOLUME)
- 5.1By End-user
- 5.1.1Beverages
- 5.1.1.1Alcoholic
- 5.1.1.1.1Beer
- 5.1.1.1.2Wine
- 5.1.1.1.3Spirits
- 5.1.1.1.4Other Alcoholic Beverages (Cider and Other Fermented Drinks)
- 5.1.1.2Non-Alcoholic
- 5.1.1.2.1Juices
- 5.1.1.2.2Carbonated Drinks (CSDs)
- 5.1.1.2.3Dairy Product Based Drinks
- 5.1.1.2.4Other Non-Alcoholic Beverages
- 5.1.2Food (Jam, Jelly, Marmalades, Honey, Sausages and Condiments, Oil, Pickles)
- 5.1.3Cosmetics and Personal Care
- 5.1.4Pharmaceuticals (excluding Vials and Ampoules)
- 5.1.5Perfumery
- 5.2By Color
- 5.2.1Green
- 5.2.2Amber
- 5.2.3Flint
- 5.2.4Other Colors
6. COMPETITIVE LANDSCAPE
- 6.1Market Concentration
- 6.2Strategic Moves and Developments
- 6.3Company Market Share Analysis, (Based on Latest Production Capacity)
- 6.4Company Profiles (includes Global level Overview, Market level overview, Core Segments, Financials as available, Strategic Information, Market Rank/Share for key companies, Products and Services, and Recent Developments)
- 6.4.1Sisecam Glass Packaging Group
- 6.4.2Gurok Turizm ve Madencilik A.S.
- 6.4.3Basturk Cam Group
- 6.4.4Marmara Cam Sanayi A.S.
- 6.4.5PARK CAM Sanayi ve Ticaret A.S. Factory
- 6.4.6Atlas Copco Group
- 6.4.7Ciner Glass Ltd.
- 6.4.8Ardagh Group S.A.
- 6.4.9Verallia S.A.
- 6.4.10O-I Glass Inc.
- 6.4.11Gerresheimer AG
- 6.4.12Saverglass SAS
- 6.4.13Vetropack Holding AG
- 6.4.14BA Glass B.V.
- 6.4.15Heinz-Glas GmbH and Co. KGaA
- 6.4.16Stoelzle Oberglas GmbH
- 6.4.17Anchor Glass Container Corporation
- 6.4.18Vetri Speciali S.p.A.
- 6.4.19Berlin Packaging LLC
- 6.4.20Wiegand-Glas GmbH
7. MARKET OPPORTUNITIES AND FUTURE OUTLOOK
- 7.1White-space and Unmet-Need Assessment
Turkey Container Glass Market Report Scope
Glass Containers refer to clean bottles and jars made from glass. The scope excludes windows and other non-container glass products. Container glass is used in the alcoholic and non-alcoholic beverage industries due to its ability to maintain chemical inertness, sterility, and non-permeability. Glass packaging is valued for its unique properties, including its transparency, inertness, and ability to preserve the quality and integrity of its contents.
Turkey container glass market is segmented by end-user vertical (beverages [alcoholic beverages (beer, wine, spirits, and other alcoholic beverages {cider and other fermented drinks}), non-alcoholic beverages (juices, carbonated drinks (CSDs), dairy product-based drinks, other non-alcoholic beverages)], food [jam, jelly, marmalades, honey, sausages and condiments, oil, pickles], cosmetics and personal care, pharmaceuticals (excluding vials and ampoules), and perfumery), by color (green, amber, flint and other colors). The report offers market forecasts and size in volume (kilotons) for all the above segments.