Tunisia Container Glass Market Size and Share
Market Overview
| Study Period | 2020 - 2031 |
|---|---|
| Forecast Data Period | 2026 - 2031 |
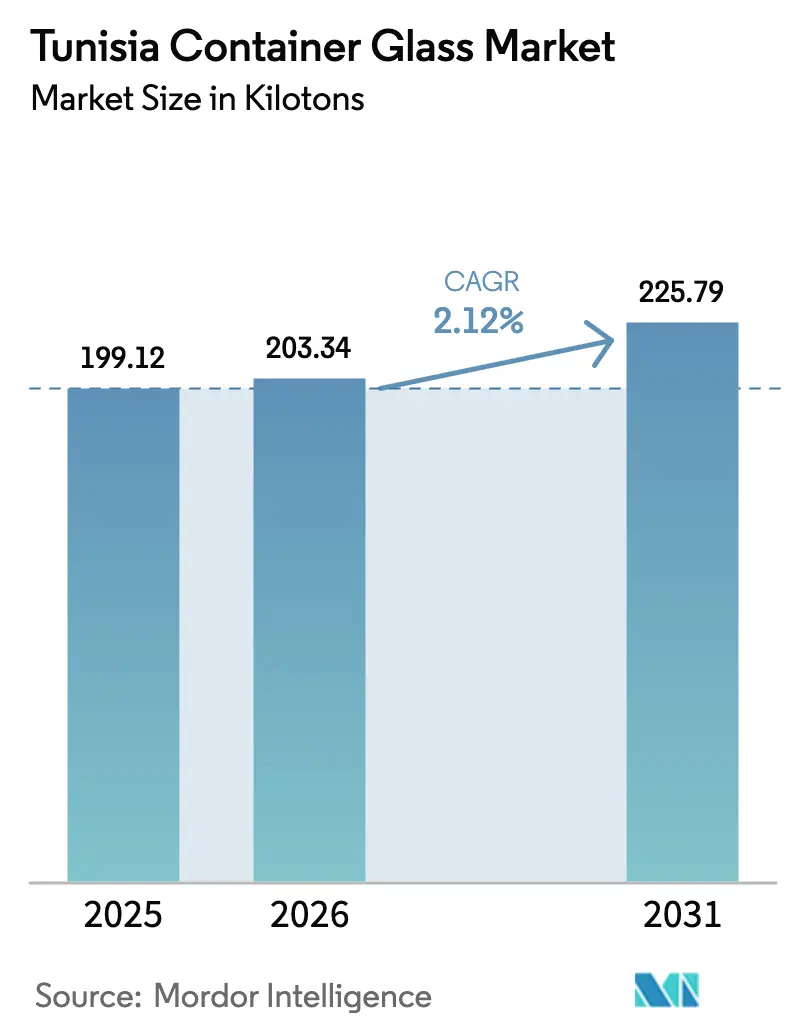
| Base Year Market Size (2025) | 199.12 kilotons |
| Market Volume (2026) | 203.34 kilotons |
| Market Volume (2031) | 225.79 kilotons |
| Growth Rate (2026 - 2031) | 2.12% CAGR |
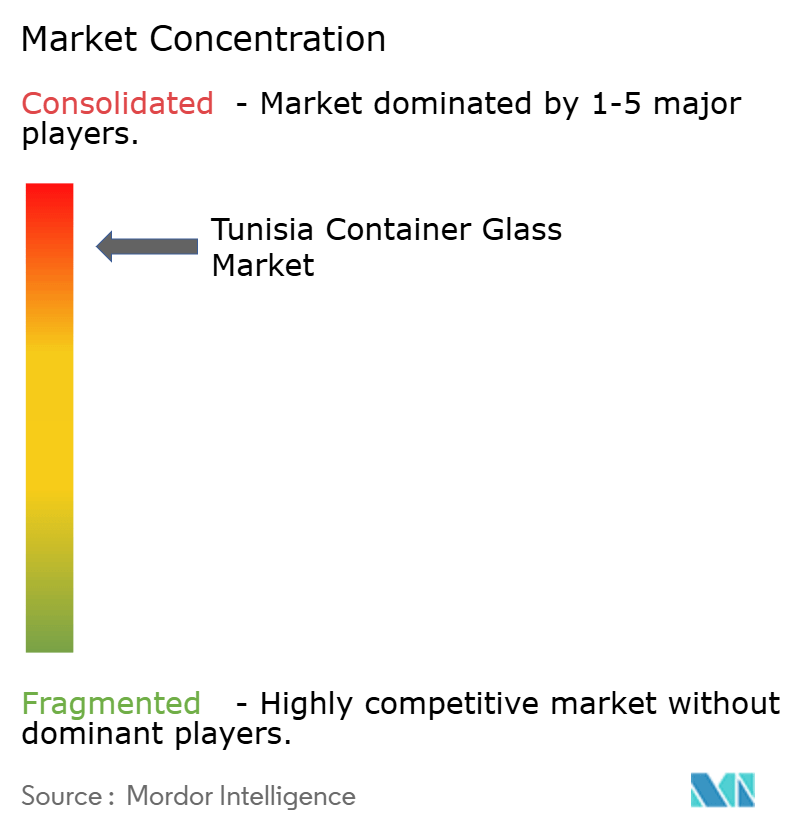
| Market Concentration | High |
Major Players *Disclaimer: Major Players sorted in no particular order Image © Mordor Intelligence. Reuse requires attribution under CC BY 4.0. | |
Tunisia Container Glass Market Analysis by Mordor Intelligence
The Tunisian container glass market size was valued at 199.12 kilotons in 2025 and estimated to grow from 203.34 kilotons in 2026 to reach 225.79 kilotons by 2031, at a CAGR of 2.12% during the forecast period (2026-2031). Energy-efficient furnaces, the migration of export-driven packers toward reusable formats, and sustained consumer demand for bottled water shape current growth. Cost leadership stems from industrial electricity priced at EUR 0.1066 per kWh (USD 0.12 per kWh) and natural gas at EUR 0.1712 per m³ (USD 0.19 per m³), which together lower the entry barrier for new capacity. Investment inflows into Tunisia’s ceramics and glass corridor climbed 46.6% in 2023, underscoring rising confidence among foreign and domestic stakeholders.[1]Invest in Tunisia – FIPA, “Factor Cost in Tunisia 2025,” INVESTINTUNISIA.TN Beverage packagers continue to dominate volumes, yet diversification into cosmetics, personal care, and pharmaceuticals accelerates margin expansion. Regulatory alignment with European Union collection and reuse mandates positions container glass ahead of alternative formats, which face stricter end-of-life obligations.
Key Report Takeaways
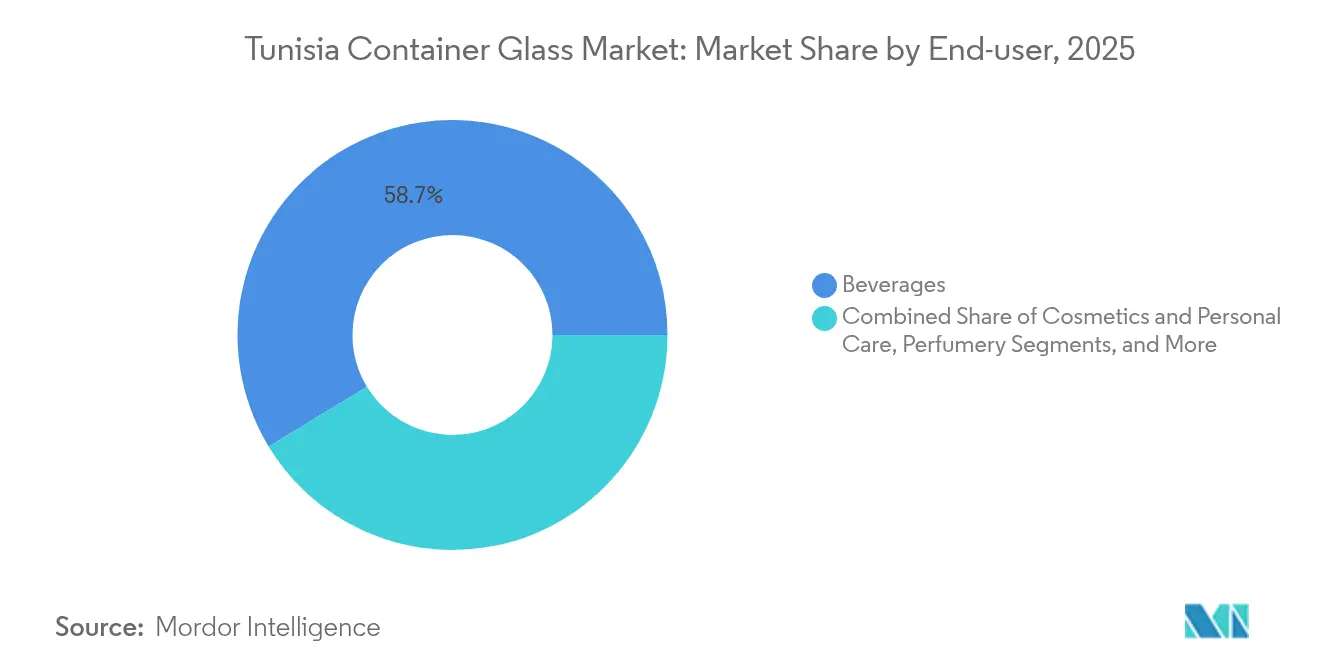
- By end-user, beverages captured 58.67% of the Tunisia container glass market share in 2025.
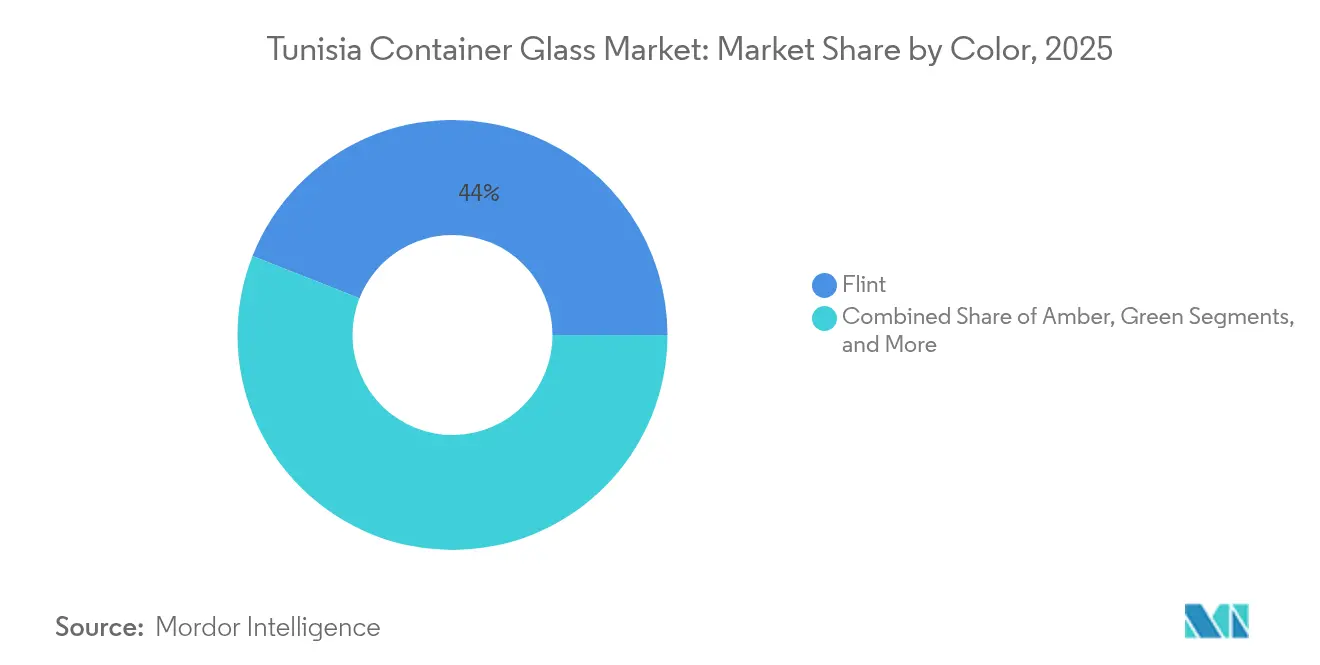
- By color, the Tunisia container glass market for amber glass is projected to grow at a 3.72% CAGR between 2026-2031.
Note: Market size and forecast figures in this report are generated using Mordor Intelligence’s proprietary estimation framework, updated with the latest available data and insights as of 2026.
Tunisia Container Glass Market Trends and Insights
Drivers Impact Analysis*
| Driver | (~) % Impact on CAGR Forecast | Geographic Relevance | Impact Timeline |
|---|---|---|---|
| Rising demand for premium bottled olive oil | +0.4% | National – export focus on Europe | Medium term (2-4 years) |
| Shift toward sustainable packaging in beverages | +0.3% | Global – EU influence | Long term (≥ 4 years) |
| Expansion of Tunisia’s pharmaceutical fill-finish capacity | +0.2% | National – regional export reach | Medium term (2-4 years) |
| Government recycling targets and EPR schemes | +0.2% | National rollout | Short term (≤ 2 years) |
| Solar energy integration lowering furnace energy cost | +0.1% | National, industrial zones | Long term (≥ 4 years) |
| EU deposit return rules requiring traceable glass packaging | +0.3% | EU export markets | Medium term (2-4 years) |
| Source: Mordor Intelligence | |||
Rising demand for premium bottled olive oil
Export receipts from olive oil reached EUR 1.159 billion (USD 1.275 billion) in the first seven months of the 2023-24 fiscal year, yet bottles accounted for less than 5% of the shipped volume.[2]Ofeoritse Daibo, “As Value of Tunisian Exports Soar, Packaged Olive Oil Struggles,” OLIVEOILTIMES.COM This mismatch directs immediate upside toward Tunisia container glass market producers as exporters seek value-added formats that capture branding margins at origin. Global awards, including 26 medals at the 2024 New York International Olive Oil Competition, strengthen the case for premium presentation. Organic exports of 32,589 tonnes generated EUR 259 million (USD 285 million), illustrating willingness among importers to pay for quality when backed by traceable packaging. The resulting pull effect increases demand for amber and flint, stimulates the use of cullet, and supports unit price resilience.
Shift toward sustainable packaging in beverages
The 2024 revision of the EU Packaging and Packaging Waste Directive mandates 90% collection for single-use beverage containers by 2029 and a minimum 10% reuse rate by 2030. Tunisia ships 75% of all exports to the EU, so its bottlers must adopt compliant packaging. Refillable glass delivers up to 85% lower cradle-to-grave emissions across five use cycles, according to EU-funded life-cycle studies. The directive, therefore, redirects investment from single-use plastic to multi-trip glass, prompting capacity upgrades in Tunisia's container glass market furnaces, which are tuned for higher mechanical durability. Beverage multinationals with Tunisian co-packing contracts are already piloting deposit-return compatible bottles, encouraging long-term furnace utilization gains.
Expansion of Tunisia’s pharmaceutical fill-finish capacity
Competitive factor costs put Tunisia at the top of the shortlisted sites for regional sterile manufacturing. Electricity costs EUR 0.1066 per kWh, the second-lowest worldwide, while the annual direct labor expense for a skilled operative is EUR 5,250 (USD 5,775), the lowest among benchmarked countries. Drug manufacturers locating fill-finish lines in Greater Tunis require Type I or II glass vials and ampules with tight dimensional tolerances, thereby lifting the average revenue per ton for local producers. Domestic demand is coupled with export shipments to North Africa and Southern Europe, thereby buffering the cyclicality of beverage orders and enhancing product mix diversification in the Tunisian container glass market.
Government recycling targets and EPR schemes
In March 2025, Tunisia enacted a circular economy roadmap that sets up municipal sorting centers in Sfax, Djerba, Siliana, Mahdia, and Gafsa. Extended Producer Responsibility fees and tax rebates reward firms that integrate cullet on a large scale. SOTUVER commissioned a cullet treatment plant in January 2024 that processes post-consumer shards for reuse. A dedicated TND 20 million (USD 6.4 million) fund widens access to low-interest loans for glass recycling ventures, improving feedstock availability and stabilizing furnace batch costs. Rapid cullet absorption also reduces energy per ton of molten glass, moderating exposure to fuel price volatility and enhancing the circular credentials of Tunisia's container glass market output.
Restraints Impact Analysis*
| Restraint | (~) % Impact on CAGR Forecast | Geographic Relevance | Impact Timeline |
|---|---|---|---|
| Competition from lightweight PET and metal cans | -0.2% | Global, affecting export competitiveness | Short term (≤ 2 years) |
| High natural gas price volatility impacting furnace cost | -0.1% | National, energy-dependent operations | Short term (≤ 2 years) |
| Soda-ash supply chain disruptions in Mediterranean | -0.1% | Mediterranean region | Medium term (2-4 years) |
| Limited domestic cullet collection infrastructure | -0.1% | National implementation | Medium term (2-4 years) |
| Source: Mordor Intelligence | |||
Competition from lightweight PET and metal cans
The global oversupply of soda ash kept spot prices erratic in 2024, narrowing the cost spread between glass and PET. Weight advantages enable plastic and aluminum to minimize freight emissions, a metric that European retailers are increasingly tracking within their Scope 3 inventories. Tunisian suppliers must promote refill loop economics, optical clarity, and inertness to offset logistics penalties. Continued R&D on lightweighting glass bottles down by 12% in the past five years, softening the disadvantage, yet cannot fully erase it, placing a ceiling on market share expansion during price spikes.
High natural gas price volatility impacting furnace cost
Although baseline tariffs are low, natural gas fuels 97% of Tunisia’s power generation capacity, exposing glass plants to external shocks. State utility subsidy coverage hovers at 46%, and fiscal pressure could force upward tariff revisions. Volatility complicates cost forecasting for continuous furnaces operating 24/7. Projects that integrate rooftop solar, waste heat recovery, or hybrid oxy-fuel combustion are under trial by leading producers to mitigate this risk. The 600 MW Elmed interconnector to Italy, scheduled for 2028, is expected to diversify grid supply and improve stability. However, until then, energy swings will restrain aggressive capacity ramp-up in the Tunisian container glass market.
*Our forecasts treat driver/restraint impacts as directional, not additive. The impact forecasts reflect baseline growth, mix effects, and variable interactions.
Segment Analysis
By End-user: Beverages Drive Volume, Cosmetics Lead Growth
The beverages segment accounted for 58.67% of Tunisia's container glass market size in 2025, as domestic consumers purchased 676 million bottled water units, ranking Tunisia fourth worldwide on a per-capita basis. Public concern over tap water quality sustained this demand, while local breweries, wineries, and soft-drink bottlers contributed steady baseline orders. Exporters shipping wine, harissa, and specialty juices to France and Germany further broadened glass utilization. Despite its dominance, beverage growth moderates as consumption nears saturation, encouraging manufacturers to push refillable bottle schemes and premium niche variants to maintain tonnage.
Cosmetics and personal care, although smaller, are the fastest-growing end-users, with a 3.48% CAGR, driven by contract manufacturing for European brands seeking cost-efficient yet EU-proximate supply chains. Flawless flint bottles and droppers appeal to skincare lines, while amber jars protect light-sensitive creams and serums. Tunisian exhibitors at Spain’s Hispack 2024 packaging trade fair fielded strong inquiries for dual-decoration flint flacons, signaling durable demand momentum. Rising e-commerce in North Africa also supports glass-packaged perfumes, capitalizing on the product’s premium positioning and recyclability narrative. Together, these trends create a higher-margin outlet that partially decouples the Tunisia container glass market from beverage cyclicality.


By Color: Flint Dominance, Amber Acceleration
Flint accounted for 44.02% of Tunisia container glass market share in 2025, thanks to its versatility across bottled water, cosmetics, and clear spirits applications. Transparent presentation remains essential where brand storytelling relies on visible product quality. Sustained bottled water demand and the rise of premium translucent skincare lines keep flint volume buoyant. Investments in advanced inspection cameras and low-iron sand sourcing continue to elevate clarity, reinforcing Tunisia’s competitive edge in regional supply.
Amber is forecast to grow at a 3.72% CAGR to 2031 as pharmaceutical and premium food exporters adopt light-shielding containers. Quality-conscious olive oil brands view amber as a cost-effective defense against UV-induced rancidity, a factor that protects shelf life during long sea freight to Northern Europe. Increased pharmaceutical fill-finish activity drives up demand for vials and syringe bottles, particularly when regulatory dossiers require amber Type III containers. Producers have retooled one furnace line to expand amber mole-x units, anticipating stable capacity utilization. Green glass maintains relevance in the wine and beer niches, although its growth lags behind the broader Tunisian container glass market due to slower vineyard acreage expansion and rising competition from bag-in-box formats.
Geography Analysis
Domestic customers consumed the most container glass tonnage in 2024, yet an export-oriented strategy shapes the company's approach. Tunisia directs 70.1% of all merchandise exports to the European Union, a trend reflected in glass shipments. France alone imported container units worth USD 684,050, followed by Italy, Germany, and Spain, which are reachable within three days by ship. Low berth charges at Rades and Bizerte ports, along with a total throughput of 445,755 TEU in 2023, accommodate scheduled sailings. However, Tunisia ranks 110th out of 139 on the Logistics Performance Index, indicating scope for efficiency gains.
National consumption is driven by bottled water volumes that outpace those of many larger economies. Widespread mistrust of municipal supplies, as publicized by SONEDE, sustains per-capita intake and underpins the popularity of flint bottle runs. Urban centers such as Tunis and Sfax host the bulk of filling capacity, ensuring captive off-take near glass furnaces. Outside of beverages, olive oil cooperatives in Sousse and Mahdia exhibit untapped demand for bottles as they aim to convert more bulk shipments into branded formats targeting gourmet retailers. Neighboring markets in North Africa and Southern Europe import Tunisian vials and cosmetics jars, taking advantage of near-shoring opportunities. Ferry routes to Sicily and Marseille shave lead times to under 36 hours, enabling just-in-time replenishment for pharmaceutical distributors. Political stability and bilateral investment treaties reinforce Tunisia’s appeal, although exposure to the Eurozone's economic cycles imposes forecast uncertainty on Tunisia's container glass market exporters. Over the forecast horizon, improved customs digitization and the operationalization of the Elmed interconnector are expected to further enhance Tunisia’s competitiveness as a Mediterranean production hub.
Competitive Landscape
SOTUVER leads the industry and operates two furnaces with a combined capacity of more than 130,000 tpa. In March 2025, a global glass group offered to purchase a 41% stake in TND 529 million (approximately USD 169.3 million), signaling strategic interest in Tunisia’s cost base and its proximity to the EU. The suitor gains immediate access to a modern cullet treatment facility, commissioned in 2024, which is essential for meeting EU recycled-content thresholds. Local minority shareholders welcomed the deal as a means to facilitate technology transfer and expand market reach.
Competition encompasses family-owned converters that specialize in niche cosmetic jars, as well as Algerian and Italian suppliers targeting Tunisian beverage fillers. These rivals focus on lightweight bottle designs and decorative finishes to capture value pockets. At the same time, Turkish export players occasionally flood the regional market with low-price excess output, pressuring margins during soda-ash cost troughs. Tunisian producers respond through energy efficiency upgrades, including furnace regenerator refurbishment and pilot hybrid-fuel trials leveraging concentrated solar thermal heat.
Innovation priorities now include smart engravings that facilitate deposit-return tracking, internal embossing for weight reduction, and advanced annealing for high-cycle refillables. Partnerships with local universities explore bio-based ceramic coatings that extend bottle life. Overall, the Tunisia container glass market exhibits moderate concentration with SOTUVER and four mid-sized peers holding an estimated 68% combined volume, leaving a competitive fringe that supplies specialty runs and private-label orders.[3]Greg Morris, “SOTUVER Receives Offer from Global Glass Packager,” GLASS-INTERNATIONAL.COM
Tunisia Container Glass Industry Leaders
Feemio Group Co., Ltd.
Société Tunisienne de Verreries SA
Pragati Glass Pvt. Ltd.
STE TUNISIE LABEL
BE.TA. VERRE SARL
- *Disclaimer: Major Players sorted in no particular order

Recent Industry Developments
- March 2025: SOTUVER shareholders accepted a non-binding offer from an international packaging group to acquire 41% of the capital, opening a due diligence data room until end-May 2025.
- March 2025: Tunisia’s cabinet approved a circular economy strategy that installs municipal sorting centers and creates tax incentives for recycled-content manufacturing.
- December 2024: The Finance Bill 2025 expanded the Fonds de Dépollution to include circular economy loans of up to TND 20 million.
- September 2024: Zoppas Industries opened a Sahline appliance component plant, pledging 1,000 jobs by 2025.


Tunisia Container Glass Market Report Scope
Glass Containers refer to clean bottles and jars made from glass. The scope excludes windows and other non-container glass products. Container glass is used in the alcoholic and non-alcoholic beverage industries due to its ability to maintain chemical inertness, sterility, and non-permeability. Glass packaging is valued for its unique properties, including its transparency, inertness, and ability to preserve the quality and integrity of its contents.
Tunisia container glass market is segmented by end-user vertical (beverages [alcoholic beverages (beer, wine, spirits, and other alcoholic beverages {cider and other fermented drinks}), non-alcoholic beverages (juices, carbonated drinks (CSDs), dairy product-based drinks, other non-alcoholic beverages)], food [jam, jelly, marmalades, honey, sausages and condiments, oil, pickles], cosmetics and personal care, pharmaceuticals (excluding vials and ampoules), and perfumery), by color (green, amber, flint and other colors). The report offers market forecasts and size in volume (kilotons) for all the above segments.
| Beverages | Alcoholic | Beer |
| Wine | ||
| Spirits | ||
| Other Alcoholic Beverages (Cider and Other Fermented Drinks) | ||
| Non-Alcoholic | Juices | |
| Carbonated Drinks (CSDs) | ||
| Dairy Product Based Drinks | ||
| Other Non-Alcoholic Beverages | ||
| Food (Jam, Jelly, Marmalades, Honey, Sausages and Condiments, Oil, Pickles) | ||
| Cosmetics and Personal Care | ||
| Pharmaceuticals (excluding Vials and Ampoules) | ||
| Perfumery | ||
| Green |
| Amber |
| Flint |
| Other Colors |
| By End-user | Beverages | Alcoholic | Beer |
| Wine | |||
| Spirits | |||
| Other Alcoholic Beverages (Cider and Other Fermented Drinks) | |||
| Non-Alcoholic | Juices | ||
| Carbonated Drinks (CSDs) | |||
| Dairy Product Based Drinks | |||
| Other Non-Alcoholic Beverages | |||
| Food (Jam, Jelly, Marmalades, Honey, Sausages and Condiments, Oil, Pickles) | |||
| Cosmetics and Personal Care | |||
| Pharmaceuticals (excluding Vials and Ampoules) | |||
| Perfumery | |||
| By Color | Green | ||
| Amber | |||
| Flint | |||
| Other Colors | |||


Key Questions Answered in the Report
How large is Tunisia’s container glass production in 2026?
The Tunisia container glass market size is 203.34 kilotons in 2026.
What annual growth rate is forecast through 2031?
Output is expected to rise at a 2.12% CAGR, reaching 225.79 kilotons by 2031.
Which segment is expanding fastest?
Cosmetics and personal care packaging is growing at 3.48% per year through 2031.
Why is amber glass gaining traction?
Pharmaceutical fill-finish expansion and premium olive oil exports require amber’s UV protection, driving a 3.72% CAGR in this color segment.
How will EU packaging rules influence Tunisian exporters?
Mandatory 90% collection and 10% reuse targets favor glass refillable, prompting exporters to adopt compliant bottles sourced from Tunisian furnaces.
What strategic move involved SOTUVER in 2025?
A global glass group offered to acquire 41% of SOTUVER for approximately USD 169.3 million, signaling consolidation momentum.
Page last updated on:


