Malaysia Container Glass Market Size and Share
Market Overview
| Study Period | 2020 - 2031 |
|---|---|
| Forecast Data Period | 2026 - 2031 |
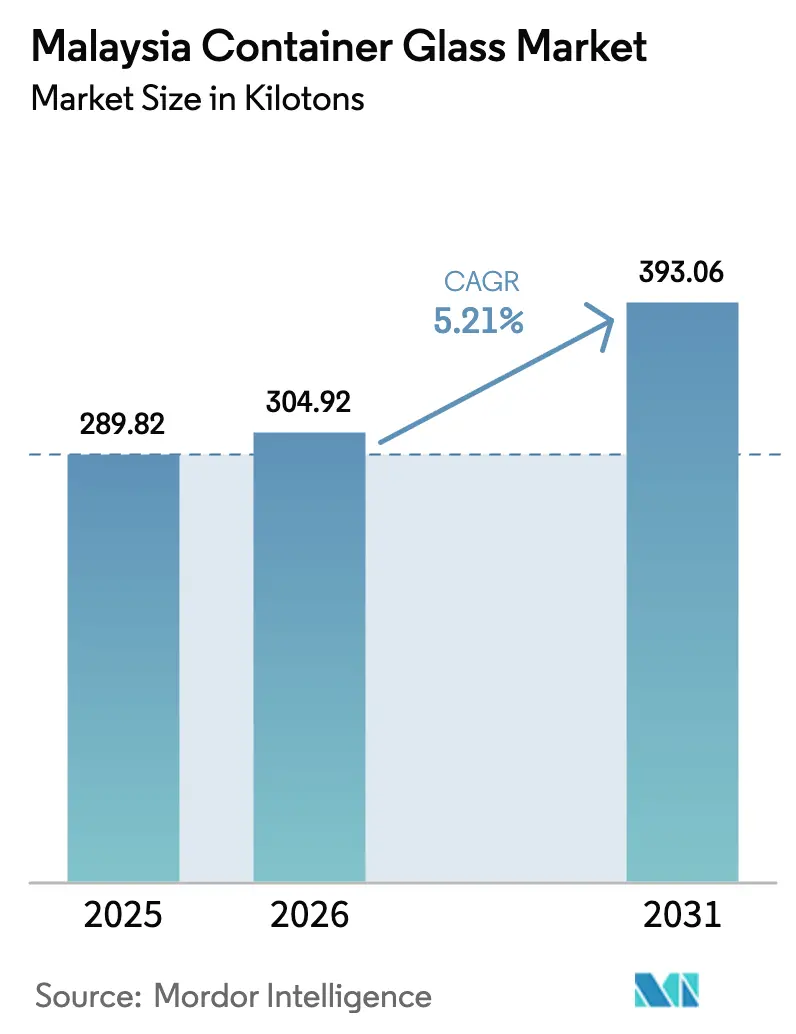
| Base Year Market Size (2025) | 289.82 kilotons |
| Market Volume (2026) | 304.92 kilotons |
| Market Volume (2031) | 393.06 kilotons |
| Growth Rate (2026 - 2031) | 5.21% CAGR |
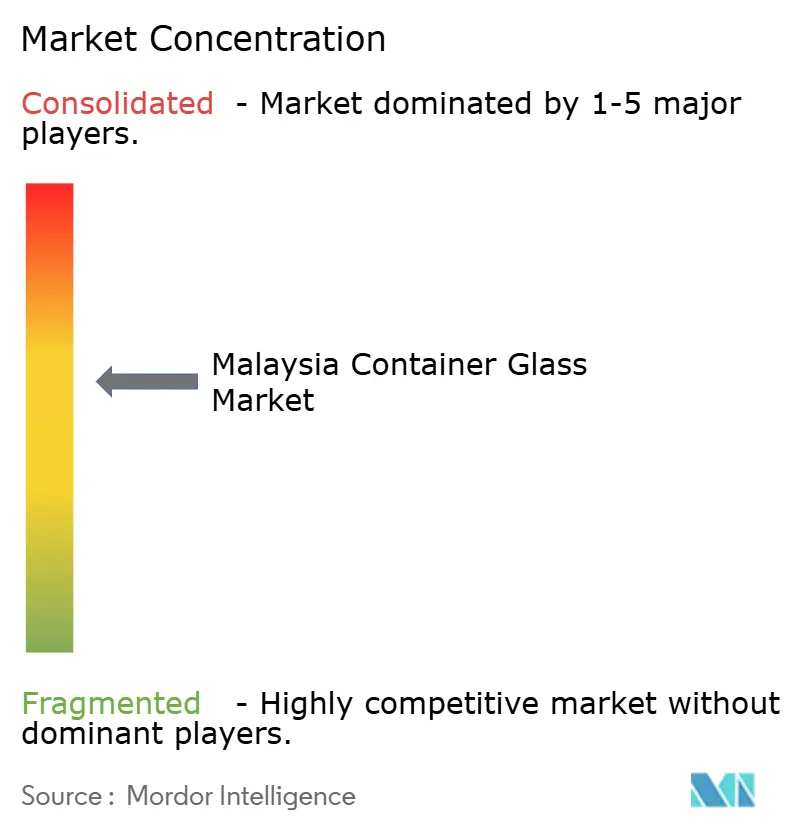
| Market Concentration | Medium |
Major Players *Disclaimer: Major Players sorted in no particular order Image © Mordor Intelligence. Reuse requires attribution under CC BY 4.0. | |
Malaysia Container Glass Market Analysis by Mordor Intelligence
The Malaysia container glass market size in 2026 is estimated at 304.92 kilotons, growing from 2025 value of 289.82 kilotons with 2031 projections showing 393.06 kilotons, growing at 5.21% CAGR over 2026-2031. Demand benefits from Malaysia’s position as a regional manufacturing hub, tariff cuts on glass raw materials under the Regional Comprehensive Economic Partnership, and steady capital inflows into furnace upgrades and lightweighting technology.[1]Asian Development Bank, “ASEAN and Global Value Chains: Locking in Resilience and Sustainability,” adb.org Thriving food and beverage processing, coupled with tourism-driven premium drinks and sustained pharmaceutical vial production, keeps furnace utilization rates high. The government's adoption of the Circular Economy Blueprint (2025-2035) accelerates investments in cullet collection, while halal-certified production lines open export channels to the Middle East and the wider ASEAN region. At the same time, competitive pressure from lightweight PET and aluminum packaging, along with volatile natural gas prices, compels manufacturers to pursue energy-efficient melting and automated inspection systems to preserve their margins.
Key Report Takeaways
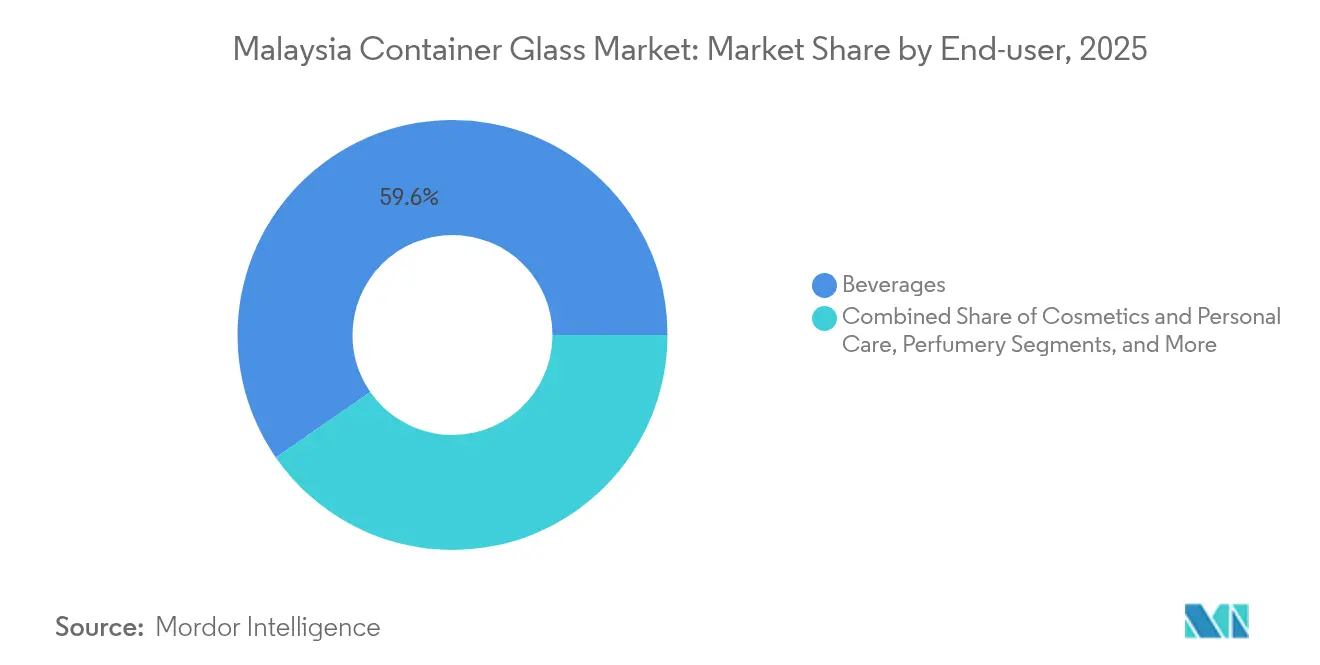
- By end-user, beverages accounted for 59.64% of the Malaysian container glass market share in 2025.
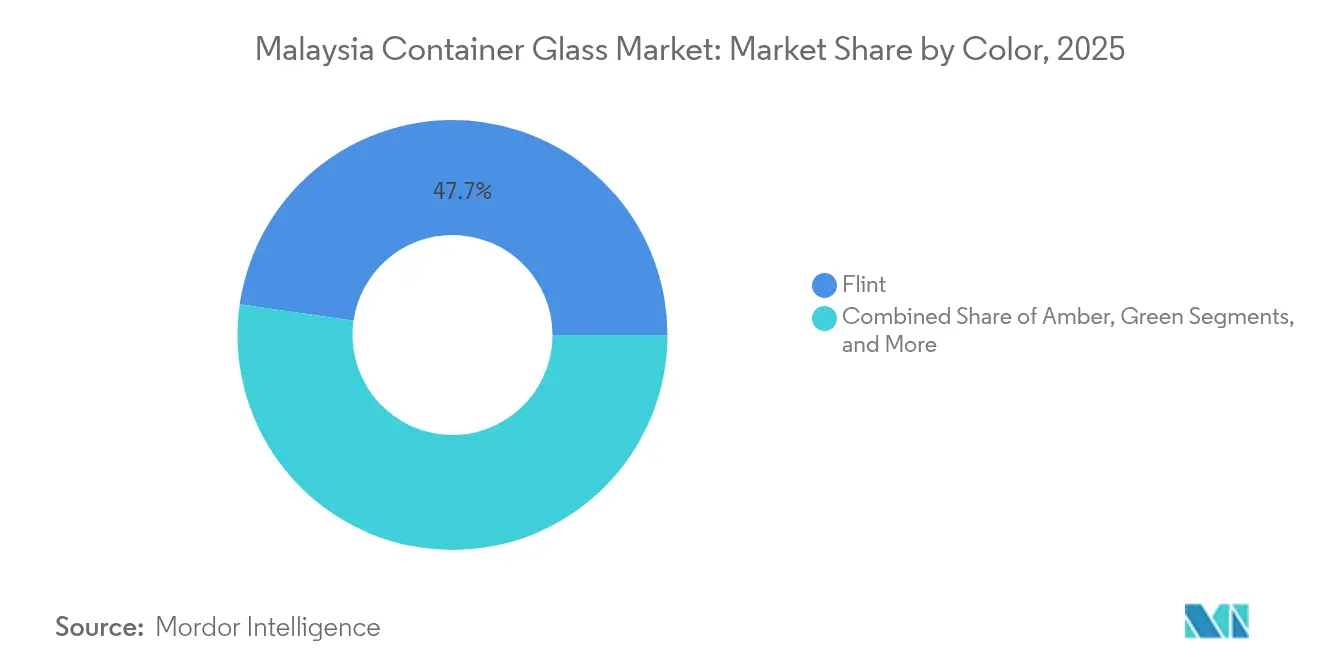
- By color, the Malaysia container glass market size for the amber segment is projected to grow at a 5.99% CAGR between 2026-2031.
Note: Market size and forecast figures in this report are generated using Mordor Intelligence’s proprietary estimation framework, updated with the latest available data and insights as of 2026.
Malaysia Container Glass Market Trends and Insights
Drivers Impact Analysis*
| Driver | (~) % Impact on CAGR Forecast | Geographic Relevance | Impact Timeline |
|---|---|---|---|
| Growing demand for eco-friendly, recyclable packaging | +1.2% | Kuala Lumpur and Penang early adopters | Medium term (2-4 years) |
| Surging demand from food and beverage sector | +1.8% | National urban centers | Short term (≤ 2 years) |
| Tourism-led premium beverage boom | +0.9% | Kuala Lumpur, Penang, Johor Bahru corridors | Medium term (2-4 years) |
| Halal-certified glass lines open export markets | +0.7% | National with Middle East and ASEAN export focus | Long term (≥ 4 years) |
| Lightweighting technology adoption | +0.4% | Nation-wide | Medium term (2-4 years) |
| Tariff cuts on glass raw materials under RCEP | +0.3% | Nation-wide | Short term (≤ 2 years) |
| Source: Mordor Intelligence | |||
Growing Demand for Eco-friendly, Recyclable Packaging
Malaysia’s Circular Economy Blueprint mandates Extended Producer Responsibility and zero-waste-to-landfill certification, positioning glass favorably because it can be infinitely recycled without any loss of quality. A 10% rise in cullet lowers furnace emissions by nearly 5%.[2]Vietnam News, “Holistic approach needed to improve glass recycling,” vietnamnews.vn Yet with a national glass recycling rate of only 10%, compared with the European Union’s 74%, producers see opportunities in building collection networks and color-sorting lines. University research indicates that green-glass powder can completely replace natural sand in cement mortar, while increasing compressive strength by 178%, suggesting viable downstream demand for collected cullet. In response, multinational producers such as O-I deploy mobile recycling units capable of converting 6,000 t y of waste glass into furnace-ready cullet, accelerating the closed-loop push.
Surging Demand from Food and Beverage Sector
Strong growth in domestic food processing and export-oriented beverage filling sustains the Malaysia container glass market. Breweries, dairy processors, and sauce manufacturers value glass for its chemical inertness and premium shelf appeal. Major brewers, anchored by high-volume returnable bottle pools, continue to favor glass despite excise duties because deposit systems lower packaging cost per trip. Local container suppliers capitalize on logistical advantages by producing near consumption hubs, and the sector benefits from spillover demand from regional bottlers that outsource short-run, specialty SKUs to Malaysia. The integration of lightweighting, such as 15% thinner beer bottles, balances premium feel with shipping cost efficiency.
Tourism-Led Premium Beverage Boom
International arrivals in Kuala Lumpur, Penang, and Johor Bahru have revived hotel, restaurant, and duty-free beverage sales, accelerating demand for glass in the craft beer, imported wine, and artisanal juice sectors. Operators highlight glass’s perception of quality and its compatibility with cold-chain storage, which is common in premium beverages. The premiumization motif resonates with travelers seeking “affordable indulgence,” driving sales of small-format craft spirits packaged in distinctive embossed flint bottles. Duty-free retailers prioritize gift-ready aesthetics, often commissioning limited-edition amber or cobalt designs that bolster unit margins for both fillers and converters.
Halal-Certified Glass Lines Open Export Markets
Malaysia’s well-established halal certification enables converters to validate their production lines for religious compliance, a crucial credential for food, beverage, and pharmaceutical exporters targeting Muslim-majority economies. Certification audits verify raw-material sourcing, furnace conditioning, and handling protocols, ensuring no cross-contamination. With Organization of Islamic Cooperation member states scaling up halal imports, glass plants in Johor and Selangor have secured multi-year supply contracts for date syrup, condiments, and infusion drug vials bound for Gulf Cooperation Council markets. Halal-ready capacity, paired with RCEP tariff relief, underpins long-range order visibility and supports capital expenditure in high-speed amber lines.
Restraints Impact Analysis*
| Restraint | (~) % Impact on CAGR Forecast | Geographic Relevance | Impact Timeline |
|---|---|---|---|
| Shift toward PET and metal alternatives | -1.4% | Nation-wide, cost-sensitive segments | Short term (≤ 2 years) |
| High furnace energy costs | -0.8% | Nation-wide | Medium term (2-4 years) |
| Weak cullet collection infrastructure | -0.6% | Urban-rural disparity | Medium term (2-4 years) |
| Skilled-labor shortage and wage inflation | -0.4% | Selangor, Johor, Penang corridors | Long term (≥ 4 years) |
| Source: Mordor Intelligence | |||
Shift Toward PET and Metal Alternatives
Malaysian plastic producers continue to roll out thinner, mono-material PET bottles that weigh up to forty times less than equivalent glass, trimming freight emissions and retail-shelf breakage. Investment in high-barrier coatings and tethered caps strengthens PET’s appeal for carbonated soft drinks and functional beverages. Aluminum can makers also target craft beers with shorter filling cycles and higher recycling rates, pulling volume from one-way glass formats. For price-sensitive condiment and edible-oil packers, packaging costs form up to 15% of unit economics, making PET substitutions financially compelling during commodity inflation. Consequently, glass manufacturers accelerate lightweighting and value-added embossing to maintain differentiation against metal and plastic.
High Furnace Energy Costs
Natural-gas volatility and Malaysia’s progressive carbon policies weigh on melt costs, which can constitute 30% of container glass outlay. The National Energy Policy aims for 20% renewable penetration by 2025, but intermittent sources complicate furnace scheduling for continuous operations. [3]Economic Research Institute for ASEAN and East Asia, “Integrative Report on Implementation of the Circular Economy in ASEAN,” eria.org Larger converters contemplate oxy-fuel or hybrid electric-melter deployments, yet capital outlays can exceed USD 40 million per furnace campaign. Combined Heat and Power (CHP) retrofits increase overall plant efficiency to 60-80%, compared with 33% in conventional steam cycles. However, the payback period extends when gas tariffs spike. Smaller family-owned plants face margin compression, nudging the market toward further consolidation.
*Our forecasts treat driver/restraint impacts as directional, not additive. The impact forecasts reflect baseline growth, mix effects, and variable interactions.
Segment Analysis
By End-user: Beverages Sustain Dominance amid Cosmetics Upswing
Beverages accounted for 59.64% of Malaysia's container glass market share in 2025, as breweries, carbonated drink fillers, and specialty juice producers maintained refillable bottle pools across urban consumption hubs. Double-digit growth in craft beer and functional juice launches reinforces order books for flint and amber containers, while halal-compliant isotonic drinks tap export demand across ASEAN. Converters leverage quick color changeovers and low-volume molds to serve limited-edition releases timed with tourism peaks, broadening revenue streams beyond long-run beer bottles in returnable packs.
The cosmetics and personal care channel, although smaller, is projected to post the fastest 5.75% CAGR through 2031. Rising disposable income and e-commerce penetration encourage local brands to adopt premium glass jars for serums and fragrances. High-clarity flint with frosted finishes and refillable pump systems align with zero-waste messaging, enhancing consumer loyalty. Value-added features such as screen-printed gradients and metallic inks fetch margins two to three times those of standard food jars, supporting revenue diversification for converters.


By Color: Flint Leads while Amber Accelerates
Flint retained 47.72% of the Malaysian container glass market share in 2025, thanks to its versatility and merchandising visibility. JG Containers operates three flint furnace lines, collectively supplying brewers, sauce producers, and vitamin companies. Standard neck-finish designs simplify bottle reuse in deposit schemes, and the color’s neutrality aids shelf differentiation via label graphics rather than container tint.
Amber, projected to register a 5.99% CAGR, gains momentum from pharmaceuticals and premium beer. Its UV-blocking property extends the shelf life of light-sensitive nutraceutical tonics and craft lagers. Strategic investments, such as Owens-Illinois’s swabbing robots, which enable faster amber changeovers, improve cost competitiveness. Green glass remains important for European wine re-exports, whereas cobalt and specialty tints serve the niche perfumery segment, underscoring the segment’s adaptability to diverse branding requirements.
Geography Analysis
Selangor anchors production capacity through Klang-based furnaces that enjoy proximity to Port Klang for silica sand imports and outbound finished goods. Advanced inspection systems and high-efficiency forehearths sustain flint output for domestic beer and export condiment operations. Johor climbs in prominence as global suppliers establish machinery and container capacity near Singapore’s logistics gateways. Bucher Emhart Glass recently completed a MYR 108 million (USD 23.8 million) plant at Senai Airport City to manufacture forming equipment, bolstering regional self-sufficiency.
Penang continues to focus on high-precision specialty glass. SCHOTT’s long-standing Bukit Minyak campus employs more than 1,300 engineers, while its 2024 Kulim expansion adds 400 new positions and broadens the supply of optical blanks for augmented-reality device makers. Kedah’s integrated supply chain benefits from that expansion, fostering cluster effects for upstream mold and refractory suppliers. Sabah’s RM 7.2 billion (USD 1.58 billion) solar-glass complex advances the state’s ambition to diversify from agriculture into advanced materials.
Regional trade liberalization supports export flows to Singapore, Thailand, and the Philippines, while halal-certified lines ship condiment and medical vials to Gulf Cooperation Council destinations. Nonetheless, the United States has launched anti-dumping investigations against Malaysian float glass, with provisional dumping margins as high as 1,180%, potentially constraining future volume growth. Converters mitigate risk by pivoting toward ASEAN consumption zones and higher-value specialty containers less likely to be targeted by trade remedies.
Competitive Landscape
The Malaysia container glass market exhibits moderate concentration. O-I BJC Glass Malaysia leverages Owens-Illinois’s global design library and BJC’s regional distribution to service breweries and food fillers. JG Containers retains an estimated 50% share of domestic flint capacity by operating continuous furnaces with 93% pack efficiencies following Heye International upgrades. Fraser and Neave’s 2025 divestiture of Malaya Glass Products to Berli Jucker and ACI International for MYR 710.8 million (USD 156.4 million) signals ongoing rationalization and deeper integration with global supply chains.
Technology investments act as the main differentiation lever. Plants in Selangor and Johor have adopted high-speed inspection, batch-automation modules, and variable-frequency drive cullet conveyors to trim defects and reduce specific energy consumption. Niche players exploit pharmaceutical demand by commissioning Type I borosilicate tubing lines, as Nippon Electric Glass did in Kedah to supply vaccine vials. Equipment makers also localize: Bucher Emhart Glass’s new Johor factory fabricates 10-20% of the world’s IS machine components, cutting lead times for regional rebuilds.
Future consolidation may stem from Owens-Illinois’s strategic review of its Asia-Pacific portfolio announced in late 2024. Potential divestiture of certain assets could open acquisition prospects for regional conglomerates seeking vertical integration. Meanwhile, rising energy intensity costs encourage shared furnace clusters, where multiple brands pool production in one asset to maximize pull rate and melt efficiency.
Malaysia Container Glass Industry Leaders
O-I BJC Glass Malaysia Sdn Bhd
JG Containers (Malaysia) Sdn Bhd
Glass & Plastic Packaging Sdn Bhd
Joyi Link Sdn Bhd
DSM Packaging Sdn Bhd
- *Disclaimer: Major Players sorted in no particular order

Recent Industry Developments
- January 2025: U.S. Department of Commerce opened anti-dumping and countervailing duty investigations into float glass from Malaysia, citing dumping margins between 66.24% and 1,180%.
- September 2024: SCHOTT inaugurated a new production facility in Kulim, Kedah, built in under 12 months and expected to generate 400 skilled jobs.
- August 2024: Malaysia’s Ministry of Housing and Local Government unveiled the Circular Economy Blueprint for Solid Waste (2025-2035), instituting Extended Producer Responsibility and zero-waste-to-landfill certification.
- June 2024: O-I Glass deployed its Mobile Glass Recycling Asset capable of processing 6,000 t y of waste glass into furnace-ready cullet.


Malaysia Container Glass Market Report Scope
Glass containers are vessels made from glass used to store and protect products such as food, beverages, pharmaceuticals, cosmetics, and chemicals. Available in diverse shapes and sizes, such as bottles, jars, and vials, these containers provide airtight seals and protect contents from external contaminants. Glass packaging is valued for its non-reactive nature, preservation of product quality, and high recyclability. These attributes make glass containers a preferred choice for packaging across multiple industries.
Malaysia container glass market is segmented by end-user vertical (beverages [alcoholic beverages (beer, wine, spirits, and other alcoholic beverages {cider and other fermented drinks}), non-alcoholic beverages (juices, carbonated drinks (CSDs), dairy product-based drinks, other non-alcoholic beverages)], food [jam, jelly, marmalades, honey, sausages and condiments, oil, pickles], cosmetics and personal care, pharmaceuticals (excluding vials and ampoules), and perfumery), by color (green, amber, flint and other colors). The report offers market forecasts and size in volume (kilotons) for all the above segments.
| Beverages | Alcoholic | Beer |
| Wine | ||
| Spirits | ||
| Other Alcoholic Beverages (Cider and Other Fermented Drinks) | ||
| Non-Alcoholic | Juices | |
| Carbonated Drinks (CSDs) | ||
| Dairy Product Based Drinks | ||
| Other Non-Alcoholic Beverages | ||
| Food (Jam, Jelly, Marmalades, Honey, Sausages and Condiments, Oil, Pickles) | ||
| Cosmetics and Personal Care | ||
| Pharmaceuticals (excluding Vials and Ampoules) | ||
| Perfumery | ||
| Green |
| Amber |
| Flint |
| Other Colors |
| By End-user | Beverages | Alcoholic | Beer |
| Wine | |||
| Spirits | |||
| Other Alcoholic Beverages (Cider and Other Fermented Drinks) | |||
| Non-Alcoholic | Juices | ||
| Carbonated Drinks (CSDs) | |||
| Dairy Product Based Drinks | |||
| Other Non-Alcoholic Beverages | |||
| Food (Jam, Jelly, Marmalades, Honey, Sausages and Condiments, Oil, Pickles) | |||
| Cosmetics and Personal Care | |||
| Pharmaceuticals (excluding Vials and Ampoules) | |||
| Perfumery | |||
| By Color | Green | ||
| Amber | |||
| Flint | |||
| Other Colors | |||


Key Questions Answered in the Report
What is the current size of the Malaysia container glass market and how fast is it growing?
The market stood at 304.92 kilotons in 2026 and is projected to reach 393.06 kilotons by 2031, registering a 5.21% CAGR over the forecast period.
Which end-user segment accounts for the largest share of Malaysian container glass demand?
Beverages lead with 59.64% share, supported by refillable beer bottles and expanded non-alcoholic specialty drinks.
Why is amber glass demand rising faster than other colors in Malaysia?
Amber’s UV-blocking property protects light-sensitive pharmaceuticals and craft beers, driving a 5.99% CAGR between 2026 and 2031.
How does Malaysia’s Circular Economy Blueprint affect container glass producers?
It introduces Extended Producer Responsibility obligations and zero-waste-to-landfill certification, pushing manufacturers to invest in cullet collection and recycling technology.
What challenges do Malaysian glass makers face from competing packaging materials?
Lightweight PET bottles and aluminum cans offer cost and logistics advantages in price-sensitive segments, exerting downward pressure on glass volumes.
How significant are energy costs in Malaysia’s container glass production?
Melt operations are energy-intensive, with natural-gas price volatility and decarbonization policies elevating furnace operating costs and encouraging efficiency upgrades.
Page last updated on:


