Iran Container Glass Market Size and Share
Market Overview
| Study Period | 2020 - 2031 |
|---|---|
| Forecast Data Period | 2026 - 2031 |
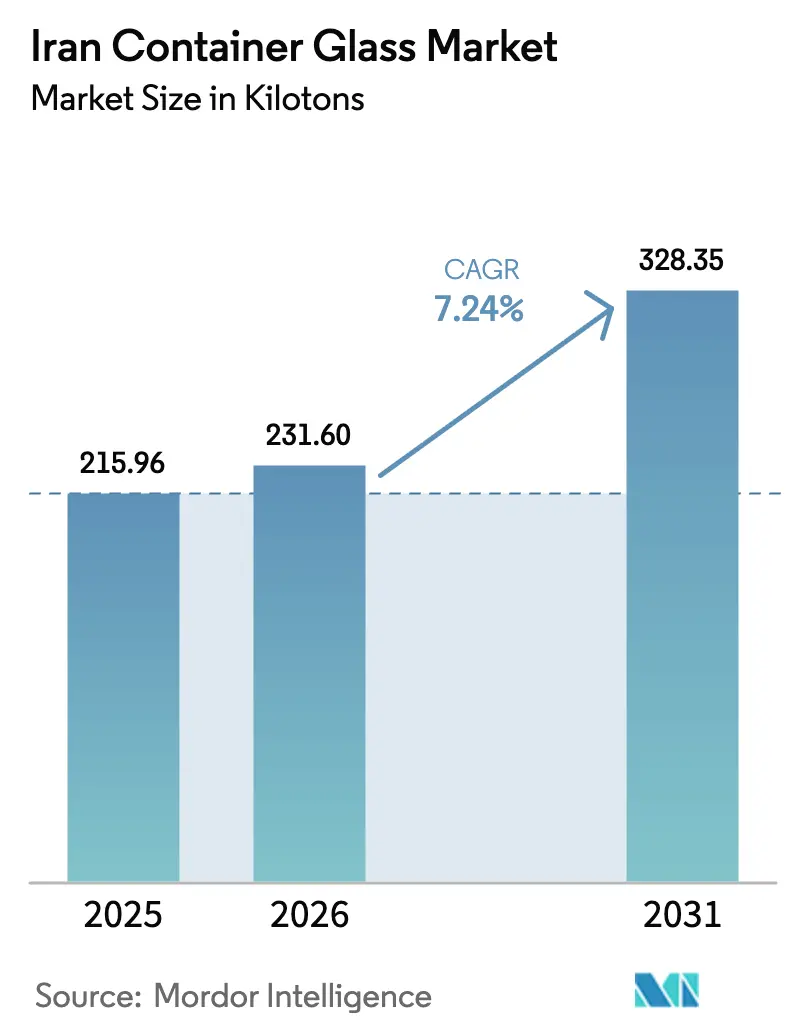
| Base Year Market Size (2025) | 215.96 kilotons |
| Market Volume (2026) | 231.6 kilotons |
| Market Volume (2031) | 328.35 kilotons |
| Growth Rate (2026 - 2031) | 7.24% CAGR |
| Market Concentration | High |
Major Players *Disclaimer: Major Players sorted in no particular order Image © Mordor Intelligence. Reuse requires attribution under CC BY 4.0. | |
Iran Container Glass Market Analysis by Mordor Intelligence
The Iran container glass market size is expected to grow from 215.96 kilotons in 2025 to 231.6 kilotons in 2026 and is forecast to reach 328.35 kilotons by 2031 at 7.24% CAGR over 2026-2031. Robust growth is underpinned by the nation’s abundant domestic raw material base, integrated production chains, and an export-oriented strategy that diverts roughly 40% of daily output to overseas customers, especially Turkey and Central Asia. Competitive advantages stem from dedicated soda-ash capacity, notably Kaveh Glass’s in-house facility, commissioned in 2005, which cushions manufacturers from global price swings.[1]Kaveh Glass Industrial Group, “Raw Material – Kaveh Glass,” kavehglass.com While energy-subsidy reforms may increase furnace operating costs by 20-30% over the medium term, recent trade facilitation with the UAE and the expansion of GCC corridors create new export opportunities.
Key Report Takeaways
- By end-user, beverages captured 50.88% of the Iran container glass market share in 2025.
- By color, the Iran container glass market for amber glass is projected to grow at a 8.37% CAGR between 2026-2031.
Note: Market size and forecast figures in this report are generated using Mordor Intelligence’s proprietary estimation framework, updated with the latest available data and insights as of 2026.
Iran Container Glass Market Trends and Insights
Drivers Impact Analysis*
| Driver | (~) % Impact on CAGR Forecast | Geographic Relevance | Impact Timeline |
|---|---|---|---|
| Growing demand for premium packaging across food and beverages | +1.8% | Tehran and industrial centers | Medium term (2-4 years) |
| Urbanization-led shift toward sustainable glass packaging | +1.2% | Tehran, Isfahan, Mashhad, Tabriz | Long term (≥ 4 years) |
| Surge in craft beverage start-ups leveraging glass bottles | +0.9% | Tehran metro, provincial capitals | Short term (≤ 2 years) |
| Pharmaceutical localization initiatives post-COVID-19 | +1.5% | Qazvin and Tehran hubs | Medium term (2-4 years) |
| Expansion of recycling infrastructure improving cullet supply | +0.8% | Shamsabad, Takestan, Qazvin | Long term (≥ 4 years) |
| Easing sanctions boosting export opportunities to GCC | +1.1% | Southern trade corridors | Short term (≤ 2 years) |
| Source: Mordor Intelligence | |||
Growing demand for premium packaging across food and beverages
Manufacturers report 25-30% price premiums for honey, jams, and condiments sold in glass, spurred by social media visibility and higher urban disposable income. Glass plants already operate with 850,000 tons of annual packaging capacity, enabling a swift response without major capital outlays.
Urbanization-led shift toward sustainable glass packaging
With urbanization rates above 75%, municipal programs in Tehran and Isfahan promote glass-recycling streams that reduce energy needs by 10-15% per ton of output, according to daily. Producers tout infinite recyclability, appealing to educated consumer groups.
Surge in craft beverage start-ups leveraging glass bottles
Small brands are adopting custom four-color printed bottles from Takestan Packaging Glass to differentiate their artisanal soda and kombucha lines. Higher-margin small-batch orders enhance profitability for suppliers.
Pharmaceutical localization initiatives post-COVID-19
Domestic policies prioritize the availability of sterile containers, prompting Mofid and Razi Pharmaceutical Glass to scale their amber and flint bottle lines for both local and regional export markets.
Restraints Impact Analysis*
| Restraint | (~) % Impact on CAGR Forecast | Geographic Relevance | Impact Timeline |
|---|---|---|---|
| Rising substitution by PET and aluminum containers | -1.4% | National | Short term (≤ 2 years) |
| Volatility in soda-ash and energy feedstock prices | -1.1% | Tehran, Qazvin, Takestan | Medium term (2-4 years) |
| Energy-subsidy reforms raising furnace costs | -0.9% | Nationwide facilities | Short term (≤ 2 years) |
| Currency depreciation delaying technology upgrades | -0.7% | Import-dependent firms | Long term (≥ 4 years) |
| Source: Mordor Intelligence | |||
Rising substitution by PET and aluminum containers
PET delivers 40-50% weight savings, reducing freight costs for price-sensitive soft drink producers. Aluminum can usage grows where urban recycling systems support circular economies, though domestic metal smelting constraints limit rapid scale-up.
Volatility in soda-ash and energy feedstock prices
Soda ash can account for 20% of the cost; global spot declines offer relief, yet Iranian buyers remain exposed due to limited non-Kaveh output procurement. Natural-gas subsidy reforms threaten to raise economy-wide energy bills by USD 70 billion annually.[2]Procurement Resource, “Soda Ash Prices Declining,” procurementresource.com
*Our forecasts treat driver/restraint impacts as directional, not additive. The impact forecasts reflect baseline growth, mix effects, and variable interactions.
Segment Analysis
By End-user: Beverages Drive Volume While Cosmetics Accelerate Growth
Beverages accounted for 50.88% of Iran's container glass market share in 2025, driven by entrenched juice and soft drink consumption. Cosmetics and personal care are projected to expand at a 8.92% CAGR, supported by rising female labor participation and premium beauty spending.
Manufacturers utilize flexible lines to serve the food, pharmaceutical, and perfumery niches, thereby securing diversified revenue streams. Crystal Iran leverages three decades of know-how to deliver specialized jars and vials alongside mainstream beverage bottles.


By Color: Flint Dominance Meets Amber Innovation
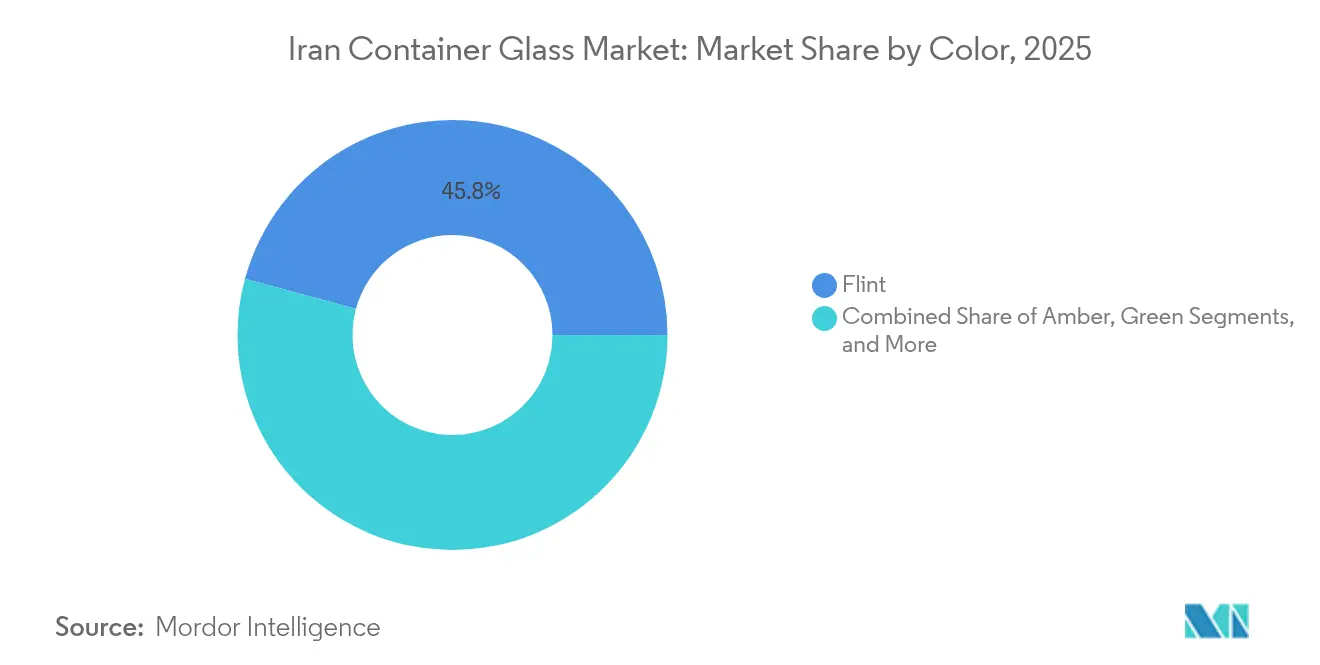
Flint retained a 45.79% share of the Iranian container glass market in 2025, favored for its inspection clarity in the pharmaceutical and food industries. Amber is projected to be the fastest riser, with an 8.37% CAGR, offering UV shielding in demand from local drug makers.
Green remains stable in traditional beverage lines, while niche tints cater to high-margin cosmetics. Shisheh Va Gaz Industrial Group utilizes NNPB technology, which toggles between flint and brown output, thereby enhancing responsiveness to color-specific orders.
Geography Analysis
Exports account for 40% of output, with Turkey alone importing USD 3.7 billion of Iranian containers in 2024. Central Asian buyers leverage cultural ties, while the UAE’s relaxed registration regime eases broader GCC access.
Tehran, Qazvin, and Takestan host dense manufacturing clusters that sit close to silica, sodium carbonate, and dolomite quarries, allowing for low landed input costs. Its domestic sales are concentrated in the Tehran metro, yet improving logistics are extending premium packaging to secondary cities.
The strategic corridor linking southern ports to GCC markets benefits from easing sanctions, supporting quick delivery to Saudi and Omani buyers once full diplomatic normalization takes hold.
Competitive Landscape
The industry is moderately fragmented, with no single player exceeding a double-digit share. Kaveh Glass sustains cost leadership through captive soda-ash production established in 2005. Shisheh Va Gaz competes in the lightweight NNPB bottle market for beverages, while Razi Pharmaceutical Glass focuses on high-purity medical vials.
Domestic engineering houses such as Dana Glass Technic design turnkey plants, underscoring local technical depth. Opportunities lie in premiumization and custom short runs for craft segments, whereas commodity lines face pressure from the substitution of PET.
Export-oriented firms, such as Sahand Industrial Group, earned national recognition in 2024 for maintaining shipments despite regional border constraints.
Iran Container Glass Industry Leaders
Mina Glass Co.
Razi Glass Group
Hamadan Glass Company
Shisheh Va Gaz Company
Azar Mehr Heris Co.
- *Disclaimer: Major Players sorted in no particular order


Recent Industry Developments
- September 2025: Ilam Gas Refinery expansion enhances feedstock stability for glass plants.
- April 2025: Nanotechnology exports surge 110%, opening advanced-coating avenues for glass makers.
- March 2025: National glass production surpasses 3 million tons, with 850,000 tons allotted to container lines.
- May 2024: The 7th International Iran Glass and Machinery Show hosted 3,000 visitors.


Iran Container Glass Market Report Scope
Glass Containers refer to clean bottles and jars made from glass. The scope excludes windows and other non-container glass products. Container glass is used in the alcoholic and non-alcoholic beverage industries due to its ability to maintain chemical inertness, sterility, and non-permeability. Glass packaging is valued for its unique properties, including its transparency, inertness, and ability to preserve the quality and integrity of its contents.
Iran container glass market is segmented by end-user vertical (beverages [alcoholic beverages (beer, wine, spirits, and other alcoholic beverages {cider and other fermented drinks}), non-alcoholic beverages (juices, carbonated drinks (CSDs), dairy product-based drinks, other non-alcoholic beverages)], food [jam, jelly, marmalades, honey, sausages and condiments, oil, pickles], cosmetics and personal care, pharmaceuticals (excluding vials and ampoules), and perfumery), by color (green, amber, flint and other colors). The report offers market forecasts and size in volume (kilotons) for all the above segments.
| Beverages | Alcoholic | Beer |
| Wine | ||
| Spirits | ||
| Other Alcoholic Beverages (Cider and Other Fermented Drinks) | ||
| Non-Alcoholic | Juices | |
| Carbonated Drinks (CSDs) | ||
| Dairy Product Based Drinks | ||
| Other Non-Alcoholic Beverages | ||
| Food (Jam, Jelly, Marmalades, Honey, Sausages and Condiments, Oil, Pickles) | ||
| Cosmetics and Personal Care | ||
| Pharmaceuticals (excluding Vials and Ampoules) | ||
| Perfumery | ||
| Green |
| Amber |
| Flint |
| Other Colors |
| By End-user | Beverages | Alcoholic | Beer |
| Wine | |||
| Spirits | |||
| Other Alcoholic Beverages (Cider and Other Fermented Drinks) | |||
| Non-Alcoholic | Juices | ||
| Carbonated Drinks (CSDs) | |||
| Dairy Product Based Drinks | |||
| Other Non-Alcoholic Beverages | |||
| Food (Jam, Jelly, Marmalades, Honey, Sausages and Condiments, Oil, Pickles) | |||
| Cosmetics and Personal Care | |||
| Pharmaceuticals (excluding Vials and Ampoules) | |||
| Perfumery | |||
| By Color | Green | ||
| Amber | |||
| Flint | |||
| Other Colors | |||


Key Questions Answered in the Report
How large is Iran’s container glass production in 2026?
Output reaches 231.6 kilotons and is on track for 328.35 kilotons by 2031.
Which end-user segment leads demand?
Beverages hold 50.88% share thanks to strong soft-drink and juice consumption.
What is the fastest-growing application?
Cosmetics and personal care, forecast at a 8.92% CAGR through 2031.
Why do Iranian producers enjoy cost advantages?
Abundant local silica and captive soda-ash capacity reduce reliance on volatile imports.
Which color segment is set to grow fastest?
Amber containers, projected to grow at an 8.37% CAGR due to rising demand for pharmaceuticals.
How will energy-subsidy reforms influence the industry?
They could lift furnace operating costs 20-30%, pressing firms to upgrade efficiency.
Page last updated on:


