Ethiopia Container Glass Market Size and Share
Market Overview
| Study Period | 2020 - 2031 |
|---|---|
| Forecast Data Period | 2026 - 2031 |
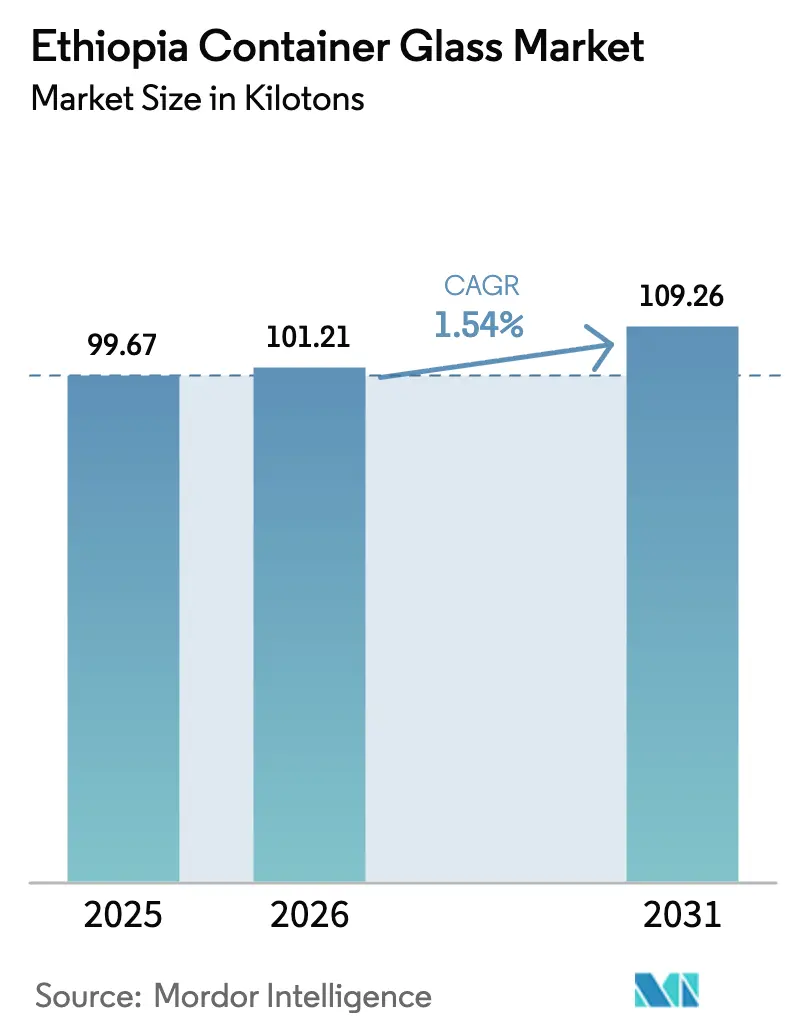
| Base Year Market Size (2025) | 99.67 kilotons |
| Market Volume (2026) | 101.21 kilotons |
| Market Volume (2031) | 109.26 kilotons |
| Growth Rate (2026 - 2031) | 1.54% CAGR |
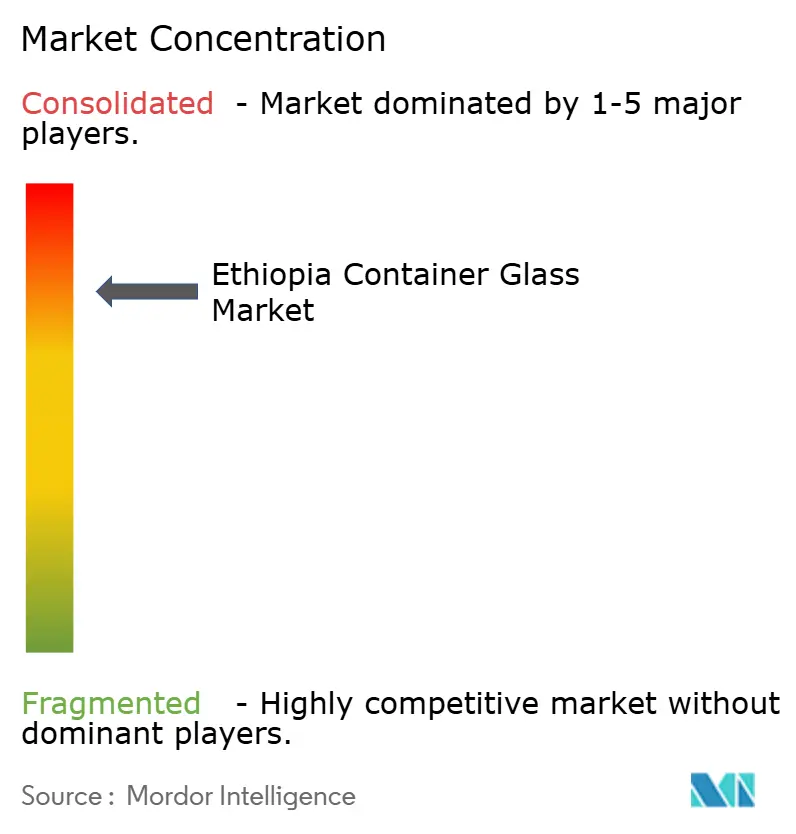
| Market Concentration | High |
Major Players *Disclaimer: Major Players sorted in no particular order Image © Mordor Intelligence. Reuse requires attribution under CC BY 4.0. | |
Ethiopia Container Glass Market Analysis by Mordor Intelligence
The Ethiopian container glass market size in 2026 is estimated at 101.21 kilotons, growing from 2025 value of 99.67 kilotons with 2031 projections showing 109.26 kilotons, growing at 1.54% CAGR over 2026-2031. Sustained growth in beverage output, foreign-funded industrial parks, and an import-substitution policy mix are the primary levers behind this gradual expansion. Returns-driven investments from multinational brewers, the expansion of pharmaceutical fill-and-finish capacity, and a growing urban middle class continue to drive demand upward, even as macroeconomic headwinds persist. Yet, structural constraints ranging from power outages to limited local soda ash availability continue to moderate the speed at which new furnace capacity can be added. The Ethiopian container glass market, therefore, advances along a measured trajectory that balances cyclical beverage demand spikes with an infrastructure base still in transition.
Key Report Takeaways
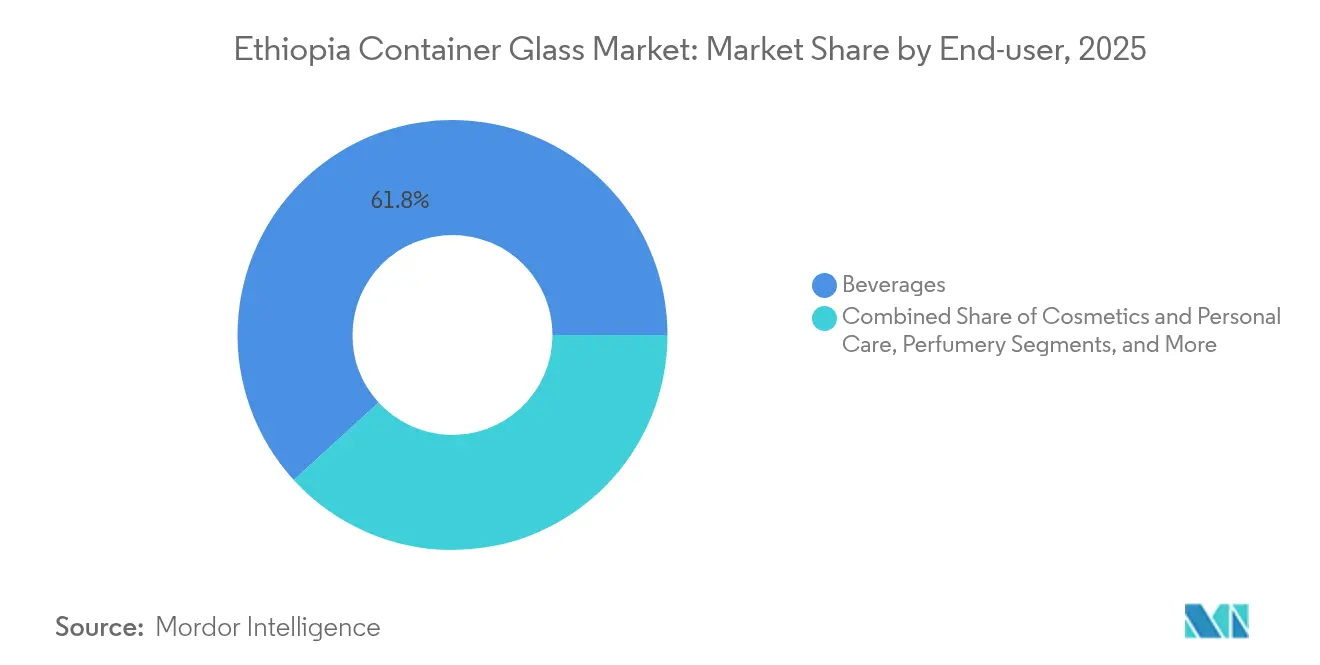
- By end-user, beverages captured 61.78% of the Ethiopia container glass market share in 2025.
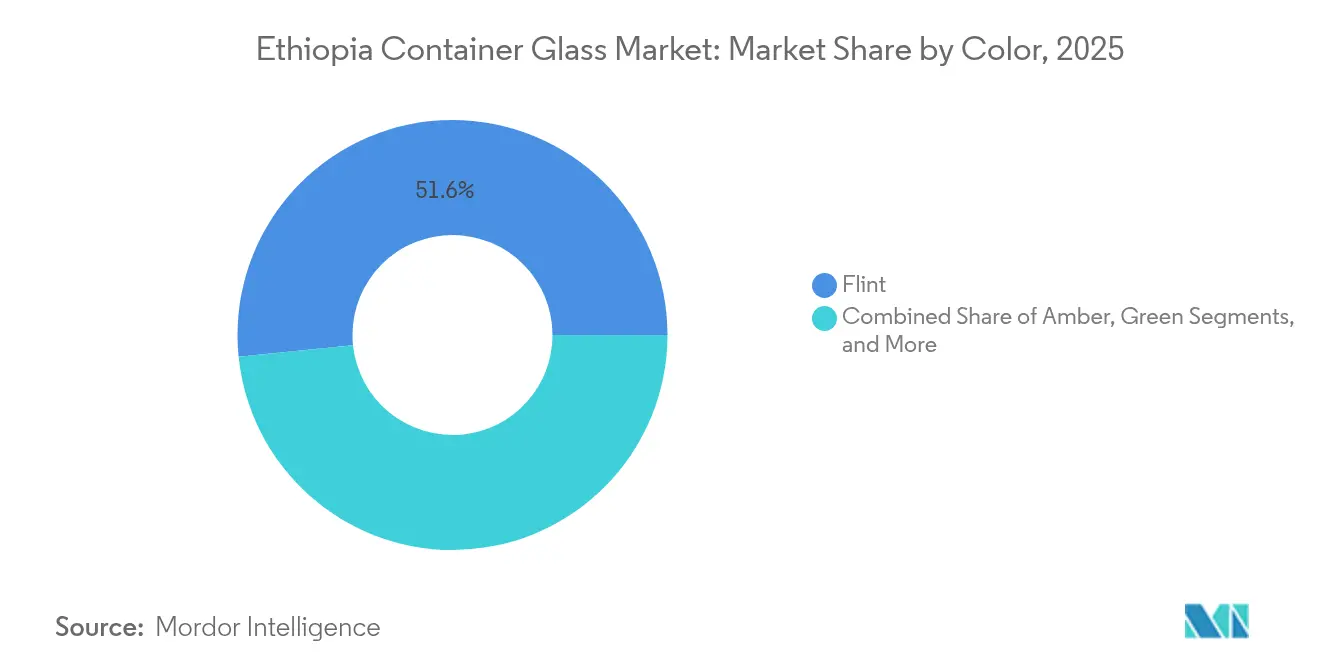
- By color, the Ethiopia container glass market for amber glass is projected to grow at a 2.18% CAGR between 2026-2031.
Note: Market size and forecast figures in this report are generated using Mordor Intelligence’s proprietary estimation framework, updated with the latest available data and insights as of 2026.
Ethiopia Container Glass Market Trends and Insights
Drivers Impact Analysis*
| Driver | (~) % Impact on CAGR Forecast | Geographic Relevance | Impact Timeline |
|---|---|---|---|
| Expanding beer and spirits production driving premium glass demand | +0.4% | Addis Ababa and Oromia brewing hubs | Medium term (2-4 years) |
| Government import-substitution incentives for local glass manufacturing | +0.3% | National industrial parks | Long term (≥ 4 years) |
| Rising pharmaceutical fill-and-finish investments | +0.2% | Kilinto Industrial Park and nationwide | Medium term (2-4 years) |
| Growing urban middle-class preference for refillable returnable bottles | +0.2% | Major cities | Short term (≤ 2 years) |
| Ethiopian diaspora demand for heritage beverages in glass export packs | +0.1% | North American and European export corridors | Medium term (2-4 years) |
| Implementation of extended producer responsibility schemes boosting glass collection | +0.1% | Urban centers | Long term (≥ 4 years) |
| Source: Mordor Intelligence | |||
Expanding Beer and Spirits Production Driving Premium Glass Demand
Breweries remain the single largest purchasers of glass bottles, and their capacity additions directly influence the Ethiopian container glass market. Heineken’s local subsidiary, for example, offset high single-digit volume declines in 2024 with mid-teens revenue growth, underscoring the pricing latitude afforded by premium packaging.[1]Heineken N.V., “Q1 2025 Trading Update,” theheinekencompany.com Domestic brewers, such as Habesha, have future-proofed their lines for glass integration, an approach that already enables distribution to 158 towns and 15 export destinations. These rollouts increase run lengths for flint and amber containers, enabling glassmakers to operate furnaces at higher pull rates and stabilize fixed-cost absorption. Premium positioning also accelerates the shift toward returnable programs, extending bottle life cycles and reinforcing unit demand even as per-capita beer consumption stabilizes.
Government Import-Substitution Incentives for Local Glass Manufacturing
Policy makers classify glass among the priority subsectors in the 10-year development plan, coupling tax holidays with duty exemptions on cullet processing and furnace equipment. Directive No. 1001/2024 further liberalized foreign participation, enabling equity inflows that bankroll modernization projects. Together with a market-determined exchange-rate regime supported by a USD 3.4 billion IMF program, these measures ease capital import bottlenecks and reduce the payback period on float-glass and container lines. Industrial-park clustering, particularly at Kilinto and the new Sheger City node, lowers logistics costs and introduces shared utilities for compressed air and effluent treatment, thereby lifting the medium-term growth ceiling for the Ethiopian container glass market.
Rising Pharmaceutical Fill-and-Finish Investments
Only 15% of the nation's drug demand is currently met by domestic plants, a gap that the government aims to close by 2030. ShieldVax Enterprises’ USD 70 million vaccine facility at Kilinto illustrates the scale of forward commitments already on the books. Injectable lines require neutral-borosilicate or Type II soda-lime flint vials produced under tight tolerance windows, nudging glassmakers toward higher-capex forehearth control systems. As validation protocols tighten under the oversight of the Ethiopian Food and Drug Authority, amber and flint formats that block UV ingress gain volume in tandem with procedural drug batches. These dynamics enhance the value mix within the Ethiopian container glass market while forging supply agreements that secure multi-year volumes.
Growing Urban Middle-Class Preference for Refillable Returnable Bottles
Urban households are increasingly viewing refillable glass as both an economic and environmental win, especially when supermarket footprints expand their collection infrastructure. Deposit-refund schemes for carbonated soft drinks and bottled water are now being piloted in Addis Ababa, and beverage companies have launched social media campaigns to emphasize the parity of reuse with price. The urban middle class, buoyed by 7% annual retail sales growth, views returnables as a hedge against inflation on single-use packaging. Because each refillable bottle completes 8-12 trips before cullet recovery, aggregate furnace pull must still climb to replace breakage and attrition, underpinning incremental tonnage gains for the Ethiopia container glass market
Restraints Impact Analysis*
| Restraint | (~) % Impact on CAGR Forecast | Geographic Relevance | Impact Timeline |
|---|---|---|---|
| High dependence on imported soda ash and silica sand | -0.3% | Nationwide | Short term (≤ 2 years) |
| Competition from lightweight PET and metal cans | -0.2% | Urban beverage corridors | Medium term (2-4 years) |
| Furnace downtime due to national grid power outages | -0.2% | Central and Oromia regions | Short term (≤ 2 years) |
| Logistical bottlenecks from poor road infrastructure | -0.1% | Secondary cities | Long term (≥ 4 years) |
| Source: Mordor Intelligence | |||
High Dependence on Imported Soda Ash and Silica Sand
The Abijata-Shalla plant delivers just 20,000 tonnes of soda ash annually, leaving glassmakers reliant on imports that strain foreign-exchange reserves. Procurement delays reach three months when letters of credit are rationed, forcing firms to operate below nameplate capacity. While a new high-purity silica-sand deposit has been confirmed in Lemi, feasibility studies indicate that additional calcination and washing stages are required before achieving glass-grade purity. Until those upgrades go live, the Ethiopian container glass industry remains vulnerable to cost swings of up to 18% each quarter when Asian freight rates fluctuate.
Competition from Lightweight PET and Metal Cans
PET’s kilogram-per-liter advantage exceeds 80%, lowering backhaul costs on Ethiopia’s patchy road network. For breweries pursuing single-serve SKUs, PET and cans also offer line speeds that outpace glass filling by up to 25%. Price-conscious urban millennials appear increasingly willing to trade heritage cues for portability, pressuring breweries to split volume across multiple substrates. Although premium tiers still default to Flint, base-segment erosion caps upside for the Ethiopian container glass market, particularly in carbonated soft drinks and packaged water chains.
*Our forecasts treat driver/restraint impacts as directional, not additive. The impact forecasts reflect baseline growth, mix effects, and variable interactions.
Segment Analysis
By End-user: Beverages Retain Volume Leadership While Cosmetics Accelerate
The beverages segment accounted for a dominant 61.78% of Ethiopia's container glass market share in 2025. Revenues from beer, carbonated soft drinks, and bottled water ensure a stable furnace pull, with breweries alone lifting glass demand by 2.1 kilotons year-over-year in 2025, despite macroeconomic volatility. Future gains hinge on renewing the returnable-bottle fleet and diaspora-oriented export packs that highlight Ethiopian heritage beverages. Meanwhile, the cosmetics and personal care category is expected to deliver the fastest incremental tonnage, growing at a 2.67% CAGR to 2031, as urban women increase their discretionary spending on premium creams and perfumes. Unit volumes may be lower, but per-ton margins exceed those of beverages by up to 40%, adding a profit diversification vector for glass converters.
In food applications, glass remains the container of choice for honey, jam, and condiment exporters seeking to meet EU traceability regulations, which will tighten from December 2025. Pharmaceutical demand, although still accounting for less than 5% of aggregate tonnage, gains strategic significance because vial specifications support higher average selling prices. Perfume and fine fragrance brands also leverage glass to differentiate themselves in emerging modern retail channels. Collectively, these trends ensure that the Ethiopian container glass market size for non-beverage end-users expands faster than the headline average, even as beverages anchor baseline furnace utilization levels.


By Color: Flint Dominates, Amber Gains Momentum
Flint glass accounted for 51.62% of the Ethiopian container glass market share in 2025, thanks to its cross-category versatility. Breweries specify flint for lager and specialty beer exports, while pharma lines demand it for parenteral drugs under photostable conditions. Amber glass, however, is projected to clock the fastest growth at a 2.18% CAGR through 2031. Its UV-blocking properties meet the requirements of expanding fill-and-finish lines at Kilinto and shield spirits positioned in the premium tier. Production economics also favor longer amber runs because cullet streams remain uncontaminated by color mixing, trimming batch-house downtime.
Green glass maintains a niche in wine and craft-beer segments, but limited domestic viticulture caps upside. Specialty tints such as cobalt blue for high-end cosmetics remain custom orders with run sizes below 50 tonnes, yet they command premium conversion margins. The color mix, therefore, illustrates a gradual shift from general-purpose flint toward functional amber, a transition that raises blended margins across the Ethiopian container glass market while spreading furnace campaigns over fewer color-change cycles.
Geography Analysis
Addis Ababa and the surrounding Oromia industrial belt host roughly 90% of the installed furnace pull, creating a dense ecosystem of cullet suppliers, mold makers, and end-users. This clustering shortens lead times between bottlers and glassmakers to less than 24 hours, minimizing transport breakage and enabling just-in-time replenishment. Yet the same concentration amplifies systemic risk: a 12-hour grid outage in April 2025 idled both major plants simultaneously, forcing breweries to draw on emergency inventories for three days.
Northern Ethiopia remains demand-constrained due to conflict-related factory damage; however, humanitarian corridors reopened in early 2025 are re-seeding light-industrial activity in Mekelle and Axum. Glass penetration there is likely to lag by two years because local beverage fillers first need to restore utilities and certify product safety. Southern coffee-growing zones, in contrast, leverage export premiums tied to EU deforestation compliance. Traceability protocols favor glass jars with QR-coded lids, a niche that lifted the southern share of the Ethiopian container glass market demand by 0.6 percentage points in 2025.
Logistical corridors remain pivotal. The electrified Addis-Djibouti railway reduces transit times for imported soda ash to 18 hours door-to-door, compared to 3 days by road. Alternate corridors via Port Sudan reduce geopolitical risk but add 9% to landed cost. Government road-building in Ethiopia’s Rift Valley aims to cut secondary-city delivery costs by 2027, a timetable that, if met, could release pent-up rural demand for refillable glass. Consequently, the geographic dispersion of demand is likely to shift from today’s 70-30 urban-rural split to a 60-40 balance by 2030, thereby smoothing volume seasonality in the Ethiopian container glass market.
Competitive Landscape
The market remains oligopolistic. Ethiopia Hansom International Glass operates a 42,000-tonnes-per-year furnace, supplying both domestic beverage majors and export customers in Sudan and Yemen. Its scale delivers cost leadership, enabling FOB pricing that undercuts Middle Eastern imports by 8%. Addis Ababa Bottle and Glass Share Company, with a capacity of 8,000 tonnes, focuses on niche runs and emergency orders, leveraging its proximity to downtown fillers to offset its smaller scale. Together, the two account for an estimated 88% of national pull, a structure that simplifies industry coordination but heightens the risk of supply continuity during rebuilds.
Investment sentiment has warmed since Directive No. 1001/2024 opened import-export channels to foreign equity, and at least two Asian float-glass players have scouted greenfield options near Adama. Should a third entrant commit to a 30,000-tonne furnace, competitive intensity could rise, forcing incumbents to accelerate oxy-fuel conversions and digital twin rollouts.[3]United Nations Industrial Development Organization, “Supporting Strategy for Ethiopia’s Chemical Industry,” unido.org Until then, customer relationships hinge on furnace-rebuild scheduling and color-campaign planning, with contract tenures averaging three years.
Strategic moves underscore the market’s evolving playbook. In July 2025, Hansom secured a long-term cullet-supply agreement with the Addis Ababa municipality targeting 75% glass-collection rates by 2027. Earlier, in January 2025, Addis Ababa Bottle and Glass installed a German hot-end inspection system that cut defect reject rates to 0.8% per 1 000 bottles, opening doors to pharmaceutical clientele. These initiatives highlight a pivot from pure capacity metrics to quality and sustainability credentials, themes likely to define the competitive frontier of the Ethiopia container glass market through 2030.
Ethiopia Container Glass Industry Leaders
Juniper Glass Industries SC.
Addis Ababa Bottle And Glass Share Company
Ardagh Glass Packaging–Africa (AGP–A)
Medicor Africa PLC
beta glass plc
- *Disclaimer: Major Players sorted in no particular order

Recent Industry Developments
- July 2024: The Ethiopian government implemented Directive No. 1001/2024, liberalizing foreign participation across 32 sectors, including import-export operations. This enables international glass suppliers and raw material importers to establish a direct market presence, potentially reducing supply-chain costs.
- July 2024: Ethiopia floated its exchange rate and secured a USD 3.4 billion IMF program focused on market-determined currency policies, improving foreign-exchange availability for glass manufacturers requiring imported raw materials and production equipment.
- June 2024: The Ministry of Finance issued an excise stamp management directive requiring digital stamps on alcoholic beverages, non-alcoholic carbonated beverages, and bottled water, creating compliance requirements that affect glass packaging operations and supply-chain tracking systems.
- April 2024: Heineken reported that its Q1 2025 Ethiopian operations achieved net revenue growth in the thirty's percentage range, despite high single-digit beer volume declines, demonstrating pricing power that supports premium glass-packaging demand in challenging market conditions.


Ethiopia Container Glass Market Report Scope
Glass Containers refer to clean bottles and jars made from glass. The scope excludes windows and other non-container glass products. Container glass is used in the alcoholic and non-alcoholic beverage industries due to its ability to maintain chemical inertness, sterility, and non-permeability. Glass packaging is valued for its unique properties, including its transparency, inertness, and ability to preserve the quality and integrity of its contents.
Ethiopia container glass market is segmented by end-user vertical (beverages [alcoholic beverages (beer, wine, spirits, and other alcoholic beverages {cider and other fermented drinks}), non-alcoholic beverages (juices, carbonated drinks (CSDs), dairy product-based drinks, other non-alcoholic beverages)], food [jam, jelly, marmalades, honey, sausages and condiments, oil, pickles], cosmetics and personal care, pharmaceuticals (excluding vials and ampoules), and perfumery), by color (green, amber, flint and other colors). The report offers market forecasts and size in volume (kilotons) for all the above segments.
| Beverages | Alcoholic | Beer |
| Wine | ||
| Spirits | ||
| Other Alcoholic Beverages (Cider and Other Fermented Drinks) | ||
| Non-Alcoholic | Juices | |
| Carbonated Drinks (CSDs) | ||
| Dairy Product Based Drinks | ||
| Other Non-Alcoholic Beverages | ||
| Food (Jam, Jelly, Marmalades, Honey, Sausages and Condiments, Oil, Pickles) | ||
| Cosmetics and Personal Care | ||
| Pharmaceuticals (excluding Vials and Ampoules) | ||
| Perfumery | ||
| Green |
| Amber |
| Flint |
| Other Colors |
| By End-user | Beverages | Alcoholic | Beer |
| Wine | |||
| Spirits | |||
| Other Alcoholic Beverages (Cider and Other Fermented Drinks) | |||
| Non-Alcoholic | Juices | ||
| Carbonated Drinks (CSDs) | |||
| Dairy Product Based Drinks | |||
| Other Non-Alcoholic Beverages | |||
| Food (Jam, Jelly, Marmalades, Honey, Sausages and Condiments, Oil, Pickles) | |||
| Cosmetics and Personal Care | |||
| Pharmaceuticals (excluding Vials and Ampoules) | |||
| Perfumery | |||
| By Color | Green | ||
| Amber | |||
| Flint | |||
| Other Colors | |||


Key Questions Answered in the Report
How large is the Ethiopia container glass market in 2026?
The market stands at 101.21 kilotons in 2026, with a 1.54% CAGR projected through 2031.
Which end-user segment consumes the most container glass in Ethiopia?
Beverages lead, accounting for 61.78% of volume in 2025 and remaining the anchor customer group through the forecast period.
What is the fastest-growing application for Ethiopia’s glass containers?
Cosmetics and personal care posts the quickest rise, advancing at a 2.67% CAGR between 2026 and 2031 as urban disposable incomes grow.
Why is amber glass demand rising in Ethiopia?
Pharmaceutical fill-and-finish investments and premium spirits positioning require ultraviolet protection, pushing amber glass to the highest color-segment CAGR at 2.18%.
How do power outages affect glass manufacturing in Ethiopia?
Firms face average outage costs of ETB 51 777 (USD 976), equal to 2.22% of monthly revenue, which can lower furnace utilization and squeeze margins.
What government policies support local glass production?
Incentives include import-substitution tax breaks, industrial-park infrastructure and foreign-investment liberalization under Directive No. 1001/2024, all aimed at expanding domestic capacity.
Page last updated on:


