Egypt Container Glass Market Size and Share
Market Overview
| Study Period | 2020 - 2031 |
|---|---|
| Forecast Data Period | 2026 - 2031 |
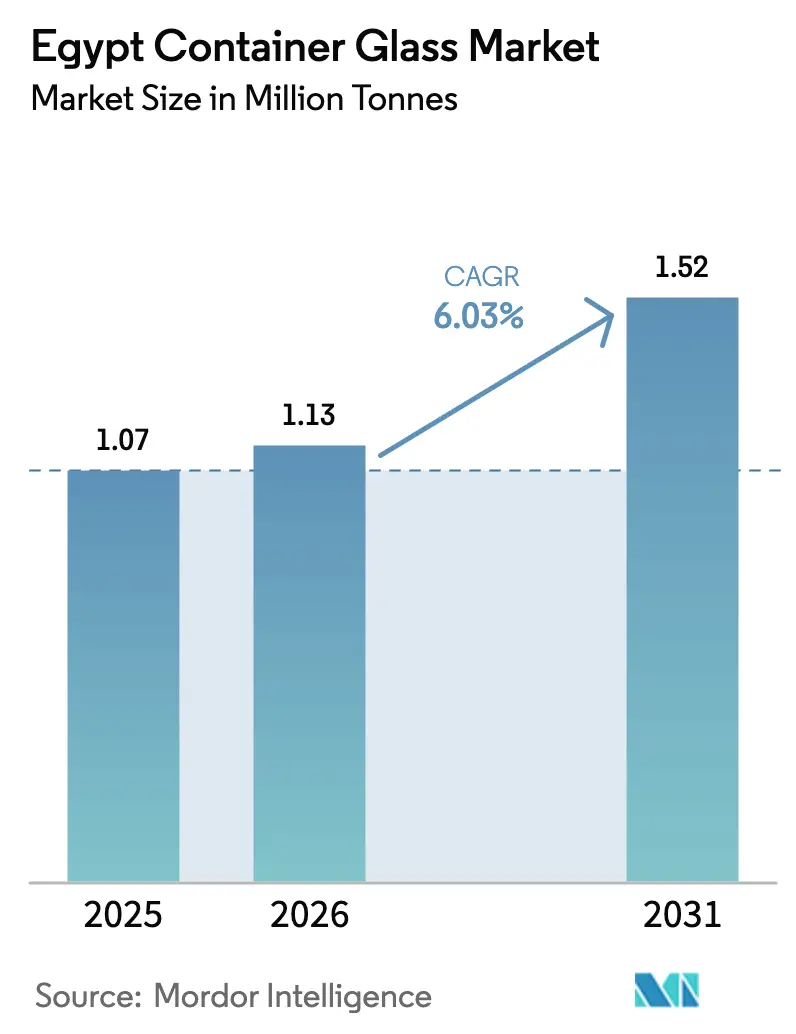
| Base Year Market Size (2025) | 1.07 Million tonnes |
| Market Volume (2026) | 1.13 Million tonnes |
| Market Volume (2031) | 1.52 Million tonnes |
| Growth Rate (2026 - 2031) | 6.03% CAGR |
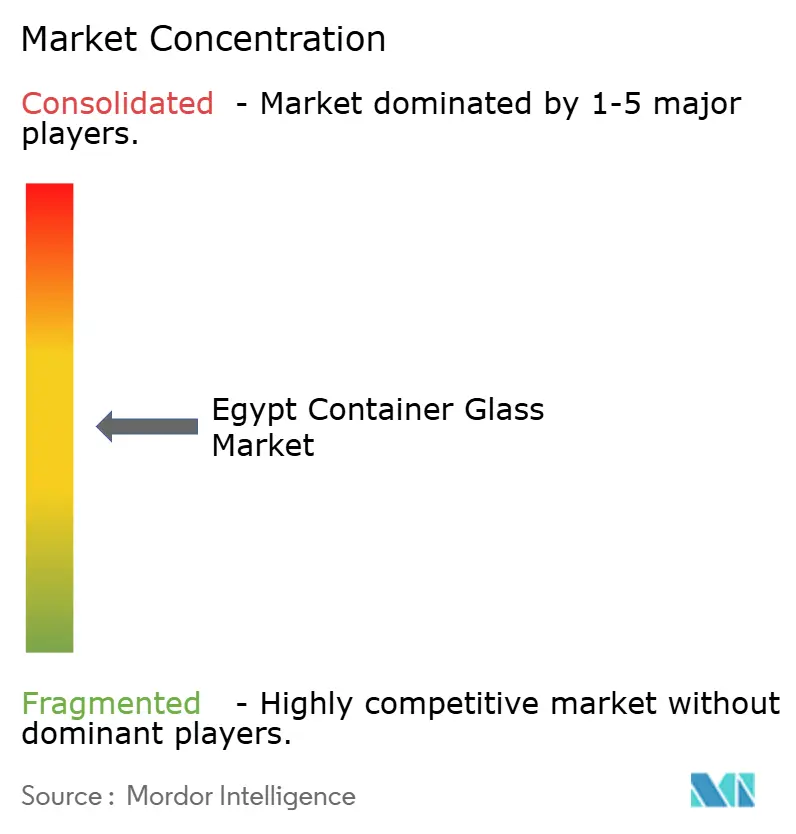
| Market Concentration | Medium |
Major Players *Disclaimer: Major Players sorted in no particular order Image © Mordor Intelligence. Reuse requires attribution under CC BY 4.0. | |
Egypt Container Glass Market Analysis by Mordor Intelligence
The Egypt Container Glass Market size was valued at 1.07 million tonnes in 2025 and estimated to grow from 1.13 million tonnes in 2026 to reach 1.52 million tonnes by 2031, at a CAGR of 6.03% during the forecast period (2026-2031). This growth trajectory reflects Egypt's strategic position as a regional manufacturing hub with abundant raw material resources and expanding end-user industries. The market benefits from the country's extensive silica sand reserves, which exceed 3 billion tons, and its established domestic soda ash production capacity of 130,000 tons annually, through Salvoy Alexandria. The beverages segment dominates the market, accounting for a 63.89% share in 2024, driven by Egypt's position as a regional hub for beverage production and the strategic advantages of returnable glass bottles in emerging markets. Coca-Cola HBC's Egyptian operations exemplify this trend, with returnable glass bottles serving as a key affordable packaging format, alongside significant investments in sustainable packaging innovation, supported by a USD 130 million EBRD loan.
Key Report Takeaways
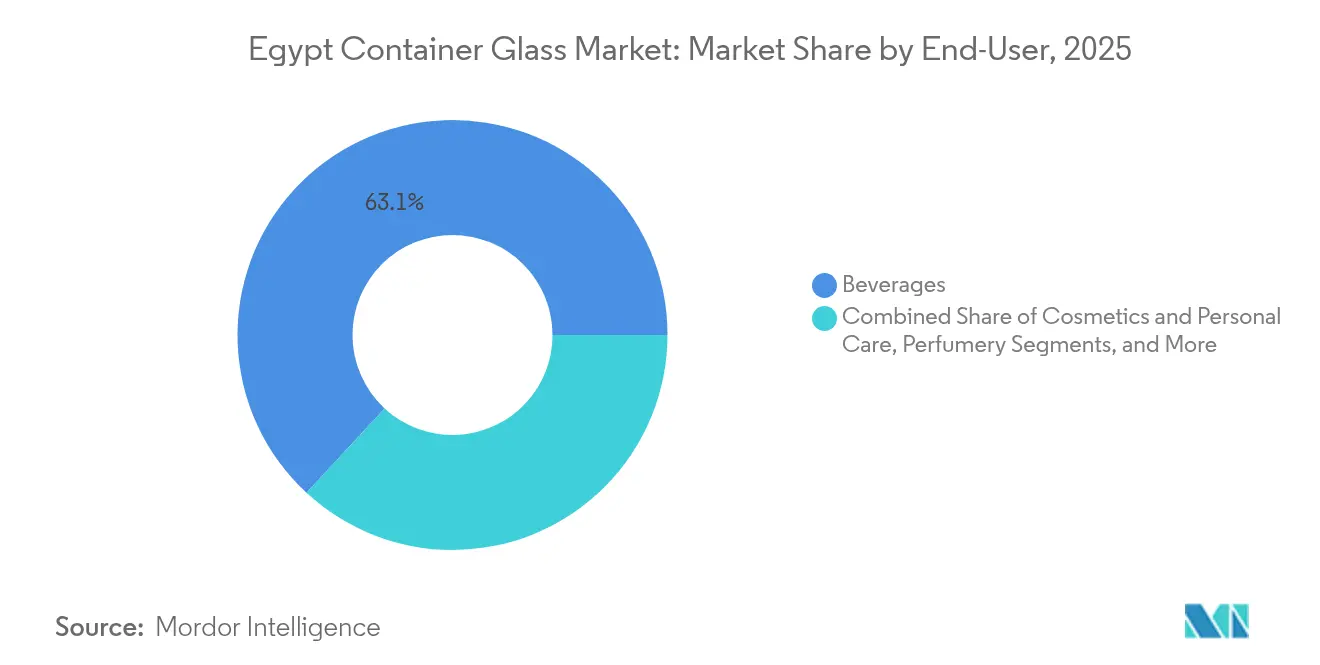
- By end-user, beverages captured 63.12% of the Egypt container glass market share in 2025.
- By color, the Egypt container glass market for amber glass is projected to grow at a 7.33% CAGR between 2026-2031.
Note: Market size and forecast figures in this report are generated using Mordor Intelligence’s proprietary estimation framework, updated with the latest available data and insights as of 2026.
Egypt Container Glass Market Trends and Insights
Drivers Impact Analysis*
| Driver | (~) % Impact on CAGR Forecast | Geographic Relevance | Impact Timeline |
|---|---|---|---|
| Expansion of food and cosmetics sectors | +1.8% | National, concentrated in Cairo and Alexandria industrial zones | Medium term (2-4 years) |
| Rising consumer preference for sustainable packaging | +1.2% | National, with urban centers leading adoption | Long term (≥ 4 years) |
| Tourism recovery boosting premium packaging demand | +0.9% | National, concentrated in Red Sea and Mediterranean coastal regions | Short term (≤ 2 years) |
| Increased foreign investment in packaging infrastructure | +0.7% | National, focused on industrial development zones | Medium term (2-4 years) |
| Glass recycling initiatives and circular economy policies | +0.6% | National, with pilot programs in major cities | Long term (≥ 4 years) |
| Health-conscious trends favoring inert packaging materials | +0.5% | National, driven by urban consumer segments | Medium term (2-4 years) |
| Source: Mordor Intelligence | |||
Expansion of Food and Cosmetics Sectors
Egypt's food processing and cosmetics industries are experiencing robust expansion, creating substantial demand for premium container glass packaging. The government's textile and manufacturing modernization program, which includes the inauguration of seven textile factories worth EGP 31 billion in 2024, signals broader industrial growth that extends to ancillary sectors, such as food processing and personal care manufacturing. The planned expansion of cottonseed oil production to 20,000 tons annually from ginning facilities directly increases demand for edible oil containers, where glass provides superior barrier properties against oxidation compared to plastic alternatives. This industrial diversification strategy positions Egypt as a regional manufacturing hub, with container glass serving as critical packaging infrastructure for value-added agricultural and cosmetic products targeting both domestic and export markets.
Rising Consumer Preference for Sustainable Packaging
Consumer awareness of environmental sustainability is driving a fundamental shift toward recyclable packaging materials, with glass emerging as the preferred choice for environmentally conscious brands and consumers. Glass offers near-infinite recyclability without quality degradation, with each 10% increase in recycled cullet reducing melting energy consumption by approximately 3% and CO₂ emissions by 4-10%. Egypt's circular economy initiatives, exemplified by SIG's partnership with Plastic Bank and local recyclers to establish the country's first end-to-end beverage carton recycling system, demonstrate growing institutional support for packaging circularity.[1]CNS Media, “SIG leads beverage carton recycling project to boost circularity in Egypt,” PACKAGINGINSIGHTS.COM This trend particularly benefits premium segments where sustainability credentials justify higher packaging costs, creating opportunities for Egyptian glass manufacturers to position products as environmentally superior alternatives to single-use plastics.
Tourism Recovery Boosting Premium Packaging Demand
Egypt's tourism sector recovery is generating increased demand for premium packaging across hospitality and retail channels, though the sector faces ongoing challenges from regional logistics disruptions. The country's strategic focus on renewable energy development, targeting 42% of installed power capacity from renewables by 2035, aims to restore the electricity surplus that previously supported industrial growth before the 2023-24 economic crisis. Hotels, restaurants, and tourism-related retail establishments increasingly specify glass packaging for beverages and food products to enhance perceived quality and align with international hospitality standards. The premium positioning of glass containers supports higher margins for tourism-oriented products, while the reusable nature of glass bottles provides cost advantages for establishments with high-volume beverage service, particularly in resort and hospitality applications where returnable bottle programs can be effectively implemented.
Increased Foreign Investment in Packaging Infrastructure
Foreign direct investment in Egypt's packaging sector is accelerating modernization and capacity expansion, with multinational companies establishing local production capabilities to serve regional markets. Coca-Cola HBC's USD 130 million EBRD loan specifically targets investments in energy-efficient coolers and sustainable packaging innovation, including the installation of additional PET lines in Egypt to meet growing demand for energy drinks introduced in 2023. This investment pattern reflects Egypt's attractiveness as a manufacturing base for serving Middle East and North African markets, leveraging the country's abundant raw materials, including high-grade silica sand deposits with SiO₂ content exceeding 98% after beneficiation. Foreign investment brings advanced manufacturing technologies and quality standards that enhance the competitiveness of Egyptian container glass production in regional and international markets.
Restraints Impact Analysis*
| Restraint | (~) % Impact on CAGR Forecast | Geographic Relevance | Impact Timeline |
|---|---|---|---|
| Energy cost volatility impacting furnace operations | -1.4% | National, affecting all glass manufacturing facilities | Short term (≤ 2 years) |
| Competition from PET and aluminum packaging | -1.1% | National, concentrated in beverage and food packaging segments | Medium term (2-4 years) |
| Import dependency for certain raw materials | -0.8% | National, affecting specialized glass grades | Medium term (2-4 years) |
| Economic fluctuations affecting capital expenditure | -0.6% | National, impacting industrial investment decisions | Short term (≤ 2 years) |
| Source: Mordor Intelligence | |||
Energy Cost Volatility Impacting Furnace Operations
Energy cost inflation presents the most significant operational challenge for Egypt's container glass industry, with commercial electricity tariffs increasing 16-26% in January 2024 as part of power sector liberalization efforts. Glass melting operations consume 70-80% of total manufacturing energy at temperatures exceeding 1,400-1,600 °C, making furnace operations highly sensitive to energy price fluctuations. The elimination of Egypt's electricity surplus due to the 2023-24 economic crisis forced the country to import natural gas for power generation and implement rolling power cuts, creating operational uncertainty for energy-intensive industries. Manufacturers are responding by accelerating investments in energy-efficient technologies including oxy-fuel combustion systems that can reduce energy consumption by 10-50% depending on furnace size, and waste heat recovery systems that can save up to 20% of specific energy consumption while increasing production capacity.
Competition from PET and Aluminum Packaging
Intensifying competition from lightweight packaging alternatives poses a structural challenge to container glass market expansion, particularly in price-sensitive beverage and food segments. PET packaging offers significant weight advantages that reduce transportation costs and handling complexity, while multilayer PET with oxygen scavengers can approach glass-like barrier properties for many applications. The cost differential becomes more pronounced as energy prices increase, with glass manufacturing facing higher operational costs while PET production benefits from relatively stable petrochemical feedstock pricing. However, glass maintains competitive advantages in premium segments where barrier properties, chemical inertness, and recyclability justify higher costs, particularly for wine, premium juices, and pharmaceutical applications where product integrity and shelf-life requirements favor glass containers over plastic alternatives.
*Our forecasts treat driver/restraint impacts as directional, not additive. The impact forecasts reflect baseline growth, mix effects, and variable interactions.
Segment Analysis
By End-User: Beverages Drive Volume While Cosmetics Accelerate
The beverages segment maintains its dominant position, with a 63.12% market share in 2025, reflecting Egypt's role as a regional hub for beverage production and the strategic importance of returnable glass bottles in emerging market economies. Alcoholic beverages, particularly beer and wine, benefit from the superior barrier properties of glass packaging, which prevent oxidation and maintain product quality during extended storage periods. Non-alcoholic beverages, including carbonated soft drinks and juices, often utilize glass containers for premium positioning. Coca-Cola HBC's Egyptian operations have demonstrated strong performance in returnable glass bottle formats, which support affordability while reducing packaging waste.
The cosmetics and personal care segment exhibits the fastest growth trajectory at 7.72% CAGR for 2026-2031, driven by Egypt's expanding beauty industry and consumer preference for premium packaging that preserves product integrity. Glass containers provide chemical inertness that prevents interaction with sensitive cosmetic formulations, while offering design flexibility that supports brand differentiation in competitive retail environments. The pharmaceuticals segment, excluding vials and ampoules, maintains steady demand for amber glass containers that provide light protection for photosensitive medications. Food applications including jams, jellies, and condiments benefit from glass packaging's heat sterilization capabilities and consumer perception of quality, though growth remains constrained by cost considerations in price-sensitive food categories.


By Color: Flint Dominance Challenged by Amber Growth
Flint glass commands 66.45% market share in 2025, primarily serving beverages and food applications where product visibility drives consumer preference and marketing effectiveness. The transparency of flint glass enables product showcase that supports premium positioning strategies, particularly important for craft beverages, premium juices, and specialty food products targeting quality-conscious consumers. However, amber glass demonstrates superior growth momentum at 7.33% CAGR, reflecting increasing demand for light-sensitive products including premium edible oils, pharmaceuticals, and craft beverages where light protection justifies the color premium.
The shift toward amber glass aligns with scientific evidence demonstrating superior oxidative stability compared to colorless alternatives, with brown glass providing optimal protection for sunflower oil and other light-sensitive products. Green glass maintains a stable but smaller market position, primarily serving wine and specialty beverage applications where tradition and brand identity favor colored containers. Other colors including blue and custom tints serve niche applications in cosmetics and premium spirits, though volumes remain limited by specialized production requirements and higher manufacturing costs associated with specialty color formulations.

Geography Analysis
Egypt's container glass market benefits from the country's strategic geographic position at the intersection of Africa, Asia, and Europe, allowing for efficient access to regional export markets while meeting substantial domestic demand. The concentration of manufacturing facilities in the Nile Delta region, particularly around Cairo and Alexandria, leverages proximity to major population centers and established industrial infrastructure, including the Salvoy Alexandria soda ash plant with 130,000 tons annual capacity.
Egypt's glass exports to the United States totaled USD 65.56 million in 2024, representing a significant portion of the country's total merchandise exports of USD 42.05 billion. The domestic market benefits from abundant raw material resources, including silica sand reserves exceeding 3 billion tons, with high-grade deposits in Sinai, El-Zaafarana, and El Wadi El Gedid regions, producing SiO₂ content above 98% after beneficiation. Regional trade dynamics face challenges from shipping disruptions affecting Red Sea routes, as vessels avoid the region due to security concerns, resulting in increased logistics costs and longer delivery times for both imports and exports.
Despite these headwinds, Egypt's established glass manufacturing infrastructure and raw material advantages position the country as a competitive regional supplier. The government's focus on industrial modernization, including textile sector investments worth EGP 31 billion in 2024, signals broader manufacturing sector support that benefits ancillary industries including container glass production. Export opportunities extend beyond traditional Middle Eastern markets to include European and African destinations, leveraging Egypt's preferential trade agreements and established maritime logistics capabilities through Alexandria and other Mediterranean ports.
Competitive Landscape
The Egyptian container glass market exhibits moderate concentration with a mix of established domestic producers and international players leveraging local manufacturing capabilities to serve regional markets. Market dynamics favor companies with integrated raw material supply chains, given Egypt's abundant silica sand resources and domestic soda ash production capacity that provides cost advantages over import-dependent competitors.
Strategic positioning emphasizes operational efficiency and energy management, particularly critical following the 16-26% increase in commercial electricity tariffs in January 2024 that directly impacts furnace operations consuming 70-80% of total manufacturing energy. Technology adoption focuses on energy-efficient furnace designs and waste heat recovery systems that can reduce specific energy consumption by up to 20% while increasing production capacity. Companies are investing in oxy-fuel combustion systems and electric melting technologies to mitigate energy cost volatility while improving environmental performance through reduced emissions.
White-space opportunities emerge in specialized applications including pharmaceutical packaging and premium cosmetics containers where chemical inertness and design flexibility command higher margins. The competitive landscape benefits from Egypt's strategic geographic position enabling efficient access to Middle Eastern, African, and European export markets, though regional shipping disruptions create logistics challenges that favor companies with diversified market exposure and flexible distribution capabilities.
Egypt Container Glass Industry Leaders
Middle East Glass Manufacturing Company S.A.E.
National Company for Glass and Crystal S.A.E.
Kandil Glass S.A.E.
United Glass Company (UGC)
SGD Pharma Egypt
- *Disclaimer: Major Players sorted in no particular order

Recent Industry Developments
- April 2025: SIG partnered with Plastic Bank, Carta Misr, and TileGreen to establish Egypt's first end-to-end recycling system for aseptic beverage cartons, creating formalized collection-to-reprocessing chains that prevent carton components from reaching landfills while enabling material circularity.
- October 2024: Egypt's renewable energy strategy targeting 42% of installed power capacity from renewables by 2035 faced implementation challenges due to economic crisis forcing natural gas imports for power generation and rolling power cuts, affecting industrial planning for energy-intensive manufacturing sectors.
- July 2024: Coca-Cola HBC installed additional PET production lines in Egypt to meet growing demand for energy drinks introduced in 2023, while simultaneously receiving USD 130 million EBRD financing for capital expenditure and working capital to support investments in energy-efficient coolers and sustainable packaging innovation.
- January 2024: Egyptian Electricity Holding Company implemented the first electricity tariff increases since 2021, raising commercial rates by 16-26% to ranges of 0.65-1.80 Egyptian pounds per kWh as part of government efforts to reduce power subsidies.


Egypt Container Glass Market Report Scope
Containers refer to clean bottles and jars made from glass. The scope excludes windows and other non-container glass products. Container glass is used in the alcoholic and non-alcoholic beverage industries due to its ability to maintain chemical inertness, sterility, and non-permeability. Glass packaging is valued for its unique properties, including its transparency, inertness, and ability to preserve the quality and integrity of its contents. The Bulgaria glass containers market tracks the shipment volume of different types of glass containers across end-user industries in the market.
Egypt container glass market is segmented by end-user vertical (beverages [alcoholic beverages (beer, wine, spirits, and other alcoholic beverages {cider and other fermented drinks}), non-alcoholic beverages (juices, carbonated drinks (CSDs), dairy product-based drinks, other non-alcoholic beverages)], food [jam, jelly, marmalades, honey, sausages and condiments, oil, pickles], cosmetics and personal care, pharmaceuticals (excluding vials and ampoules), and perfumery), by color (green, amber, flint and other colors). The report offers market forecasts and size in volume (kilotons) for all the above segments.
| Beverages | Alcoholic | Beer |
| Wine | ||
| Spirits | ||
| Other Alcoholic Beverages (Cider and Other Fermented Drinks) | ||
| Non-Alcoholic | Juices | |
| Carbonated Drinks (CSDs) | ||
| Dairy Product Based Drinks | ||
| Other Non-Alcoholic Beverages | ||
| Food (Jam, Jelly, Marmalades, Honey, Sausages and Condiments, Oil, Pickles) | ||
| Cosmetics and Personal Care | ||
| Pharmaceuticals (excluding Vials and Ampoules) | ||
| Perfumery | ||
| Green |
| Amber |
| Flint |
| Other Colors |
| By End-user | Beverages | Alcoholic | Beer |
| Wine | |||
| Spirits | |||
| Other Alcoholic Beverages (Cider and Other Fermented Drinks) | |||
| Non-Alcoholic | Juices | ||
| Carbonated Drinks (CSDs) | |||
| Dairy Product Based Drinks | |||
| Other Non-Alcoholic Beverages | |||
| Food (Jam, Jelly, Marmalades, Honey, Sausages and Condiments, Oil, Pickles) | |||
| Cosmetics and Personal Care | |||
| Pharmaceuticals (excluding Vials and Ampoules) | |||
| Perfumery | |||
| By Color | Green | ||
| Amber | |||
| Flint | |||
| Other Colors | |||


Key Questions Answered in the Report
What is the current container glass demand in Egypt?
Total demand stands at 1.13 million tons in 2026, with a forecast to reach 1.52 million tons by 2031.
How fast is Egypt’s container glass volume expected to grow?
The compound annual growth rate is projected at 6.03% through 2031, driven by beverage production expansion and rising cosmetic packaging needs.
Which end-user segment accounts for the highest share of container glass in Egypt?
Beverages hold 63.12% share as of 2025, reflecting widespread use of returnable bottles for soft drinks, beer, and juices.
Why is amber glass gaining popularity among Egyptian producers?
Demand for light-sensitive products such as premium edible oils and pharmaceuticals is rising, pushing amber glass to a 7.33% CAGR—higher than other color categories.
How are rising electricity prices affecting glass manufacturers?
January 2024 tariff hikes of 16-26% have increased furnace operating costs, prompting accelerated adoption of energy-efficient melting and heat-recovery technologies.
What sustainability initiatives support glass recycling in Egypt?
Partnerships like the 2025 SIG–Plastic Bank project are creating end-to-end collection and re-processing chains, strengthening circular-economy infrastructure for glass and other packaging materials.
Page last updated on:


