Indonesia Container Glass Market Size and Share
Market Overview
| Study Period | 2020 - 2031 |
|---|---|
| Forecast Data Period | 2026 - 2031 |
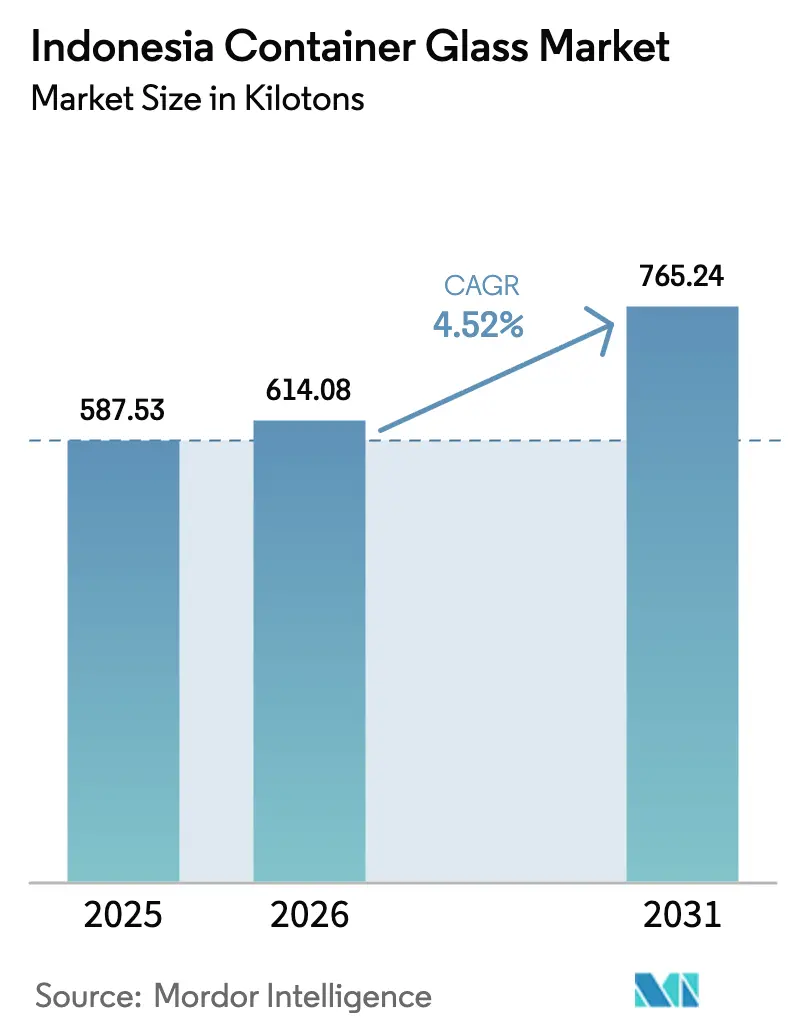
| Base Year Market Size (2025) | 587.53 kilotons |
| Market Volume (2026) | 614.08 kilotons |
| Market Volume (2031) | 765.24 kilotons |
| Growth Rate (2026 - 2031) | 4.52% CAGR |
| Market Concentration | High |
Major Players *Disclaimer: Major Players sorted in no particular order Image © Mordor Intelligence. Reuse requires attribution under CC BY 4.0. | |
Indonesia Container Glass Market Analysis by Mordor Intelligence
The Indonesia container glass market size was valued at 587.53 kilotons in 2025 and estimated to grow from 614.08 kilotons in 2026 to reach 765.24 kilotons by 2031, at a CAGR of 4.52% during the forecast period (2026-2031). Demand is being propelled by Indonesia’s rising disposable incomes, rapid urbanization, and the premiumization of beverages, pharmaceuticals, and cosmetics. Government-mandated circular-economy targets and Extended Producer Responsibility (EPR) rules further tilt brand owners toward infinitely recyclable glass packaging, while clustering of beverage and pharmaceutical plants in West Java and Banten lowers freight costs for glass suppliers. Energy-efficiency upgrades especially higher-yield oxy-fuel furnaces are becoming strategic priorities as natural-gas prices spike. Competitive intensity is moderate: domestic majors like PT Muliaglass and PT Culletprima Setia invest in furnace automation, whereas global leader O-I Glass optimizes its Indonesian footprint through selective capacity rationalization. Long-haul logistics across the archipelago still favor PET in price-sensitive categories, pushing glass makers to double down on premium niches such as specialty coffee, halal cosmetics, and export-grade herbal tonics.
Key Report Takeaways
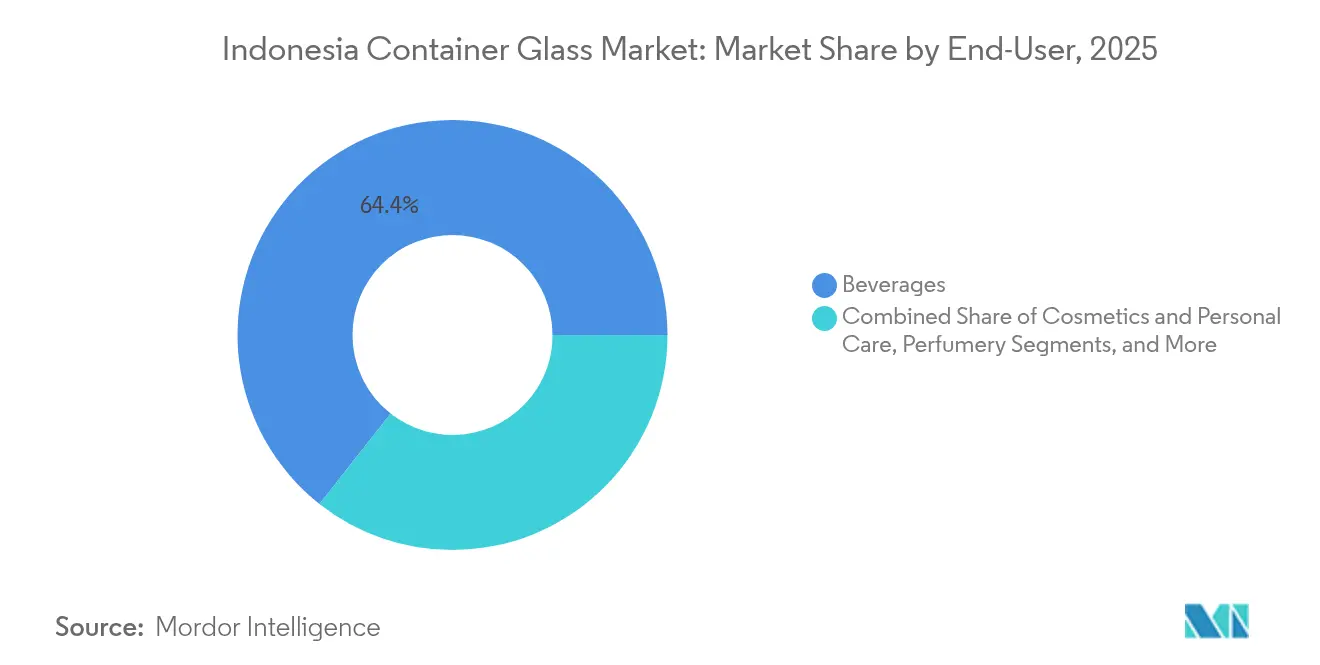
- By end-user, beverages captured 64.38% of the Indonesia container glass market share in 2025.
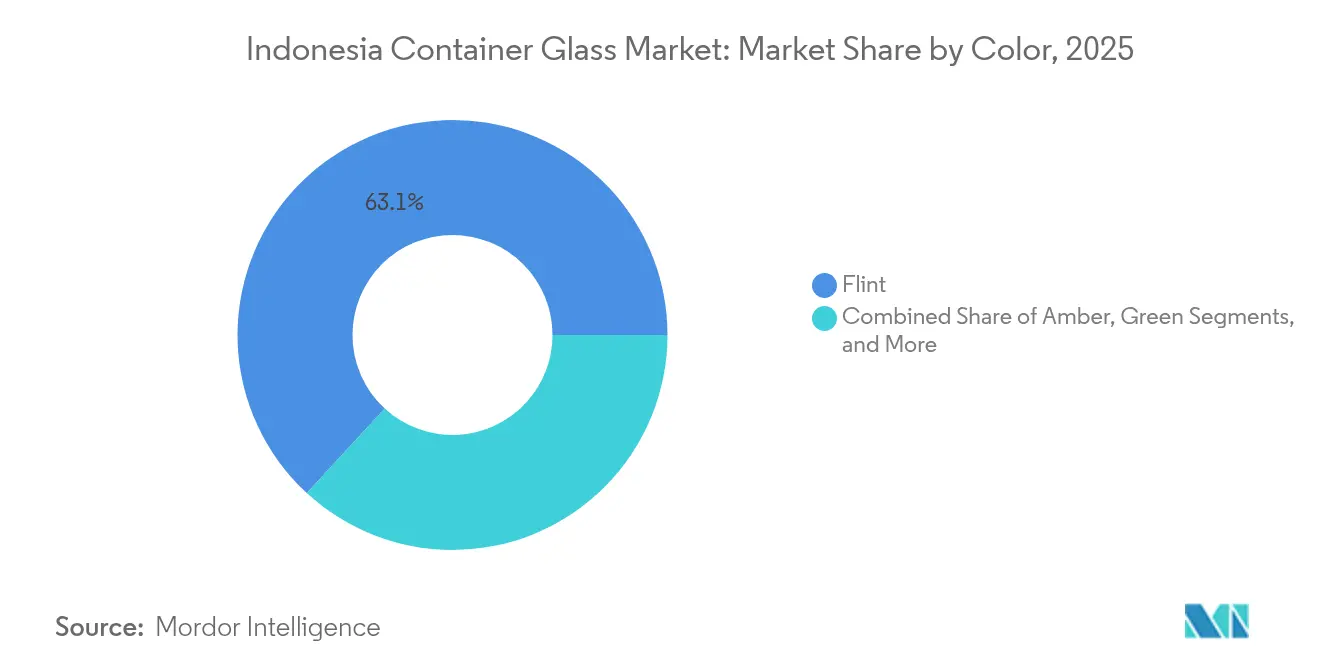
- By color, the Indonesia container glass market for amber glass is projected to grow at a 5.62% CAGR between 2026-2031.
Note: Market size and forecast figures in this report are generated using Mordor Intelligence’s proprietary estimation framework, updated with the latest available data and insights as of 2026.
Indonesia Container Glass Market Trends and Insights
Drivers Impact Analysis*
| Driver | (~) % Impact on CAGR Forecast | Geographic Relevance | Impact Timeline |
|---|---|---|---|
| Rising demand for eco-friendly, infinitely recyclable packaging | +1.2% | National, with concentration in Java and urban centers | Medium term (2-4 years) |
| Expanding beverage and pharmaceutical sectors | +1.8% | National, strongest in West Java, Central Java, and Banten | Long term (≥ 4 years) |
| Government EPR push and waste-reduction targets | +0.9% | National implementation with pilot programs in major cities | Short term (≤ 2 years) |
| On-premise refillable-bottle programs by café and RTD-tea chains | +0.4% | Urban centers, particularly Jakarta, Surabaya, and Bandung | Medium term (2-4 years) |
| Provincial green-manufacturing tax incentives (West Java, Banten) | +0.3% | West Java and Banten provinces | Short term (≤ 2 years) |
| Export surge of premium herbal tonics (jamu) to EU/US | +0.2% | National production with export focus | Long term (≥ 4 years) |
| Source: Mordor Intelligence | |||
Rising Demand for Eco-Friendly, Infinitely Recyclable Packaging
Middle-class consumers increasingly reward brands that deploy sustainable, premium-looking containers, and glass scores high on both dimensions. National marine-debris goals that target 70% plastic-waste abatement by 2025 make glass an EPR-compliant substitute for single-use plastics. Retail visibility is surging as Indomaret and Alfamart operate more than 35,000 outlets, each stocking value-added SKUs in flint or amber bottles. Leading food-and-beverage multinationals now highlight glass adoption in ESG scorecards to court sustainability-focused investors. Halal-certified cosmetics relying on glass flacons also reinforce the material’s premium halo, creating a virtuous cycle of demand in urban Indonesia.
Expanding Beverage and Pharmaceutical Sectors
Indonesia’s food-and-beverage value added rose 5.9% year-over-year in 2024, equal to IDR 1,531.4 trillion, while pharmaceutical sales track demographic aging and hospital build-outs. Ready-to-drink coffee and tea alone are on course for USD 1.71 billion in 2025, much of it packaged in flint or amber bottles that protect flavor volatiles during high-temperature filling. Pharmaceutical fill-finish plants increasingly specify Type III or amber USP-compliant glass to meet Halal Product Assurance rules, bolstering furnace utilization at specialty vial producers clustered in West Java.
Government EPR Push and Waste-Reduction Targets
Regulation P.75/2019 compels brand owners to reach 50% recycled content in glass packaging by 2025, incentivizing cullet loop-closure investments and producer take-back schemes. Over 3,000 waste-bank nodes in Greater Jakarta now funnel sorted glass back to container plants, trimming furnace energy by up to 25% when cullet ratios exceed 50%. Municipal licensing increasingly ties business permits to proof of EPR compliance, nudging even SMEs toward glass over multilayer plastics that face looming excise taxes.
On-Premises Refillable-Bottle Programs by Café and RTD-Tea Chains
Flagship cafés in Jakarta, Surabaya, and Bandung offer IDR 5,000 deposit-return schemes on 250 ml flint bottles, achieving payback periods below 18 months on a three-year depreciation cycle. Refillables cut packaging cost per serving by as much as 38%, according to feasibility studies benchmarking local bottled-water SMEs. Brand owners gain free mobile advertising whenever consumers bring the embossed refillables off-premise, a marketing upside plastic counterparts cannot replicate.
Restraints Impact Analysis*
| Restraint | (~) % Impact on CAGR Forecast | Geographic Relevance | Impact Timeline |
|---|---|---|---|
| Natural-gas price hikes increasing furnace costs | -1.4% | National, particularly affecting Java-based manufacturers | Short term (≤ 2 years) |
| PET bottles and lightweight cans gaining shelf share | -0.8% | National, strongest impact in beverage and food segments | Medium term (2-4 years) |
| Chronic cullet shortage from informal recycling losses | -0.5% | National, acute in regions with limited waste management | Long term (≥ 4 years) |
| Port congestion surcharges raising logistics cost and breakage risk | -0.3% | Archipelago-wide, concentrated at major ports | Short term (≤ 2 years) |
| Source: Mordor Intelligence | |||
Natural-Gas Price Hikes Increasing Furnace Costs
The sunset of the Harga Gas Bumi Tertentu subsidy on 31 December 2024 lifted feed-gas costs from USD 6 to more than USD 16 per MMBtu for container-glass furnaces, inflating the energy share of conversion costs to over 30%. Plants running side-port regenerative furnaces revisit capex plans for oxy-fuel retrofits that cut gas burn 15-20% but entail multi-million-dollar downtime expenses. Smaller players risk operating below 70% capacity, constricting supply and raising finished-goods prices, an unintended, but inevitable, pass-through to brand owners.
PET Bottles and Lightweight Cans Gaining Shelf Share
Coca-Cola Indonesia’s 100% recycled-PET rollout, backed by PT Amandina’s 3,000-tonne-per-month feedstock line, underscores PET’s agile cost structure and logistics edge across Indonesia’s 17,000 islands.[1]Starlinger, “PT Amandina Bumi Nusantara: Recycled PET for Coca-Cola’s First 100% rPET Bottles,” starlinger.com Lightweight aluminum cans also widen penetration in carbonated beverages because their high line speeds cut per-unit filling costs. Glass thus cedes volume in low-margin bottled-water and carbonated soft-drink channels, obliging manufacturers to pivot even harder toward premium niches where flavor preservation and visual appeal validate higher unit economics.
*Our forecasts treat driver/restraint impacts as directional, not additive. The impact forecasts reflect baseline growth, mix effects, and variable interactions.
Segment Analysis
By End-User: Beverages Drive Volume, Cosmetics Accelerate Growth
Beverages accounted for 64.38% of the Indonesian container glass market share in 2025, as hot, humid weather and the expansion of modern trade amplified packaged-drink consumption. Within this domain, non-alcoholic ready-to-drink tea and coffee lines crowd supermarket chillers in flint bottles, while craft beer and imported spirits spur the adoption of amber bottles to meet UV-protection requirements. Demand density around West Java’s industrial estates compresses lead times between breweries and bottle plants, a logistics unique to the Indonesian container glass market.
Cosmetics and personal care volumes remain modest but deliver the steadiest uptick at a 5.48% CAGR through 2031, aided by Indonesia’s ranking as the world’s second-largest halal-cosmetics consumer. Skincare serums and premium fragrances increasingly specify custom flint or tinted glass to showcase textures while safeguarding volatile actives. This premium aesthetic lets brand owners command price premiums that offset higher supply-chain costs versus plastic jars, reinforcing value capture within the Indonesian container glass market.


By Color: Flint Dominates, Amber Gains Premium Traction
Flint glass retained 63.15% of 2025 output, prized for transparency that assures consumers the contents are free from impurities. High-speed hot-end inspection lines installed by leading plants push defect rates below 0.2%, keeping flint-bottle scrap at bay even as throughput scales. The material’s versatility across carbonated drinks, condiments, and parenteral drugs cements its leadership in the Indonesia container glass market.
Amber glass, while only a third of flint’s volume, is expanding at a 5.62% CAGR on the back of premium beer, tonic, and pharmaceutical vials that require stringent photoprotection. Two domestic furnaces converted to continuous amber runs in 2024, signaling structural evolution toward specialty colors. The growth underscores how premiumization pivots the Indonesia container glass market size toward differentiated SKUs rather than undifferentiated mass-volume clearware.
Geography Analysis
Java accounted for nearly 68.90% of the Indonesian container glass market size in 2025, reflecting both demand-side density and supply-side clustering. West Java’s Cikarang and Bekasi estates house four of the nation’s six largest furnaces, giving beverage, pharma, and cosmetics plants same-day access to bottles and jars. Superior energy, water, and cullet availability keep unit conversion costs roughly 9% lower than in outer-island factories.
Sumatra is emerging as the fastest-growing region, forecast at a 5.05% CAGR to 2031, propelled by palm-oil downstreaming, modern retail rollouts in Medan and Palembang, and logistics upgrades along the Trans-Sumatra Toll Road. Glass distribution to Sumatra previously relied on break-bulk shipping from Java; localized bottling lines for palm-sugar syrup and herbal tonics now anchor fresh furnace investments in Lampung.
Eastern Indonesia, comprising Sulawesi, Maluku, and Papua, still represents less than 10.00% of the national volume but delivers outsized profitability in tourism hubs, where craft beer, artisanal jamu, and boutique cosmetics cater to high-spending visitors. Infrastructure gains under Pelindo’s port modernization drive have reduced berth-to-gate dwell times from 72 to 24 hours at Makassar and Sorong, thereby trimming breakage risk and freight charges for fragile containers.
Competitive Landscape
The Indonesian container glass market exhibits moderate fragmentation, with the top five producers accounting for roughly 50% of the installed capacity. PT Muliaglass operates float, automotive, and container lines within a single West Java complex and is piloting oxy-fuel burners to reduce furnace gas consumption by 15%.
Global giant O-I Glass continues restructuring, mothballing uncompetitive furnaces overseas while steering Indonesian assets toward high-margin amber.[3]O-I Glass, “Investors Newsroom,” o-i.com Specialist PT Culletprima Setia doubled its daily output to 200 tonnes in 2024 by adding a second furnace tailored for colored, high-recycled-content bottles, financed partly by ERP-enabled working capital efficiencies.
Technology providers from Japan and the EU are aggressively marketing rooftop solar, waste-heat recovery, and alternative-fuel burners, courting Indonesian glassmakers eager to mitigate gas-price volatility. Strategic focus now tilts toward upstream cullet sorting and downstream lightweighting to defend glass’s total cost of ownership against PET and cans.
Indonesia Container Glass Industry Leaders
PT Xinyi Glass Indonesia
O-I Glass, Inc.
PT Tamindo Permaiglass
PT Muliaglass
PT Ishizuka Maspion Indonesia
- *Disclaimer: Major Players sorted in no particular order


Recent Industry Developments
- September 2025: PT Amandina Bumi Nusantara became Indonesia’s first PET recycler certified under
- 2017: intensifying competitive pressure on entry-level glass in beverages.
- July 2025: O-I Glass disclosed USD 1.7 billion Q2 sales and revealed plans to idle one furnace amid its global optimization programs.
- June 2025: The Ministry of Industry launched “Kompetisi Startup Kosmetik,” granting mentoring to 15 SME formulators that will require upscale glass primary packaging.
- April 2025: McKinsey Global Institute projected Indonesia must sustain 5.4% real GDP CAGR to hit high-income status by 2045, a scenario that multiplies premium-packaged-goods demand.


Indonesia Container Glass Market Report Scope
Glass Containers refer to clean bottles and jars made from glass. The scope excludes windows and other non-container glass products. Container glass is used in the alcoholic and non-alcoholic beverage industries due to its ability to maintain chemical inertness, sterility, and non-permeability. Glass packaging is valued for its unique properties, including its transparency, inertness, and ability to preserve the quality and integrity of its contents.
Indonesia container glass market is segmented by end-user vertical (beverages [alcoholic beverages (beer, wine, spirits, and other alcoholic beverages {cider and other fermented drinks}), non-alcoholic beverages (juices, carbonated drinks (CSDs), dairy product-based drinks, other non-alcoholic beverages)], food [jam, jelly, marmalades, honey, sausages and condiments, oil, pickles], cosmetics and personal care, pharmaceuticals (excluding vials and ampoules), and perfumery, by color (green, amber, flint and other colors). The report offers market forecasts and size in volume (kilotons) for all the above segments.
| Beverages | Alcoholic | Beer |
| Wine | ||
| Spirits | ||
| Other Alcoholic Beverages (Cider and Other Fermented Drinks) | ||
| Non-Alcoholic | Juices | |
| Carbonated Drinks (CSDs) | ||
| Dairy Product Based Drinks | ||
| Other Non-Alcoholic Beverages | ||
| Food (Jam, Jelly, Marmalades, Honey, Sausages and Condiments, Oil, Pickles) | ||
| Cosmetics and Personal Care | ||
| Pharmaceuticals (excluding Vials and Ampoules) | ||
| Perfumery | ||
| Green |
| Amber |
| Flint |
| Other Colors |
| By End-user | Beverages | Alcoholic | Beer |
| Wine | |||
| Spirits | |||
| Other Alcoholic Beverages (Cider and Other Fermented Drinks) | |||
| Non-Alcoholic | Juices | ||
| Carbonated Drinks (CSDs) | |||
| Dairy Product Based Drinks | |||
| Other Non-Alcoholic Beverages | |||
| Food (Jam, Jelly, Marmalades, Honey, Sausages and Condiments, Oil, Pickles) | |||
| Cosmetics and Personal Care | |||
| Pharmaceuticals (excluding Vials and Ampoules) | |||
| Perfumery | |||
| By Color | Green | ||
| Amber | |||
| Flint | |||
| Other Colors | |||


Key Questions Answered in the Report
How large is the Indonesia container glass market in 2026?
It stands at 614.08 kilotons and is on track for 765.24 kilotons by 2031, reflecting a 4.52% CAGR.
Which end-use absorbs the most container glass in Indonesia?
Beverages lead with 64.38% of 2025 volume and continue to dominate through the forecast window.
Why is amber glass gaining share?
Premium beer, herbal tonics, and pharma vials need UV protection, driving amber’s forecast 5.62% CAGR.
How are gas-price hikes affecting glass manufacturers?
Removal of the gas subsidy lifted feed-gas costs above USD 16/MMBtu, pushing energy to over 30% of conversion expenses.
What role do EPR regulations play in market growth?
Regulation P.75/2019 mandates 50% recycled content in glass packaging by 2025, stimulating cullet demand and favoring glass over single-use plastics.
Which region is the fastest growing outside Java?
Sumatra, benefiting from industrialization and new toll-road connectivity, at an anticipated 5.05% CAGR through 2031.
Page last updated on:


