
Tube Packaging Market Size and Share
Market Overview
| Study Period | 2020 - 2031 |
|---|---|
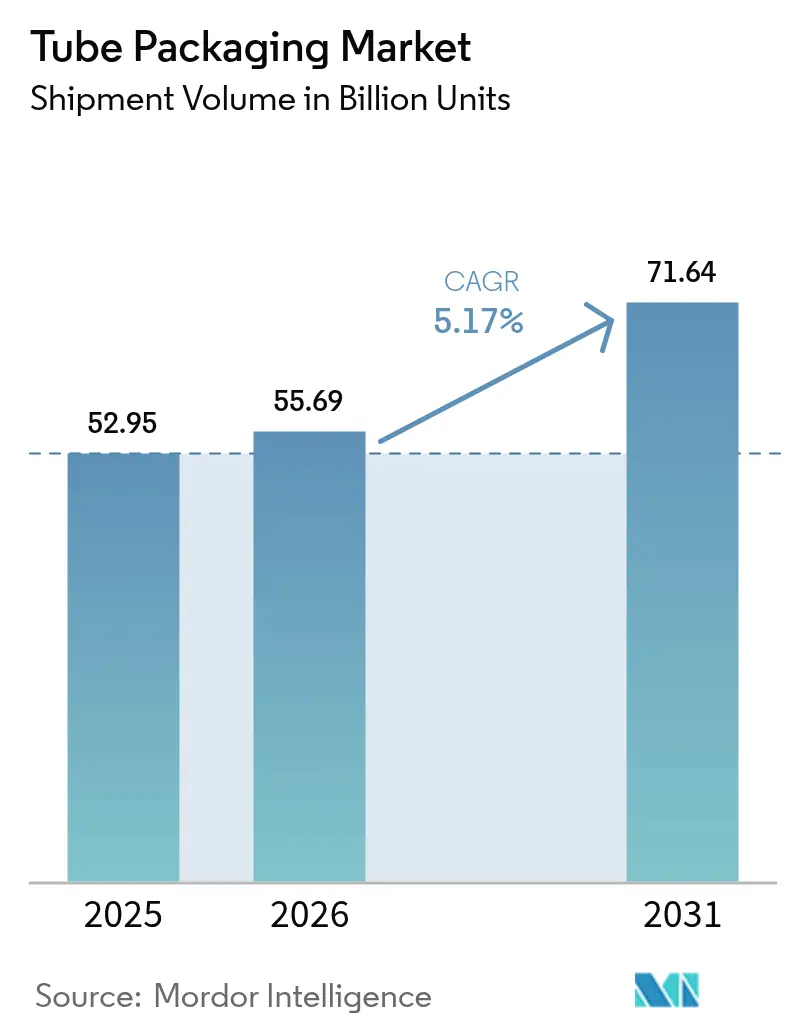
| Market Volume (2026) | 55.69 Billion units |
| Market Volume (2031) | 71.64 Billion units |
| Growth Rate (2026 - 2031) | 5.17 % |
| Fastest Growing Market | Asia Pacific |
| Largest Market | Asia Pacific |
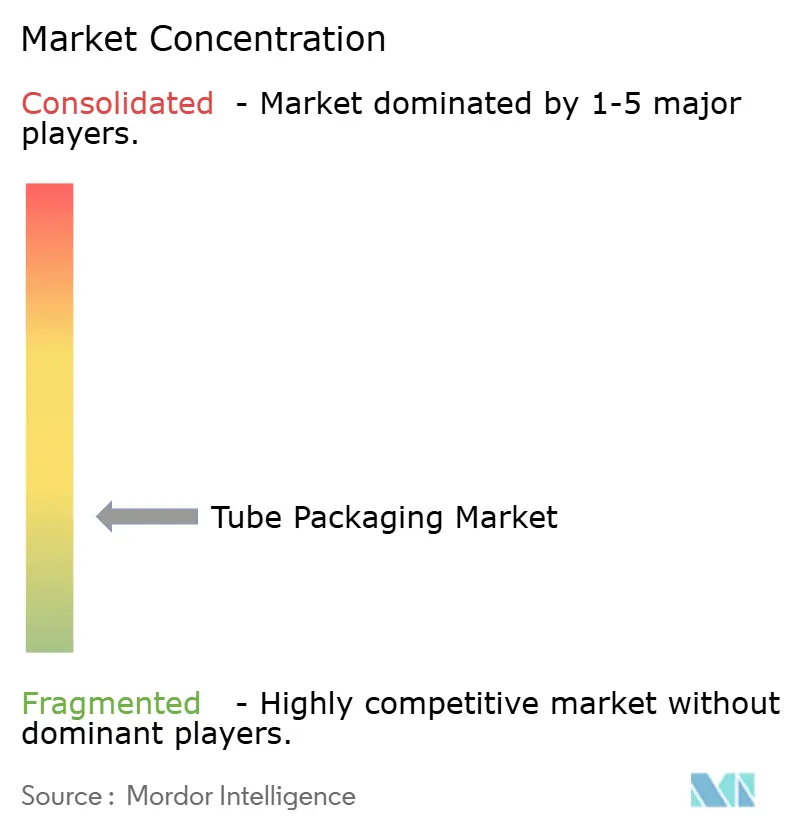
| Market Concentration | Low |
Major Players *Disclaimer: Major Players sorted in no particular order Image © Mordor Intelligence. Reuse requires attribution under CC BY 4.0. | |
Tube Packaging Market Analysis by Mordor Intelligence
Tube packaging market size in 2026 is estimated at 55.69 billion units, growing from 2025 value of 52.95 billion units with 2031 projections showing 71.64 billion units, growing at 5.17% CAGR over 2026-2031. Regulatory mandates that require recyclability by 2030, combined with rising consumer demand for sustainable solutions, are compelling manufacturers to invest in mono-material and recycled-content formats. Paperboard and bio-based tubes record the fastest growth at 8.81% CAGR, while plastic formats retain volume leadership because of established processing infrastructure. End-use diversification into ready-to-eat foods and over-the-counter pharmaceuticals broadens revenue streams as brands prioritize convenience and precise dosing. Continued merger activity, led by Amcor’s USD 8.4 billion combination with Berry Global, is reshaping competitive dynamics and accelerating innovation in barrier technologies that limit reliance on multi-layer plastics.
Key Report Takeaways
- By product type, plastic tubes led with 62.53% revenue share in 2025; paperboard and bio-based formats are forecast to expand at an 8.58% CAGR through 2031.
- By packaging type, squeeze and collapsible formats held 66.72% of the tube packaging market share in 2025, while the twist formats are expected to post a 5.43% CAGR to 2031.
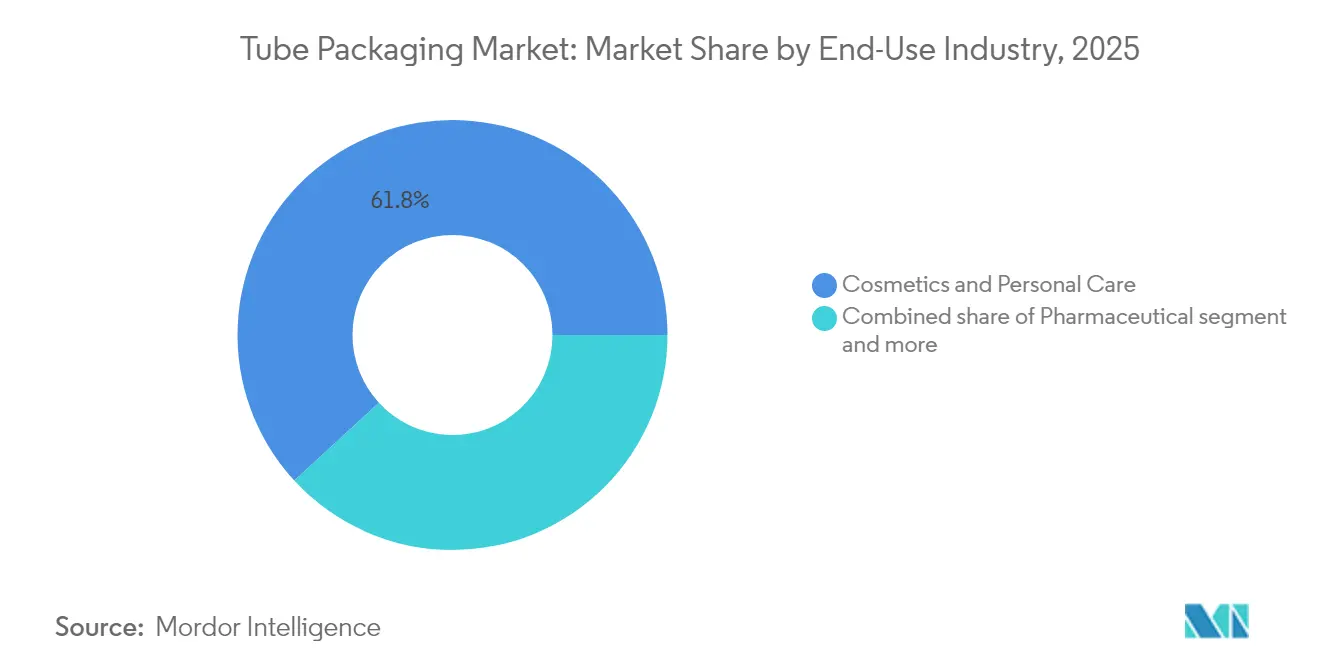
- By end-use industry, cosmetics and personal care accounted for 61.84% of the tube packaging market size in 2025; food applications are projected to advance at an 6.36% CAGR between 2026 and 2031.
- By distribution channel, direct sales captured 67.05% share of the tube packaging market size in 2025, while indirect sales are projected to rise at a 5.61% CAGR.
- By geography, Asia-Pacific commanded 35.38% of 2025 volumes, and the region is forecast to grow at a 5.74% CAGR to 2031.
Note: Market size and forecast figures in this report are generated using Mordor Intelligence’s proprietary estimation framework, updated with the latest available data and insights as of 2026.
Market Trends and Insights
Drivers Impact Analysis of Tube Packaging Market*
| Driver | (~) % Impact on CAGR Forecast | Geographic Relevance | Impact Timeline |
|---|---|---|---|
| Rising Demand in Personal Care and Cosmetics | +1.2% | Global, with concentration in APAC and North America | Medium term (2-4 years) |
| Growing Consumer Preferences for Sustainable Packaging | +1.8% | EU and North America core, expanding to APAC | Long term (≥ 4 years) |
| Recyclability Mandates Boosting Mono-material Tubes | +0.9% | EU primary, North America secondary | Short term (≤ 2 years) |
| Rising Demand for Convenience and Versatility | +0.7% | Global, particularly developed markets | Medium term (2-4 years) |
| Global FMCG CAPEX Push into Hybrid-barrier Technologies | +0.6% | Global, led by multinational FMCG companies | Medium term (2-4 years) |
| Source: Mordor Intelligence | |||
Rising Demand in Personal Care and Cosmetics
Beauty brands continue to premiumize product lines, which favors tubes that protect sensitive formulations and allow controlled dispensing. Albéa has trimmed concept-to-launch cycles while integrating recycled content, pursuing a 46% carbon-reduction target for 2030. [1]Source: Formes de Luxe, “Albéa's François Tassart: 'Increasing our agility in the highly volatile beauty market is key',” formesdeluxe.com Colgate’s clear PET Elixir tube with EveryDrop coating improves product evacuation, underscoring user experience gains that strengthen brand loyalty. Visibility into material provenance and carbon footprint is also improving, supporting marketing narratives that resonate with eco-conscious shoppers.
Growing Consumer Preferences for Sustainable Packaging
Household-name oral care brands have shifted from composite laminates toward fully recyclable high-density polyethylene formats that can enter mainstream kerbside streams in the United Kingdom. Neopac became the first European tube maker to earn RecyClass EN 15343 certification, validating traceable recycled content and strengthening its competitive edge. [2]Source: Hoffmann Neopac AG, “Neopac The Tube – News & Events,” neopac.com Such milestones convert sustainability compliance into market differentiation, pushing the tube packaging market toward higher-value innovations.
Recyclability Mandates Boosting Mono-material Tubes
The EU Packaging and Packaging Waste Regulation obliges all consumer packs to be recyclable by 2030 and sets a 30% recycled-plastic threshold by the same year. [3]Source: NSF, “New EU Regulation 2025/40 on Packaging and Packaging Waste,” nsf.org Suppliers including DNP Group and ExxonMobil have commercialized polyethylene-rich structures that sustain oxygen-barrier performance, proving that mono-material tubes can replace multi-layer laminates without compromising shelf life. Investment allocation is therefore shifting toward polymers engineered for circularity.
Rising Demand for Convenience and Versatility
Heat and ultrasonic sealing options enable custom barrier performance across plastics, laminates, and metals, supporting product safety and ease of use. Adjustable tube diameters and cap assemblies help brands tailor dosing to viscosity, making tubes attractive for pharmaceuticals, condiments, and industrial pastes. These functional upgrades encourage repeat purchase, maintaining momentum in the tube packaging market.
Restraints Impact Analysis of Tube Packaging Market*
| Restraint | (~ )% Impact on CAGR Forecast | Geographic Relevance | Impact Timeline |
|---|---|---|---|
| Availability of Substitutes | -0.8% | Global, particularly in mature markets | Medium term (2-4 years) |
| Raw Material Shortages and Fluctuating Costs | -1.1% | Global, with acute impact in manufacturing hubs | Short term (≤ 2 years) |
| Limited Product Compatibility Restricting Market Penetration | -0.5% | Global, particularly in specialized applications | Long term (≥ 4 years) |
| Source: Mordor Intelligence | |||
Availability of Substitutes
Stand-up pouches, which combine light weight, easy opening, and reduced material use, are projected to hit USD 47 billion by 2029, drawing sauce and condiment brands away from tubes. MasterFoods’ recyclable paper single-dose pack further illustrates how alternate formats can satisfy sustainability and portion-control priorities. These innovations pressure tube producers to highlight functional strengths, such as precise dosing and high oxygen barrier, to prevent volume erosion.
Raw Material Shortages and Fluctuating Costs
Feedstock volatility complicates budget planning for plastics, aluminum, and coatings. Global PET supply has tightened because of geopolitical unrest and producer run-rate cuts, even as commodity resin prices trend flat to down in early 2025. Europe’s aluminum smelters are grappling with elevated power costs, pushing converters to re-engineer tubes with thinner walls or integrate recycled metal to offset price swings.
*Our forecasts treat driver/restraint impacts as directional, not additive. The impact forecasts reflect baseline growth, mix effects, and variable interactions.
Tube Packaging Market Segment Analysis
By Product Type:
Plastic Dominance Faces Sustainable DisruptionPlastic formats accounted for 62.53% of tube packaging market share in 2025, supported by cost-efficient extrusion lines and universal brand familiarity. Within plastics, high-density polyethylene and polypropylene accommodate diverse viscosities, from creams to gels, ensuring cross-industry versatility. Laminates that stack polymer and aluminum layers continue to protect oral-care formulas where flavor retention is essential. Aluminum tubes, though niche, preserve volatile pharmaceutical actives and oxygen-sensitive foods, reinforcing a premium-priced foothold.
Paperboard and bio-based solutions, however, outpace the broader tube packaging market at an 8.58% CAGR as the PPWR accelerates the shift toward renewable substrates. Huhtamaki’s OmniLock Ultra barrier paper delivers aluminum-like protection while remaining curbside-recyclable. Amcor’s patented AmFiber Performance Paper similarly targets food and healthcare segments, proving that fiber-based structures can satisfy strict moisture limits. As adoption widens, plastic’s volume lead is expected to narrow in absolute terms, even if it retains scale advantages.




By Packaging Type:
Squeeze Technology Drives Market LeadershipSqueeze and collapsible tubes represented 66.72% of 2025 shipments and are projected to rise at a 4.91% CAGR, reflecting strong consumer affinity for one-handed dispensing. Impact-extruded aluminum versions ensure zero air ingress for dermatological creams, whereas co-extruded plastic variants lower weight and enhance graphic appeal. Laminated squeeze tubes remain the oral-care standard because of flavor-barrier proficiency.
Twist and precision-applicator designs fill specialized roles in prescription dermatology and luxury cosmetics where dosage accuracy is paramount. Innovations such as in-mold-label polypropylene tubes merge decoration and structure in a single step, improving line efficiency and recyclability. The breadth of sealing and decoration options keeps squeeze formats adaptable, cementing their lead in the tube packaging market.
By End-Use Industry:
Cosmetics Leadership Challenged by Food GrowthCosmetics and personal care captured 61.84% of 2025 volumes, exploiting tubes’ ability to deliver controlled, hygienic dosing of serums, scrubs, and sunscreens. Transparent PET structures underscore formula aesthetics, while soft-touch closures elevate perceived value. Pharmaceuticals follow closely, driven by topical antibiotic creams that require tamper evidence and barrier integrity.
Food applications, although starting from a smaller base, are forecast to grow at 6.36% CAGR, the fastest within the tube packaging market. Aseptic filling of pesto, honey, and tomato paste reduces preservatives, extends shelf life, and supports gourmet positioning. Paper-based single-dose packs and recyclable laminates appeal to on-the-go consumers and quick-service operators seeking portion control with minimal waste.
By Distribution Channel:
Direct Sales Dominance Faces Indirect GrowthDirect agreements with multinationals such as Unilever and Colgate yielded 67.05% of 2025 shipments, ensuring predictable order volumes and joint innovation roadmaps. Large converters like EPL International run dedicated lines for flagship customers, supplying roughly 1 billion laminated tubes yearly from four global plants.
Indirect channels, projected to grow at 5.61% CAGR, are capturing emerging brands that prioritize agility over volume discounts. Specialized distributors stock smaller production runs and offer design services for start-ups entering natural cosmetics or functional foods. The dual-track structure allows the tube packaging market to accommodate divergent customer scales without compromising service levels.
Geography Analysis
APAC Tube Packaging Market
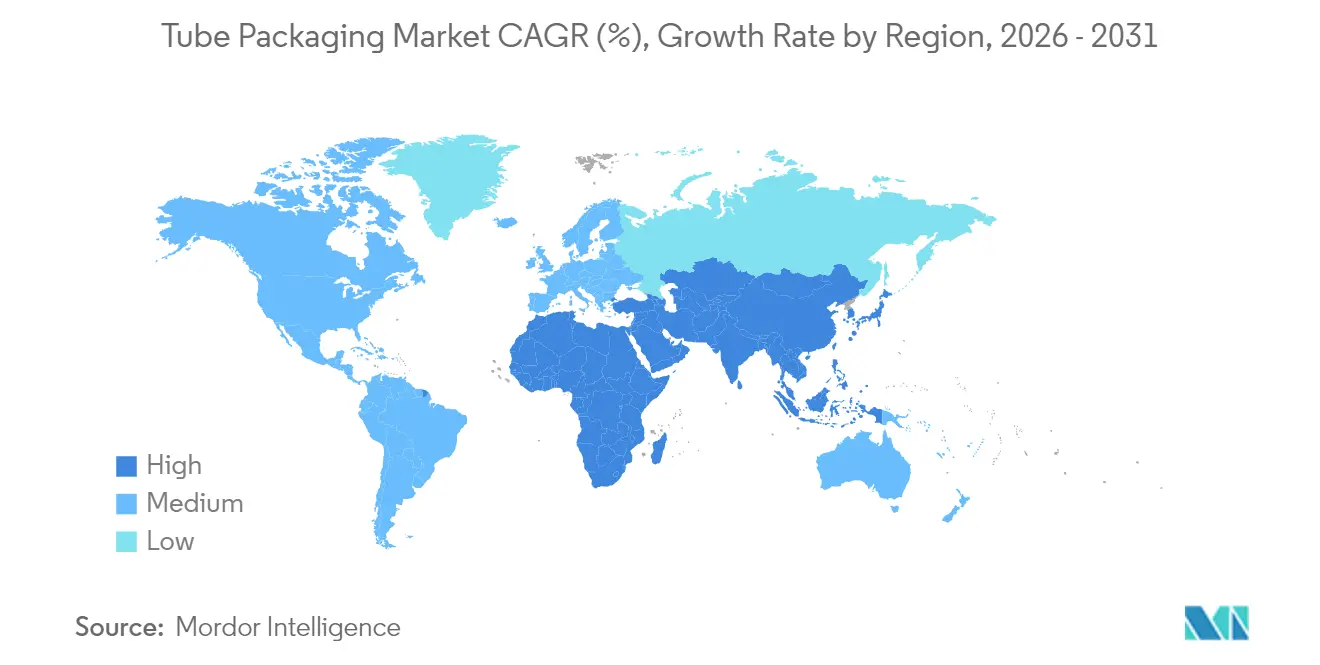
Asia-Pacific led the tube packaging market in 2025 with a 35.38% volume share and is expected to advance at 5.74% CAGR through 2031. Robust FMCG expansion in China and India, higher disposable income, and urban lifestyles underpin demand for travel-friendly personal care items and single-serve condiments. Vietnam’s paper segment, on course for USD 3.5 billion revenue by 2026, illustrates regional momentum toward fiber-based packaging.
North America and Europe Tube Packaging Market
North America and Europe, while mature, are navigating stricter recycling targets that reshape sourcing strategies and capital allocation. The EU PPWR compels converters to retrofit lines for mono-material output, favoring integrated giants able to fund multi-year overhauls. In the United States and Canada, brand commitments to carbon reduction drive pilot programs that test high-recycled-content tubes at regional retailers.
LATAM, APAC and MEA Tube Packaging Market
Latin America and the Middle East are emerging opportunity zones as rising middle-class populations fuel packaged food growth. Brazil’s packaged-food market could reach USD 168.6 billion by 2028, spurring demand for portion-controlled sauces and flavored pastes. Concurrently, ALPLA’s facility roll-outs in Thailand, Africa, and the Gulf Cooperation Council underline the strategic importance of local supply in markets where import duties and logistics add cost layers.

Competitive Landscape
Moderate fragmentation characterizes the tube packaging market as leaders pursue scale to fund sustainability investments. The Amcor–Berry Global merger created an entity with more than USD 3 billion in projected annual free cash flow by 2028, while targeting USD 650 million in synergy savings. Novolex and Pactiv Evergreen’s USD 6.7 billion tie-up follows a similar logic, building critical mass in food-service and specialty packs.
Innovation leadership is another battleground. Neopac’s certified recycled-content traceability positions it as a preferred supplier for European brands seeking credible environmental claims. Aptar’s N-Sorb technology, accepted into the US FDA Emerging Technology Program, demonstrates how packaging can mitigate nitrosamine formation in pharmaceuticals, strengthening the company’s value proposition in regulated segments.
Regional expansion is accelerating as well. Amcor’s purchase of Phoenix Flexibles in Gujarat adds a scalable flexible-packaging platform in the high-growth Indian market, enhancing proximity to pharmaceutical and medical customers. These moves suggest that supply-chain resilience and local production capabilities will remain pivotal differentiators.
Tube Packaging Industry Leaders
Amcor plc
EPL Limited
Albea Group
Hoffmann Neopac AG
CCL Industries Corp.
- *Disclaimer: Major Players sorted in no particular order
Tube Packaging Market Companies Covered in this Report
- Amcor plc
- EPL Limited
- Albea Group
- Hoffmann Neopac AG
- CCL Industries Corp.
- Tubex Aluminium Tubes
- Huhtamaki Oyj
- Montebello Packaging
- LINHARDT Group GmbH
- CTLpack Group, S.L.U.
- Plastube Inc.
- Unette Corporation
- Scandolara S.p.A.
- Alltub Deutschland GmbH
- TUBETTIFICIO PERFEKTÜP S.r.l.
- AptarGroup Inc.
- Witoplast Kisielińscy Joint Stock Company
- Mpack Poland Sp. z.o.o.
- Viva Healthcare Packaging
- Gp Plast Sp. z..o.o.
- EPL Poland Sp. z.o.o.
- Elpes sp. z.o. o.
- ALPLA WERKE ALWIN LEHNER GMBH and CO KG

Market Opportunities and Future Outlook
The EU Packaging and Packaging Waste Regulation (PPWR) is creating a compliance-driven demand base for tube formats built around established recycling streams, with application beginning August 12, 2026 and a recyclability requirement by 2030. This timeline is tightening supplier qualification requirements for mono-material plastic tubes, including HDPE-rich structures, and for fiber-based alternatives. Industry proof points are reinforcing the shift, including the PaperX FibreTop tube collaboration (Hoffmann Neopac, Aisa, and Blue Ocean Closures) receiving PTS Institute certification as technically recyclable in conventional paper streams under CEPI/4evergreen 2025 protocols. At the same time, premiumization in cosmetics and personal care continues to support decoration and shelf differentiation, keeping pressure on suppliers to improve tube aesthetics without falling back on hard-to-recycle multi-layer constructions.
On the execution side, investment focus is moving toward automation and regional capacity additions that reduce lead times for personal care, food condiments, and OTC/pharma semisolids. In 2026, Aenova expanded semisolids tube packaging capacity and automation at its Feldkirchen, Germany site to at least 50 million tubes per year. Haendlmaier also commissioned a new line in Regensburg that doubles mustard tube output to 50 million units annually. Together, these actions point to near-term opportunity for tube suppliers and equipment providers that can support high-speed manufacturing, consistent quality control, and process windows compatible with recyclable-material requirements in Europe (driven by PPWR redesign cycles) and Asia-Pacific (supported by localized production footprints and recycle-ready conversion investments).
Recent Industry Developments in Tube Packaging Market
- July 2026: Amcor commenced a 7,000-square-meter expansion at its flexible packaging facility in Dongguan, China to increase production of recycle-ready packaging. The added manufacturing space supports higher regional output and helps shorten supply chains for brand owners shifting toward recyclable structures in high-volume consumer and healthcare applications.
- September 2025: Hoffmann Neopac highlighted a fully paper-stream recyclable paper tube as a centerpiece of its fiber-based packaging strategy. This framing indicates a broader push toward recyclable tubes in premium cosmetic and healthcare segments.
- June 2024: Colgate launched its clear recyclable PET Elixir toothpaste tube in North America. By combining a distinctive on-shelf appearance with a recyclable tube format, the launch reinforced brand-side demand for tubes that deliver both consumer experience and circularity-aligned material choices.


Tube Packaging Market Report Scope and Research Methodology
Market Definition and Coverage
For this study, the tube packaging market covers packaging tubes used to dispense and protect products like creams, gels, pastes, and ointments across consumer and industrial end uses, measured as total tubes shipped and consumed in a year.
Scope exclusions: This sizing excludes bottles, jars, pouches, sachets, and other non-tube packaging formats even if they serve similar applications.
Segments Covered in This Report
- By Product Type
- Plastics Tubes
- Polyethylene (PE) Tubes
- Polypropylene (PP) Tubes
- Other Plastic Tubes
- Aluminum Tubes
- Laminated tubes
- Paperboard/Bio- Based tubes
- Plastics Tubes
- By Packaging Type
- Squeeze and Collapsible
- Twist
- By End-Use Industry
- Cosmetics and Personal Care
- Pharmaceutical
- Food
- Other End-use Industry
- By Distribution Channel
- Direct Sales
- Indirect Sales
- By Geography
- North America
- United States
- Canada
- Mexico
- Europe
- Germany
- United Kingdom
- France
- Italy
- Spain
- Russia
- Rest of Europe
- Asia-Pacific
- China
- India
- Japan
- South Korea
- Australia and New Zealand
- Rest of Asia-Pacific
- Middle East and Africa
- Middle East
- United Arab Emirates
- Saudi Arabia
- Turkey
- Rest of Middle East
- Africa
- South Africa
- Nigeria
- Egypt
- Rest of Africa
- Middle East
- South America
- Brazil
- Argentina
- Rest of South America
- North America
Data Sources, Market Sizing, and Validation
Desk Research
Desk research was used to set the market boundaries, build the demand pool, and anchor assumptions that can be checked year after year. We referenced public sources such as UN Comtrade trade statistics, USITC trade data, Eurostat, and national statistics offices for output and trade signals tied to packaging materials and finished goods that heavily use tubes.
To convert these signals into a tube demand view, we reviewed filings and investor presentations for packaging suppliers and brand owners, then used data from association and standards bodies (including packaging associations and ISO-related packaging references) to sanity check material shifts and recycling-related changes. Patent databases and a paid news and company financials subscription were used to track product changes like barrier structures and closure formats, and to spot capacity expansions. These desk sources are illustrative only, and many other public references were also used to collect data, validate assumptions, and clear up open questions during the work.
Primary Interviews and Surveys
Primary interviews and surveys were used to pressure test the desk assumptions around tube demand, typical pack sizes, and material substitution across plastic, aluminum, and laminated structures. We spoke with respondents across manufacturing, sales, procurement, and product teams, and coverage was balanced across APAC, EMEA, and the Americas so regional consumption patterns and regulatory impacts could be compared on the same basis.
Distribution of primary research fieldwork respondents
| Company type | Respondent position | Region |
|---|---|---|
| Top tier: 28% | CXOs: 16% | APAC: 47% |
| Mid tier: 52% | Functional/Unit leaders: 36% | EMEA: 29% |
| Smaller Players: 20% | Managers: 48% | Americas: 24% |
Market-Sizing & Forecasting
Sizing started from a top down build where end use demand was reconstructed using consumption indicators for tube heavy categories (such as oral care, skin care, topical pharma, and selected food pastes), and then converted into tube units using typical pack size and pack format shares provided by interviewees. Once the demand pool was formed, it was split by major regions and then adjusted for trade flows, local production footprints, and channel differences so the totals stay realistic.
To corroborate the totals, we performed selective bottom up approximations using supplier and converter revenue disclosures, capacity announcements, and sampled volume to ASP relationships where data was available. This then helped correct overstated or understated unit counts. Key model inputs included average tube weight and structure mix (plastic, aluminum, laminated), closure and dispensing format trends, sustainability driven down-gauging and recycled content adoption, price and availability of key resins and aluminum, and the rate of shift toward barrier laminates for sensitive formulations. Forecasting was handled using scenario analysis supported by regression checks on drivers like personal care output and pharma consumption, with assumptions refined after re-checking the most sensitive variables with experts. When company level signals were incomplete, gaps were handled through conservative regional proxies tied to end use category growth and material mix, and then reviewed again for consistency with trade and capacity signals.
Data Validation & Update Cycle
Outputs were validated by comparing model totals against independent indicators, including trade trends, material consumption movements, and capacity utilization narratives that appeared consistently across sources. Where large variances showed up, we reopened the assumptions and cross-checked, followed by targeted re-contacts to clarify whether the issue came from pack size, format substitution, or regional allocation.
Before sign-off, the model is reviewed in steps so calculation logic, unit conversions, and region splits are checked by another analyst and then reconciled back to the core demand drivers. The report is refreshed annually, and interim updates are triggered when material events occur (such as major capacity additions, policy shifts tied to packaging waste, or sharp raw material price changes). Right before delivery, a final pass is completed so clients receive the latest view aligned to the most recent public signals and expert feedback.
Mordor Intelligence's Tube Packaging Market Size Compared Against Other Published Estimates
Published market sizes for tube packaging do not always match because firms measure different things, in different units, and under different category boundaries. The table helps show how shifts in unit basis, included formats, and timing choices can move the final number even when the end uses look similar.
The biggest gap drivers here are whether the estimate is reported in units versus USD value, whether adjacent formats (like stick packs or non-tube dispensing packs) get counted, and how fast pricing is assumed to move by material type. Some estimates also anchor on a different base year, then apply a higher or lower scenario for mix shift into laminated tubes, which changes the implied market value even if volume growth looks steady.
Benchmark comparison
| Source | Market Size | Gaps in Research Methodology |
|---|---|---|
| Mordor Intelligence | USD 55.69 B (2026) | |
| Global Consultancy A | USD 14.36 B (2026) | Reported as market value in USD, which compresses the figure versus unit-based reporting, and it typically applies an ASP build that blends tube types and materials rather than keeping unit counts as the core sizing metric. |
| Industry Publisher B | USD 13.00 B (2025) | Uses a different base year and a value-only approach, and it can vary by how closures, dispensing features, and manufacturing technology splits are grouped, which changes what is counted as tube packaging versus a broader flexible packaging bucket. |
The table shows a clear unit versus value mismatch, and in Mordor Intelligence's model the market is expressed in tube units rather than revenue, which explains why the displayed number sits far away from USD-based totals. Once the same unit basis and scope are aligned, the remaining differences usually come down to pack size assumptions, material mix progression, and how often the model is refreshed after major shifts in end use demand and input costs.


Key Questions Answered in the Report
What is the current size of the tube packaging market?
The tube packaging market size is 55.69 billion units in 2026 and is projected to reach 71.64 billion units by 2031.
Which material leads the tube packaging market?
Plastic tubes hold 62.53% of 2025 volumes, although paperboard and bio-based formats are rising fastest at 8.58% CAGR.
Which end-use segment is growing the quickest?
Food applications show the highest growth, advancing at an 6.36% CAGR on the back of demand for condiment and ready-to-eat product formats.
Why are mono-material tubes gaining traction?
EU regulations require all packaging to be recyclable by 2030, and mono-material constructions simplify recycling while maintaining barrier performance.
How is Asia-Pacific positioned in the tube packaging market?
Asia-Pacific commands 35.38% of global volumes and is expected to grow at 5.74% CAGR, driven by FMCG expansion and rising consumer spending.
What impact do mergers have on market dynamics?
Large mergers, such as Amcor with Berry Global, provide scale to fund sustainable innovation and consolidate market power, reinforcing moderate concentration.
Page last updated on:


 Your data is secure and never sold or shared.


