
Market Overview
| Study Period | 2019 - 2031 |
|---|---|
| Forecast Data Period | 2026 - 2031 |
| Base Year Market Size (2025) | USD 19.87 Billion |
| Market Size (2026) | USD 21.01 Billion |
| Market Size (2031) | USD 27.80 Billion |
| Growth Rate (2026 - 2031) | 5.76 % |
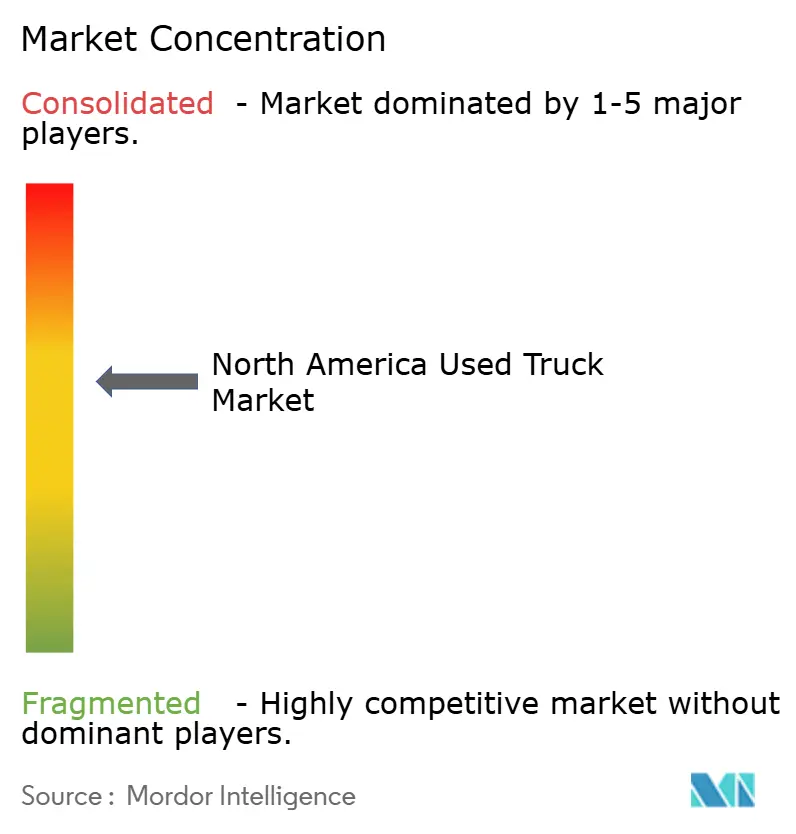
| Market Concentration | Medium |
Major Players *Disclaimer: Major Players sorted in no particular order Image © Mordor Intelligence. Reuse requires attribution under CC BY 4.0. | |
North America Used Truck Market Analysis by Mordor Intelligence
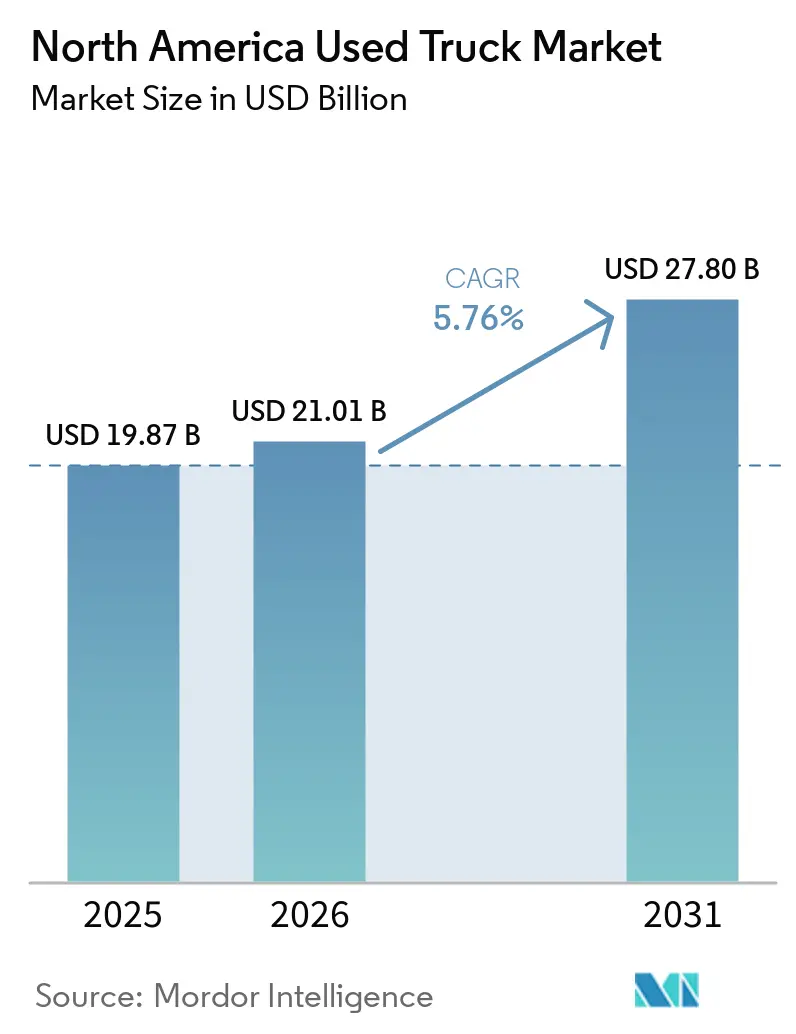
The North American used truck market size was valued at USD 19.87 billion in 2025 and is projected to expand from USD 21.01 billion in 2026 to USD 27.80 billion by 2031, registering a 5.76% CAGR between 2026 and 2031. Fleet managers continue to redirect capital toward pre-owned inventory because semiconductor shortages that suppressed new Class 8 production through 2024 produced a residual order backlog that still limits fresh supply in 2026. Certified-pre-owned (CPO) financing from PACCAR, Daimler Truck North America, and Volvo Group is tightening the spread between used and new monthly payments, nudging buyers toward late-model units that already include collision-mitigation and telematics hardware. California's Advanced Clean Fleets rule mandates that high-priority operators must ensure 50% of their new purchases are zero-emission, with a target of reaching 100% by 2027 [1]“Advanced Clean Fleets Regulation,” California Air Resources Board, arb.ca.gov. This regulation is hastening the disposal of diesel equipment in the West and simultaneously driving up premiums for compliant assets in neighboring states. E-commerce parcel volumes with year-on-year growth in 2025 are pushing light- and medium-duty truck demand faster than OEMs can build new vans, cementing a structural tilt toward Class 3-5 platforms that cost 40–60% less than comparably spec’d new vehicles. Interest-rate headwinds—floor-plan charges in early 2026—are forcing dealers to shorten inventory cycles, favoring units under seven years old that turn within 30 days and carry OEM-linked warranty coverage.
Key Report Takeaways
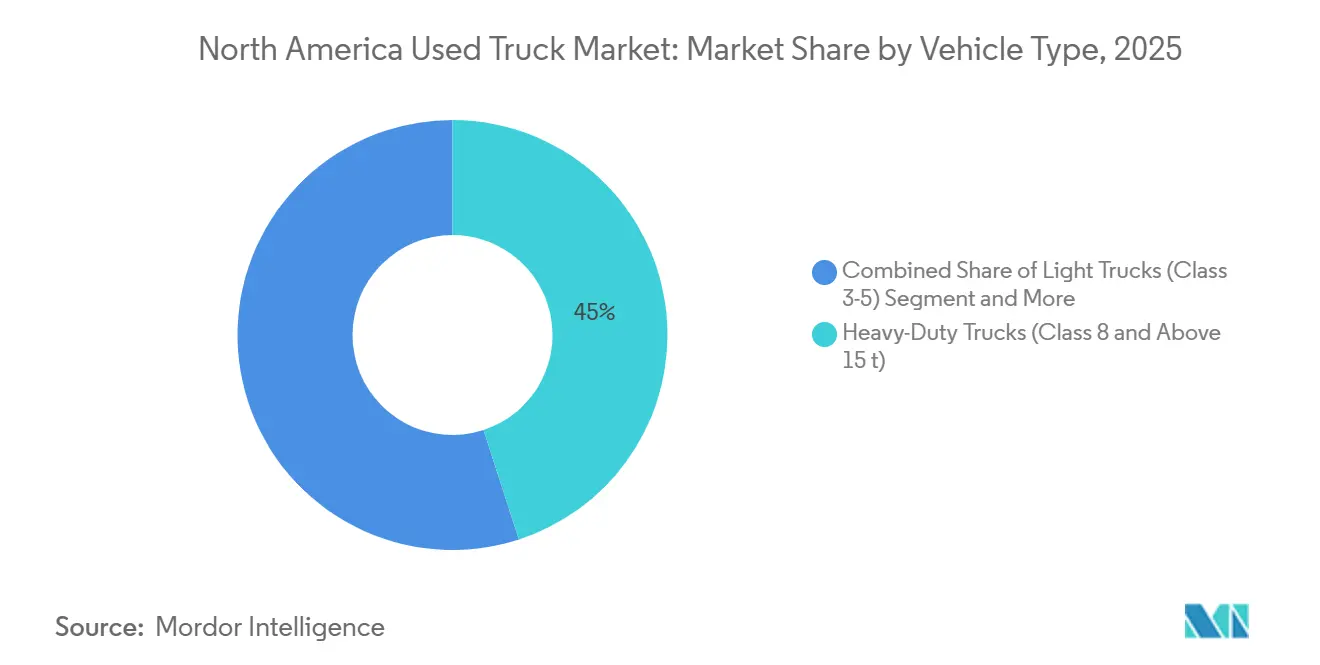
- By vehicle type, heavy-duty trucks retained the largest 45.03% share of the North America used truck market in 2025, while light trucks are forecast to post the fastest 6.63% CAGR through 2031.
- By fuel type, diesel led with 75.12% North America used truck market share in 2025, but hybrid and battery-electric units represent the quickest-growing cohort at 14.12% CAGR to 2031.
- By age, 4-to-7-year-old units commanded 39.25% of the 2025 value, whereas trucks up to three years old are projected to expand at 7.05% CAGR through 2031.
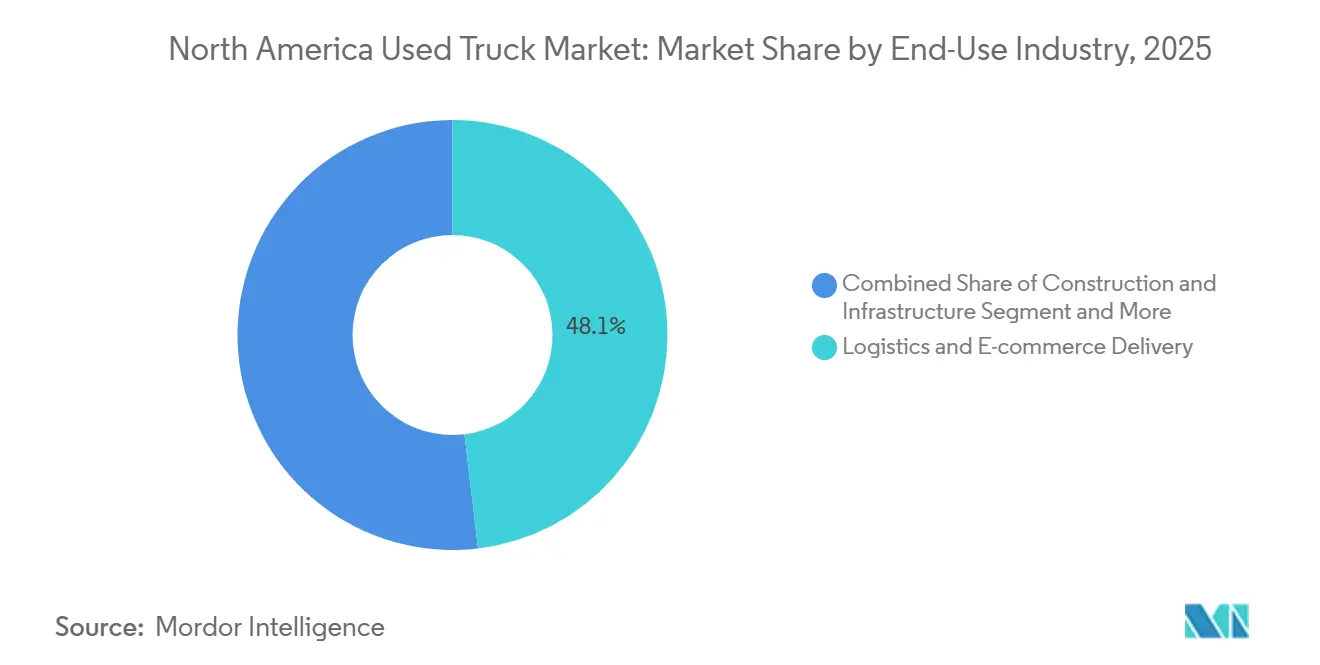
- By end-use industry, logistics and e-commerce delivery captured a leading 48.11% revenue share in 2025 and continue to advance at a 6.02% CAGR over 2026-2031.
- By sales channel, independent dealers accounted for a 42.35% slice of 2025 turnover, while online peer-to-peer and auction platforms are expanding at 8.12% CAGR.
- By country, the United States accounted for 83.05% share in 2025, while the rest of North America is set to expand at a 6.34% CAGR.
Note: Market size and forecast figures in this report are generated using Mordor Intelligence’s proprietary estimation framework, updated with the latest available data and insights as of January 2026.
North America Used Truck Market Trends and Insights
Drivers Impact Analysis*
| Driver | (~) % Impact on CAGR Forecast | Geographic Relevance | Impact Timeline |
|---|---|---|---|
| E-Commerce Boosting Short-Haul Freight | +1.2% | United States urban corridors, Canada (Toronto–Montreal axis) | Medium term (2-4 years) |
| Tight New-Truck Supply | +1.1% | North America-wide | Short term (≤ 2 years) |
| OEM-Led CPO Programs | +0.9% | United States, Canada | Short term (≤ 2 years) |
| CARB and EPA GHG Fleet-Renewal | +0.8% | California, NE CARB states, Canada ZEV mandate | Long term (≥ 4 years) |
| Predictive-Maintenance Extending Service Life | +0.7% | United States, Canada | Medium term (2-4 years) |
| Corporate ESG Mandates Circular-Fleet | +0.6% | US Fortune 500 fleets, Canada | Long term (≥ 4 years) |
| Source: Mordor Intelligence | |||
Rapid E-Commerce Growth Boosting Short-Haul Freight Demand
Parcel deliveries rose significantly in 2025, compressing fulfillment windows and obliging logistics providers to field more Class 3-5 trucks per route-mile. Used light- and medium-duty units meet maneuverability requirements at 40–60% of new prices, hence capital-efficient fleets snap them up within 30 days of listing. Urban return-to-base patterns dilute the disadvantage of extra maintenance on older assets because predictive servicing minimizes downtime. As e-commerce penetration advances in 2025 and is expected to grow further by 2028, short-haul freight capacity continues to expand more quickly than OEM production, supporting sustained premiums for three-to-seven-year-old trucks. The North American used truck market, therefore, benefits from a structural, not cyclical, uplift in urban-delivery equipment turnover.
Tight New-Truck Supply Due to Semiconductor Shortages Creating Residual Demand
In 2025, Class 8 output remained below the pre-pandemic peak due to ongoing chip allocation challenges. Fleets extended their replacement cycles, leading to a significant increase in residual values for used tractors. Tractors equipped with ADAS technology now command record-high prices relative to their original value, altering the typical depreciation curve. While fab capacity is expected to normalize in 2026, bespoke specifications continue to face extended lead times. This delay allows ready-to-roll used inventory to maintain premium margins. Dealers capable of delivering within a short timeframe are capitalizing on this opportunity, bolstering the supply-constrained pricing dynamics that support the North American used truck market.
OEM-Led Certified Pre-Owned (CPO) Programs Expanding Finance Access
In 2024-2025, PACCAR, Daimler, and Volvo introduced low APR offers on their certified programs, extending powertrain warranties on late-model trucks. By sidestepping traditional floor-plan lenders, CPO loans empower OEMs to harness interest spreads and solidify their parts and service ties. The integration of warranty and telematics has led to a significant reduction in unscheduled downtime, thereby lowering the total cost of ownership and validating the premium on CPO units. With large fleets noting that CPO financing terms now match or surpass their bank offers, independent dealers face pressure. They must either carve out niche specializations or forge alliances with captive finance arms. Adding to the allure, many CPO units come pre-equipped with retrofits that comply with EPA's Greenhouse Gas Phase 2 regulations, saving buyers substantial post-purchase expenses. As a result, CPO platforms are reshaping the North American used truck landscape into a two-tier system, distinguished by capital-cost advantages and warranty coverage.
CARB and EPA GHG Phase 3 Regulations Accelerating Fleet-Renewal Cycles
California's Advanced Clean Fleets regulation mandates that high-priority operators transition the majority of their annual vehicle purchases to zero-emission models by 2027. At the same time, the EPA's Greenhouse Gas Phase 3 standards, finalized in 2024, call for a significant reduction in CO₂ emissions from new heavy-duty vehicle models 2027-2032. In response, operators are proactively selling off diesel vehicles from a specific range of model years. This has led to a geographic price discrepancy, with variations in pricing between states like Texas and California. Furthermore, several other states are set to adopt CARB's regulations by 2027, broadening this compliance-driven shift to encompass a substantial portion of the U.S. heavy-duty vehicle demand. As a result, even with tightening zero-emission mandates, the North American used truck market sees a consistent influx of vehicles due to these accelerated replacement cycles driven by regulatory pressures.
Restraints Impact Analysis*
| Restraint | (~) % Impact on CAGR Forecast | Geographic Relevance | Impact Timeline |
|---|---|---|---|
| Volatile Spot-Freight Rates | -0.8% | U.S. South and Midwest clusters | Short term (≤ 2 years) |
| Rising Interest Rates Inflating Costs | -0.7% | North America-wide | Medium term (2-4 years) |
| Driver Shortage Limiting Capacity | -0.5% | United States, Canada | Long term (≥ 4 years) |
| Inadequate Public Charging for Electric Trucks | -0.4% | U.S. outside CA, Canada | Medium term (2-4 years) |
| Source: Mordor Intelligence | |||
Volatile Spot-Freight Rates Eroding Owner-Operator Purchasing Power
In 2025, dry-van spot averages declined, barely surpassing the cost threshold that independent operators typically face. That year saw a significant exit of owner-operators, shrinking the market for tractors in the price range favored by independents. A shift towards shorter hauls has diminished the demand for sleeper cabs, a staple of the owner-operator model. California's AB5 reclassification led to a notable reduction in independent contractors during 2024-2025, curbing their discretionary spending. Dealers catering to these independents now face a choice: adopt revenue-based repayment strategies or risk stagnant inventory, which could stifle growth in North America's used truck market.
Rising Benchmark Interest Rates Inflating Floor-Plan and Lease Costs
As the federal funds target remains steady through early 2026, dealer floor-plan APRs have significantly increased. This rise adds notable costs to units held for extended periods. In 2025, full-service leases for Class 8 tractors experienced a considerable increase compared to 2022. Small businesses, dependent on commercial banks, are encountering stricter credit evaluations, pushing them towards older and more affordable equipment. While dealers are shortening stocking cycles and prioritizing presold consignments, the weight of interest rates is still expected to reduce the projected CAGR of the North American used truck market.
*Our forecasts treat driver/restraint impacts as directional, not additive. The impact forecasts reflect baseline growth, mix effects, and variable interactions.
Segment Analysis
By Vehicle Type: E-Commerce Fuels Light-Truck Momentum
Light trucks secured a modest slice in 2025, yet will outpace all classes at 6.63% CAGR as last-mile couriers expand dense urban routes where vans outperform tractors for cost per stop. Heavy-duty vehicles clung to a dominant 45.03% share because long-haul freight and vocational payloads still require Class 8 muscle. Medium-duty units straddle regional distribution and benefit from emerging battery ranges of 150–200 miles that dovetail with depot return cycles. Rising e-commerce share, now 16% of retail, propels high-frequency deliveries, tilting procurement toward Class 3-5 platforms that turn every three to five years, injecting nearly new units back into the North America used truck market. Dealers focusing on quick-turn retail vans match capital-efficiency priorities of parcel integrators, whereas vocational heavy-duty assets retain premium residuals where specialized configurations curb cross-segment competition.
Late-model sleepers replete with lane-keeping and collision-mitigation tech command top valuations because long-haul carriers need both compliance and driver-retention features. Meanwhile, medium-duty buyers weigh diesel’s mature refueling network against tightening mandates that will require 40% zero-emission penetration by 2032 in CARB states, creating uneven depreciation landscapes. For remarketers, finely tuned inventory segmentation—urban delivery versus regional hub-and-spoke versus bona-fide long haul—now shapes gross-margin optimization across the North America used truck market size continuum.



By Fuel Type: Electrification Carves Early Beachheads
Diesel still covered 75.12% of 2025 demand, yet hybrids and battery-electrics will advance 14.12% annually from a low base as CARB and corporate ESG imperatives bite. Gasoline survives in light-duty municipal niches, while CNG and LNG enjoy pockets of growth where renewable natural-gas supply chains slash lifecycle emissions up to 80%. The trickle of 2021–2023 eCascadias and VNR Electrics entering secondary channels broadens buyer access, though pack health remains an evaluation hurdle lacking uniform testing. Units carrying verified 85–90% capacity sell for 30-40% below new, enticing early adopters in subsidy-rich states.
Over the forecast period, diesel’s supremacy eases but does not break because energy-density and refueling-time metrics still favor fossil fuel above 400-mile daily duty cycles. Nevertheless, medium-duty BEVs find cost parity on depot-charged regional routes, channeling incremental share into segments previously diesel-dominated. The hybrid bridge solution grows among fleets seeking partial emissions relief without range compromises. In aggregate, these shifts delicately rebalance the North America used truck market share among fuel types while preserving diesel as the anchor in high-utilization lanes.
By Age: Telematics Drive Premiums for Near-New Stock
Units aged four to seven years controlled 39.25% of 2025 proceeds, mixing cost rationale with sufficient technology currency. However, sub-three-year trucks should clock a 7.05% CAGR through 2031 as CPO finance penetrates deeper, shortening holding periods for large carriers. Buyers flock to models built 2021 onward because ADAS provisions secure 10-15% insurance discounts, and EPA monitoring rules set for 2027 require native telematics.
Older than eight years, residual values feel mounting regulatory friction; California’s annual emissions test for pre-2013 engines layers compliance cost onto low-budget buyers. Even so, price-elastic owner-operators still populate this 8-to-12-year bracket for sub-USD 40,000 assets when credit tightens. Dealers adding plug-and-play telematics retrofits can uplift margins while meeting fleet compliance needs, an emerging niche that fortifies diversity across the North American used truck market size spectrum.
By End-Use Industry: Logistics Commands, Construction Stabilizes
Logistics and e-commerce retained a 48.11% slice in 2025, slated to compound 6.02% as parcel networks chase urban delivery density. Infrastructure construction, buoyed by significant investments in federal spending, supports counter-cyclical demand for vocational bodies impervious to freight-rate swings. Mining spikes hinge on commodity cycles; lithium and copper output lifts off-road truck upgrades in the Southwest when prices climb, feeding used availability two to three years later. Agriculture, sensitive to grain pricing, flexes seasonal purchases in the Midwest, while municipal fleets trend toward alternative fuels to satisfy local ordinances, pushing diesel cast-offs into deregulated geographies.
This mosaic ensures that no single macro shock can derail overall growth; weakness in long-haul freight or agriculture may be offset by parcel or public-works surges. Dealers' mapping application mix against age and powertrain flavors will capture asymmetric pockets of profitability within the broader North America used truck market.
By Sales Channel: Digital Auctions Accelerate Transparency
Independent dealers still led with 42.35% in 2025 by leveraging local relationships and flexible terms, yet online platforms expand 8.12% annually as Ritchie Bros integrates IronPlanet’s AI-scored condition reports to slash buyer uncertainty. Younger decision-makers now default to digital discovery, widening geographic reach and compressing gross margins for brick-and-mortar lots. OEM-affiliated CPO arms exploit sub-5% APR financing and warranty bundles, winning credit-worthy fleets and floating premium price tiers.
Consequently, inventory bifurcates: high-spec late-models gravitate to OEM portals, while older vocational assets circle independent lots with onsite service capacity. Peer-to-peer auctions siphon mid-life tractors where condition transparency and escrow services neutralize distance. This triangulation re-shapes the competitive map of the North American used truck market share among channels.
Geography Analysis
The United States contributed 83.05% of the 2025 revenue pool and will keep anchoring the North American used truck market due to its significant freight economy. California alone wielded one-quarter of national transactions, its CARB rules accelerating diesel disposals that cascade into interstate price arbitrage. Midwest and Southern corridors stabilize demand for Class 8 diesels on manufacturing and agriculture lanes, while the Northeast aligns with CARB, hiking fleet-renewal tempo. E-commerce hotbeds—New York, Los Angeles, Chicago—subsume 40% of urban Class 4-5 placements, inflating premiums for low-mileage vans.
Canada trails yet rides a federal mandate calling for 35% medium- and heavy-duty ZEV share by 2030 [2]“Zero Emission Medium-Duty Roadmap 2025,” Transport Canada, tc.canada.ca. A 2024 rollout of mandatory ELDs forced the retirement of pre-2010 non-telematics trucks, temporarily depressing prices 10%. Ontario and Quebec dominate freight volume and cross-border activity, while Alberta’s resource sector props up heavy vocational demand. Carbon pricing at CAD 80 (USD 59) per tonne spurs CNG conversions in long haul, circulating older diesels southward.
Rest of North America—predominantly Mexico—advances at 6.34% CAGR as near-shoring channels escalate. AMIA recorded a significant fleet jump in 2025 on appliance and auto plant relocations. Regulatory latency allows import of pre-2015 U.S. diesels shunned by CARB, sustaining bilateral equipment flows. Mexico adopted EPA-equivalent NOM-044 in 2024 but enforcement lags, offering a provisional outlet for U.S. overage stock. Consequently, geographic arbitrage absorbs regulatory cast-offs, lengthening asset life and cushioning supply swings in the wider North America used truck market size narrative.
Competitive Landscape
In 2025, the top players secured a significant share of the transaction value, indicating a moderately concentrated market. CPO frameworks from industry giants like PACCAR, Daimler Truck North America, and Volvo Group dominate the landscape, offering warranty and financing perks that independent players find hard to replicate. Rush Enterprises exploits a 140-strong service network across 23 states, bundling maintenance contracts that raise switching costs [3]“Form 10-K 2024,” Rush Enterprises, investor.rushenterprises.com. Penske Used Trucks pursues similar stickiness through nationwide rental and telematics services.
Digital disruptors heighten transparency demands; for instance, IronPlanet’s computer-vision reports not only reduce inspection budgets but also attract remote bidders, decreasing deal friction. Meanwhile, smaller players like Arrow Truck Sales focus on specialized niches, where body customization limits substitutes, allowing them to command higher margins despite their smaller scale. Additionally, dealers with in-house emissions-test rigs are capitalizing on California’s Heavy-Duty Inspection and Maintenance program, certifying older assets that others are eager to offload.
Following semiconductor shortages, OEM captives are leveraging financial tools to redirect trade-ins through their branded portals, thereby capturing revenue from residual parts. Independents, on the other hand, are responding with rapid inventory turnover and adaptable terms for owner-operators. Consequently, the North American used truck market is evolving based on capabilities—such as financial influence, digital presence, and aftermarket services—rather than just the volume of vehicles sold.
North America Used Truck Industry Leaders
PACCAR Inc
Daimler Truck North America
Volvo Group
International Motors, LLC
Rush Enterprises, Inc.
- *Disclaimer: Major Players sorted in no particular order

Recent Industry Developments
- October 2025: The White House announced a 25% tariff on imported medium- and heavy-duty trucks effective 1st November 2025, a move expected to elevate purchase costs and nudge fleets toward domestic and used alternatives.
- July 2025: Rush Truck Centers entered a strategic alliance with Asset IQ to provide repair, reconditioning, and remarketing services across its 140-location footprint, broadening value-added offerings for financial-institution repossessions.


North America Used Truck Market Report Scope
The scope includes segmentation by vehicle type (light trucks (class 3-5), medium-duty trucks (class 6-7), and heavy-duty trucks (class 8 and above 15 t)), fuel type (diesel, gasoline, natural gas and LPG, hybrid and battery-electric), age (up to 3 years, 4 to 7 years, 8 to 12 years, and above 12 years), end-use industry (construction and infrastructure, logistics and e-commerce delivery, mining and quarrying, agriculture and forestry, municipal and utilities, and others), and sales channel (independent dealer, franchised dealer, OEM-backed certified pre-owned, and online peer-to-peer and auction). The analysis also covers country-level segmentation, including the United States, Canada, and the rest of North America. Market size and growth forecasts are presented by value in USD and by volume in units.
By Vehicle Type
| Light Trucks (Class 3-5) |
| Medium-Duty Trucks (Class 6-7) |
| Heavy-Duty Trucks (Class 8 and Above 15 t) |
By Fuel Type
| Diesel |
| Gasoline |
| Natural Gas and LPG |
| Hybrid and Battery-Electric |
By Age
| Up to 3 Years |
| 4 to 7 Years |
| 8 to 12 Years |
| Above 12 Years |
By End-Use Industry
| Construction and Infrastructure |
| Logistics and E-commerce Delivery |
| Mining and Quarrying |
| Agriculture and Forestry |
| Municipal and Utilities |
| Others |
By Sales Channel
| Independent Dealer |
| Franchised Dealer |
| OEM-Backed Certified Pre-Owned |
| Online Peer-to-Peer and Auction |
By Country
| United States |
| Canada |
| Rest of North America |
| By Vehicle Type | Light Trucks (Class 3-5) |
| Medium-Duty Trucks (Class 6-7) | |
| Heavy-Duty Trucks (Class 8 and Above 15 t) | |
| By Fuel Type | Diesel |
| Gasoline | |
| Natural Gas and LPG | |
| Hybrid and Battery-Electric | |
| By Age | Up to 3 Years |
| 4 to 7 Years | |
| 8 to 12 Years | |
| Above 12 Years | |
| By End-Use Industry | Construction and Infrastructure |
| Logistics and E-commerce Delivery | |
| Mining and Quarrying | |
| Agriculture and Forestry | |
| Municipal and Utilities | |
| Others | |
| By Sales Channel | Independent Dealer |
| Franchised Dealer | |
| OEM-Backed Certified Pre-Owned | |
| Online Peer-to-Peer and Auction | |
| By Country | United States |
| Canada | |
| Rest of North America |


Key Questions Answered in the Report
How large will North America’s used truck fleet spending be by 2031?
It is projected that the North America used truck market will reach USD 27.80 billion by 2031 on a 5.76% CAGR path.
Which vehicle type grows fastest in resale demand?
Light-duty (Class 3-5) trucks should post the quickest 6.63% CAGR as e-commerce drives urban delivery density.
What portion of secondary-market trucks remains diesel powered?
Diesel accounted for 75.12% of 2025 turnover and, while eroding, will still dominate long-haul segments through the forecast.
Are online auctions overtaking physical dealerships?
Online peer-to-peer and auction platforms are climbing 8.12% annually, but independents still retain the largest share thanks to localized service and flexible finance offerings.
Page last updated on:


 Your data is secure and never sold or shared.


